This article has been accepted for publication and undergone full peer review but has not been through the copyediting, typesetting, pagination and proofreading process which may lead to differences between this version and the Version of Record. Please cite this article as doi: 10.1029/2019TC005552
Franke Dieter (Orcid ID: 0000-0002-1488-026X) Klitzke Peter (Orcid ID: 0000-0001-9333-7734) Berndt Cristian (Orcid ID: 0000-0001-5055-0180) Damm Volkmar (Orcid ID: 0000-0001-5766-587X) Dannowski Anke (Orcid ID: 0000-0001-8581-7500) Ehrhardt Axel (Orcid ID: 0000-0001-9842-0940) Engels Martin (Orcid ID: 0000-0002-6671-5899) Funck Thomas (Orcid ID: 0000-0003-3646-490X)
Geissler Wolfram Hartmut (Orcid ID: 0000-0001-6807-555X) Schnabel Michael (Orcid ID: 0000-0001-9753-0208)
Polyphase magmatism during the formation of the northern East Greenland continental margin
D. Franke1, P. Klitzke1, U. Barckhausen1, K. Berglar1, C. Berndt2, V. Damm1, A.
Dannowski2, A. Ehrhardt1, M. Engels1, T. Funck3, W. Geissler4, M. Schnabel1, M.
Thorwart6, and Per Trinhammer5
1BGR - Federal Institute for Geosciences and Natural Resources, Hannover, Germany.
2GEOMAR - Helmholtz Centre for Ocean Research, Kiel, Germany.
3GEUS - Geological Survey of Denmark and Greenland, Copenhagen, Denmark.
4AWI - Alfred-Wegener-Institute, Bremerhaven, Germany
5Department of Geoscience, Aarhus University, Denmark
6Applied Geophysics, Christian-Albrechts-Universität zu Kiel, Germany
Corresponding author: Dieter Franke (Dieter.Franke@bgr.de)
Key Points:
Polyphase Cenozoic volcanic rifting and consecutive emplacement of breakup-related lava flows units along the northern East Greenland margin
Breakup along restricted margin segments is followed by north to south directed progressive opening of the Greenland Sea
Widespread post-middle Eocene (< 40 Ma) offshore magmatism, associated with the breakup of the Jan Mayen microcontinent from East Greenland
Abstract
New marine geophysical data acquired across the partly ice-covered northern East Greenland continental margin highlight a complex interaction between tectonic and magmatic events. Breakup-related lava flows are imaged in reflection seismic data as seaward dipping reflectors (SDRs), which are found to decrease in size both northwards and southwards from a central point at 75° N. We provide evidence that the magnetic anomaly pattern in the shelf area is related to volcanic phases and not to the presence of oceanic crust. The remnant magnetization of the individual lava flows is used to deduce a relative timing of the emplacement of the volcanic wedges. We find that the SDRs have been emplaced over a period of 2-4 Ma progressively from north to south and from landward to seaward. The new data indicate a major post-middle Eocene magmatic phase around the landward termination of the West Jan Mayen Fracture Zone. This post-40 Ma volcanism likely was associated with the progressive separation of the Jan Mayen microcontinent from East Greenland. The break- up of the Greenland Sea started at several isolated seafloor spreading cells whose location was controlled by rift structures and led to the present-day segmentation of the margin. The original rift basins were subsequently connected by steady-state seafloor spreading that propagated southwards, from the Greenland Fracture Zone to the Jan Mayen Fracture Zone.
1 Introduction
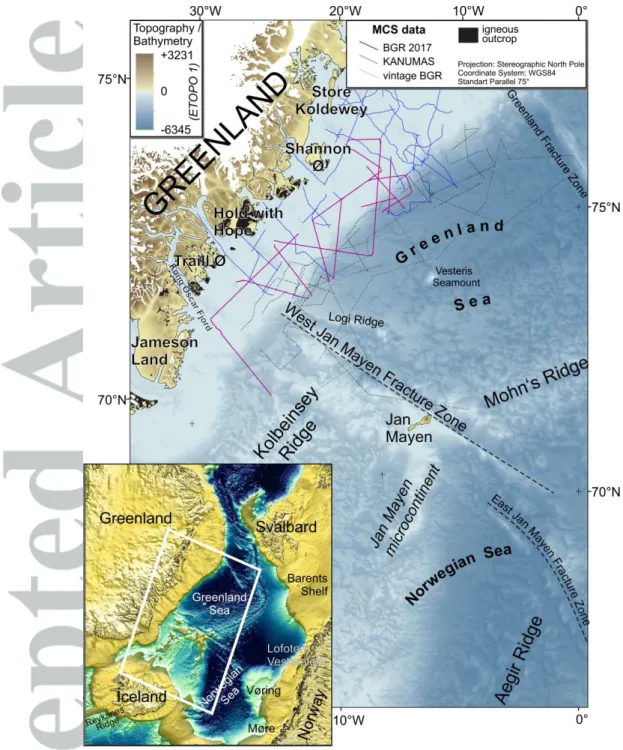
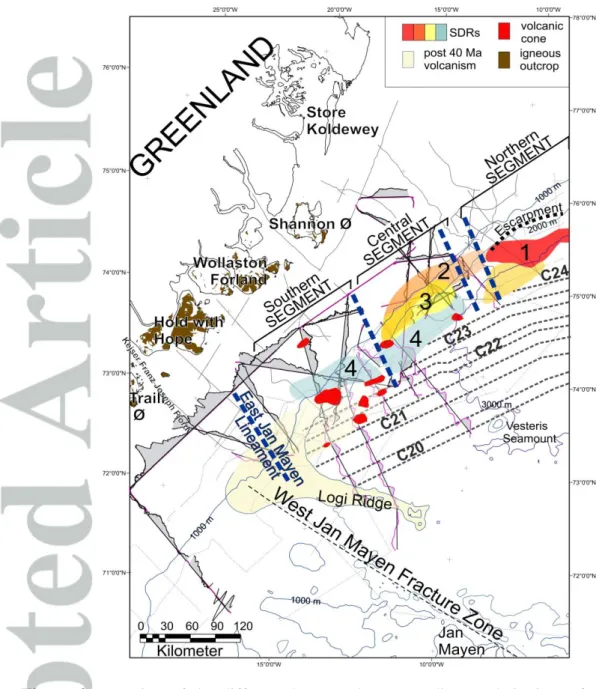
Information on the continental breakup and opening of the Norwegian-Greenland Sea in the North Atlantic Ocean is preserved along the continental margins off northern East Greenland and Norway. However, in comparison to the Norwegian margin, the conjugate East Greenland margin is only sparsely explored. Here, we focus on the northern East Greenland margin, between the West Jan Mayen and the Greenland Fracture Zones (Fig. 1).
This margin is well known to originate from volcanic rifting. Hinz et al. [1987] suggested that an inner seaward dipping reflector (SDR) sequence marks the beginning of an excessive volcanic episode, resulting in the emplacement of the East Greenland plateau basalts. Results from a commercial seismic reconnaissance survey, mostly across the inner NE Greenland shelf to the north of the study area were summarized by Hamann et al. [2005], with our study area interpreted as “volcanic province”. Based on the same data set, Tsikalas et al. [2005]
proposed conjugate sets of transfer zones on the NE Greenland shelf and the Vøring Plateau, which are thought to have segmented the rift before breakup occurred. However, this has been challenged based on new magnetic data by Olesen et al. [2007]. Hamann et al. [2005]
and Berger and Jokat [2008] provide a first view of the sediment distribution and tectonic features along the East Greenland continental margin and Petersen et al. [2015] present a detailed investigation of the Paleogene succession on the Northeast (NE) Greenland shelf.
However, available scientific multichannel seismic data are sparse and often lack penetration.
Thus, most structural interpretations on the NE Greenland shelf and margin are derived from potential field data or extrapolation of conjugate structures [e.g. Tsikalas et al., 2002].
Our study builds on the recognition of seaward dipping reflectors (SDRs) and other volcanic features from the previous studies and combines these observations with our newly acquired seismic reflection and magnetic data to derive the structural variability of rifting and magmatism along the margin. Based on a detailed investigation of breakup-related lava flow units, we aim at deciphering the transition from the final rifting to the breakup phase at the northern East Greenland margin.
1.1 The Northern East Greenland Shelf: Geodynamic and Geological Background
Subsequent to the Silurian‐ Devonian Caledonian orogeny, several periods of extensional deformation affected the northern North Atlantic region during the late Paleozoic
and Mesozoic before the final rifting phase in the Late Cretaceous/Paleocene, resulting in the break-up of the continent [Brekke et al., 2001; Eldholm et al., 1987; Mosar et al., 2002].
Initial seafloor spreading involved the Reykjanes, Aegir, and Mohn’s mid-oceanic ridges (Fig. 1). The latter two are separated by the (East) Jan Mayen Fracture Zone. South of the Jan Mayen Fracture Zone, the original volcanic rifted continental margin on the Greenland side of the incipient ocean basin is now represented by the eastern side of the Jan Mayen microcontinent. Gernigon et al. [2012] conclude from the fan-shaped magnetic anomaly pattern in the Norway Basin (Fig. 1) that a counter-clockwise rotation of the Jan Mayen micro-continent initiated at around 49-46 Ma (chrons C22n-C21n; time-scale here and in the following according to Ogg [2012]; see Table 1). Subsequently, rifting gradually propagated northward on the western side of the Jan Mayen microcontinent, likely from the middle Eocene (chron C21) onward [Blischke et al., 2016]. The magma-poor breakup at the SW corner of the Jan Mayen microcontinent is vaguely interpreted to have occurred in the earliest Oligocene (chron C13n; 33.7-33.2 Ma; cf. Table 1) [Blischke et al., 2016]. From magnetic data, Gernigon et al. [2012], following Vogt et al. [1980] suggest that the breakup between the Jan Mayen micro-continent and Greenland was finalized in the earliest Miocene (C6b, 23- 22.5 Ma), initiating the Kolbeinsey Ridge that links up with the Mohn’s Ridge via the West Jan Mayen Fracture Zone (cf. Fig. 1). It is presently unclear if the northward propagating rifting and breakup took such a long time, or if the vaguely defined ages need correction (see discussion in Gernigon et al., [2012]).
1.2 Breakup-Related Magmatism and Seaward Dipping Reflectors (SDRs)
There is consensus that the regional Late Cretaceous to early Eocene rift episode [Doré et al., 1999; Faleide et al., 2010; Hopper et al., 2014; Skogseid et al., 2000] of the North Atlantic region was accompanied by a significant magmatic event (see Meyer et al.
[2007], Horni et al. [2017] and Wilkinson et al. [2016] for reviews). However, it is unclear if all of the magmatic intrusive and extrusives rocks of the North Atlantic large igneous province can be related to this event, as suggested earlier [Eldholm, 1991; Hinz et al., 1987].
According to Meyer et al. [2007], there is solid evidence of prolonged magmatism after continental separation on Iceland and along the northern parts of the East Greenland margin.
Additionally, a review of geochronological data [Wilkinson et al., 2016] questions the earlier suggested gaps or multiple ‘pulses’ in magmatic activity in East Greenland [Price et al., 1997]. There is consensus that the largest eruption rates took place at 56–54 Ma but the
volcanism was not equally distributed. Conjugate to the NE Greenland shelf, magmatic productivity of the Paleocene to early Eocene volcanism decreased from the central Vøring margin towards the south and north, respectively [Berndt et al., 2001a], indicating melt supplies from a relatively confined magmatic source [Hansen et al., 2009]. This is in line with the rapid post-volcanic cooling period from 52–45 Ma seen in Jameson Land, East Greenland [Mathiesen et al., 2000] (Fig. 1). As pointed out by Hole and Natland [2019], the most important control on the distribution of magmatism during the breakup of the North Atlantic apparently was local extensional tectonism resulting from plate boundary forces.
Seaward dipping reflections (SDRs) at the continent-ocean boundary represent subaerial to shallow marine lava flows, which were emplaced during the final rifting stage [Eldholm, 1991; Hinz et al., 1987]. Typically, they have a concave-down wedge geometry, resulting from sequential loading and subsidence of older flows [e.g. Hinz et al., 1987; Horni et al., 2017], and/or from crustal-scale faulting [e.g. Becker et al., 2016; Geoffroy et al., 2015]. On several volcanic rifted margins there are two distinct sets of SDRs: an inner, landward SDR unit and a second, outer SDR unit [Planke et al., 2000]. An outer high, which is repeatedly found in between, is interpreted to represent a transition from a subaerial to subaqueous environment, and the outer SDRs as transition from shallow to deep water [Planke et al., 2000]. However, several authors propose that the outer SDRs do not simply reflect the deposition in successively deeper water but may represent tholeiitic basalt, underlain by a mid-crustal imbricate layer comprising gabbro, and a lower crustal mobile layer comprising mafic and ultramafic rocks within a magmatic crust [Elliott and Parson, 2008; Paton et al., 2017; Quirk et al., 2014]. Alternatively, magmatically overprinted remnants of continental crust have been suggested [Geoffroy et al., 2015; Guan et al., 2019].
1.3 Later Cenozoic Rifting and Magmatism in NE Greenland
In contrast to the Norwegian margin, onshore northern East Greenland was affected by a subsequent alkaline magmatic episode from 37–35 Ma, possibly in association with the northward propagating rift that finally separated the Jan Mayen microcontinent from East Greenland [Price et al., 1997; Tegner et al., 2008; Schiffer et al., 2018].Parsons et al. [2017]
confirm the observation of Price et al. [1997] that faulting affected the Traill Ø region (Fig.
1) after the emplacement of tholeiitic magmatic intrusions at ca. 54 Ma and before and after the emplacement of alkaline magmatic intrusions at ca. 37–35 Ma. Several planar normal
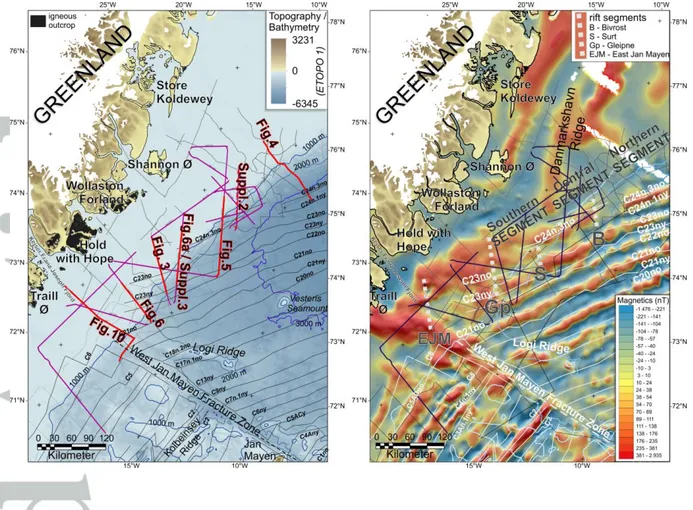
faults displace Cenozoic basaltic intrusions over an along-strike length of >350 km and over an across-strike width of >100 km [Price et al., 1997]. The stretching direction in the onshore area was approximately E–W, orthogonal to the strike of major faults in the region, which are mostly reactivated Mesozoic structures. Trending east at an oblique angle to the West Jan Mayen Fracture Zone there is a prominent, about 150 km-long ridge (Logi Ridge) that is interpreted as an igneous complex [Olesen et al., 2007]. It sticks out from the magnetic seafloor anomalies (magnetic chrons C20-C13; see Fig. 2), and thus appears to be younger than the underlying middle Eocene to early Oligocene seafloor [Tan et al., 2018]. The landward extension of Logi Ridge points to Traill Ø in East Greenland, where magmatic rocks with an emplacement age of 36 Ma are found [Price et al., 1997].
2 Data Acquisition, Processing and Interpretational approach
2.1 Multichannel Reflection Seismic (MCS) Data
In September 2017, we acquired 2180 line-km multichannel seismic data during cruise MSM67 with the German research vessel Maria S. Merian. The acquisition was done using BGR’s reflection seismic instrumentation with a 4500 m-long digital streamer (360 channels) at a sample rate of 2 ms and a record length of 14 s. We operated the streamer at a controlled depth of 12 m and recorded both the vertical position and the feathering. The software package Spectra (ION Concept Systems) was used to control the seismic data acquisition including the handling of the navigation data. The seismic source was an airgun array with 16 G-guns subdivided into two gun strings with eight guns each. The airguns were towed at 6 m depth and had a total volume of 3100 in³ (51 liters). Source positions were at pre-calculated regular 50 m distance. Research vessel Maria S. Merian’s three compressors provided the working pressure of 2172 psi (150 bar). Impact on the marine fauna was kept to a minimum following the strict regulations that were monitored by two dedicated marine mammal observers, and supported by the scientific crew.
Seismic data processing was performed using ProMAX/Seisspace 5000.8.1 software.
Prestack processing included trace editing, filtering and a signal deconvolution followed by surface-related multiple suppression, and tau-p deconvolution. RMS velocities were determined at regular 3 km intervals. A prestack Kirchhoff time migration was performed on
common-offset gathers, followed by a mute in the radon domain. Before exporting to the interpretation system, spatial filtering, fx-deconvolution and a weighted trace mixing were applied to the stacked sections. Interpretation was performed on an IESX interpretation system. In the following, the data are presented in the time domain, i.e. the vertical axis is in two-way traveltime (TWT).
Simultaneously, while acquiring the seismic data, the hull mounted deep- and shallow-water multibeam echosounders (EM1202/EM712) recorded their specific data.
Additionally, the multichannel seismic reflection, gravimetry, and gradient magnetometry data are supplemented by commercial seismic data (KANUMAS, GGU) (Fig. 2).
2.2 Interpretational Approach
The lack of any deep wells on the Northeast Greenland shelf results in many uncertainties regarding the age and depositional environment of the sedimentary succession.
This study focusses on the continental slope and rift-related structures, thus, we concentrate on two main reflectors that are interpreted throughout the available data: an intra-Miocene (IMU) and a near top-Paleogene (tP) reflector (Fig. 3). The main aim in interpreting these horizons is to get timing constraints.
The distinct intra-Miocene angular unconformity (IMU) is present in most of the NE Greenland shelf and a marks the transition from a mainly aggrading sequence and overlying, eastward progradational wedges [Berger and Jokat, 2008; Døssing et al., 2016] (see Fig. 3).
From correlation with Ocean Drilling Program (ODP)-site 909, Berger and Jokat [2008]
suggest that the IMU represents a regional middle Miocene (~15 Ma) unconformity.
According to Døssing et al. [2016], reanalysis of the ODP-site 913 borehole data suggests a somewhat later middle to late Miocene (~15-10 Ma) age of the IMU. For the purpose of this study, this difference is not crucial. A near top Paleogene reflector (tP) can be cross- correlated from the detailed study of Petersen et al. [2015] in the northern part of our study area. This horizon has also been checked for consistence with other interpretations [Berger and Jokat, 2008; Døssing et al., 2016; Hamann et al., 2005; Tsikalas et al., 2005]. We confirm Petersen et al. [2015] that the tP surface is a prominent downlap surface throughout the eastern NE Greenland shelf. tP forms the top of a mainly parallel layered and moderately reflective successions with continuous reflections. On the shelf it locally forms an erosional surface as indicated by top-lap truncations below (Fig. 3).
The volcanic successions are interpreted primarily on the basis of their top reflection.
Within the volcanic sequence, seismic facies units are mapped, bounded by unconformities or correlative conformities. In the shelf area, the lava flow units widely mask possible deeper deposits. Thus, the top of the volcanic successions often constitutes the acoustic basement.
This volcanic basement is typically a prominent, low-frequency reflector, or reflector package. We interpret the internal structure of the volcanic sequences according to the concept of volcanostratigraphy in line with Abdelmalak et al. [2016a], Berndt et al. [2001a], and Planke et al. [2000].
2.3 Potential Field Data
The marine geomagnetic data acquisition was carried out with a towed Overhauser longitudinal gradiometer and a 3-component Magson fluxgate sensor. The magnetic anomalies were calculated from the total field gradient and are free from time dependent magnetic variations which have large amplitudes at high latitudes. For quality control, the residual magnetic variations were compared to those of the magnetic stations Jan Mayen (JAN), Summit (SUM), and Danmarkshavn (DMH). Since magnetic variations vary significantly over short distances at high latitudes, the residuals do not match any of the stations perfectly but show distinct similarities with the station recordings. Hence we are confident to have achieved high quality magnetic data free from major time dependent magnetic variation effects. Gravity data were acquired with a vessel mounted KSS31M sea gravimeter. Ties to land stations were done in Reykjavik (Iceland) and Longyearbyen (Spitsbergen). 2D potential field forward modelling has been carried out in order to constrain the seismic interpretations and in particular to assess the distribution and thickness of break- up related magmatic crustal thickening. The potential field modelling was performed using ship-borne gravity and magnetic data with the GM-SYS software (Northwest Geophysical Associates, Inc.). GM-SYS computes the magnetic and gravity response from irregular polygons with variable properties (density, magnetic susceptibility and remanence) [after Talwani and Heirtzler, 1964; Talwani et al., 1959]. The software provides several options to
adjust the 2D-gravimetric and magnetic model interactively. The gravity and magnetic fields of the resulting forward model can be compared to the observed gravity and magnetic data.
3 Interpretation and Results
In the following, we present an interpretation of the SDRs along the northern East Greenland margin. The structural configuration of the SDRs and their relationship to magnetic anomalies are used to conclude about the emplacement time and thus about the evolution of the final rifting stage. Volcanism in the vicinity of the West Jan Mayen Fracture Zone is shown to differ from the SDRs stage and is suggested to originate from a late Oligocene/early Miocene magmatic phase.
3.1 SDRs
In the northern part of the margin, close to the Greenland Fracture Zone (Fig. 1) relatively small SDR wedges occur almost entirely landward of magnetic lineation C24n3n (54.0 – 53.4 Ma; see Table 1). This confirms the earlier findings of Hinz et al. [1987].
Southwards, the volcanic wedges broaden, merge with chron C24n (54.0 – 52.6 Ma) and develop into two along-strike separated wedges. Thereby, the outer SDR is associated with chron C23 (51.8 – 50.6 Ma). From the overall SDRs distribution, we consider it likely that the structure of the volcanic flow units reflects the architecture of segmented rift sectors. As pointed out by Peron-Pinvidic and Osmundsen [2018], the question of a lateral segmentation of a rift system is not easy to answer. However, both, the Jan Mayen Fracture Zone, bounding the Møre to the Vøring segment, and the structural boundary on the northeastern flank of the Vøring Plateau (Bivrost transfer zone), bounding the Vøring to the Lofoten-Vesteralen segment are first order transfers systems that are distinct in various datasets [Mjelde et al., 2005; Tsikalas et al., 2005]. It has been questioned if there is an outboard oceanic fracture zone at the position of the Bivrost transfer [Olesen et al., 2007] but lineaments in the continental basement are expected to be conjugate features. In the following, we discuss the SDRs at the northern East Greenland margin in three segments according to their characteristic volcanic configuration (Fig. 2).
3.1.1 SDRs in the Northern Margin Segment (~75°N - 76°N)
There are no distinct SDRs imaged in our seismic data north of 76°N. However, the basement reflection pattern suggests the presence of volcanic rocks overlying basement or
pre-rift strata. The first clear evidence for narrow SDRs is found at the continental slope at approximately 75.8°N. This SDR wedge broadens southward up to 40 km at 75.2°N, where it is subdivided into two wedges. The individual wedges may be bounded by landward dipping faults (Fig. 4), as proposed in the general concept by Geoffroy et al. [2015]. The SDRs correspond widely to a negative magnetic polarization (Fig. 2, 3) and are clearly located landward of magnetic chron C24n.3n (C24B; cf. Table 1; Fig. 4), as interpreted by Skogseid et al. [2002] and Gaina et al. [2017]. In this northern segment, the SDRs terminate landward against the Greenland (or Thetis) escarpment [Abdelmalak et al., 2016a; Hinz et al., 1987], which is similar to the Vøring escarpment but facing to the west. The Greenland escarpment exists where the landward flows sensu Planke et al. [2000] terminate landward in a lava delta (e.g. Fig. 4). The Vøring escarpment is a 350 km NE-SW trending feature along the entire Vøring margin [Abdelmalak et al., 2016a]. For the Vøring escarpment, Abdelmalak et al.
[2016a] show that such major volcanic escarpments are indicative for lava flows encroaching into basins, and thus for the palaeo-shoreline. By assuming a velocity of 4 km/s for the flows in offshore Greenland, the about 100 to 200 ms thick lava flows are 200 to 400 m thick. The top reflection of the landward flows contrasts with the smooth top of the SDR reflection and is hummocky and irregular. This is different from the Vøring margin and may indicate shallow water flows in a coastal setting (Fig. 4).
In contrast to the elongated Vøring escarpment, the here interpreted Greenland escarpment is only about 100 km long. At the seaward end of the SDRs, the top reflector changes from being laterally continuous and sub-planar to a more chaotic, hummocky top reflection pattern (Fig. 4). This may indicate the transition into submarine emplacement conditions of the SDRs.
Interestingly, SDRs in this northern margin segment are not only dipping seawards but also towards the South. Further seaward, the top of the oceanic crust dips seawards (Fig.
3). This may be an indication that the margin is not yet in thermal equilibrium or that a secondary uplift of the shelf modified the expected subsidence pattern in this segment.
However, we consider it also possible that the oceanic crust thins seaward, which is expected to result in a dipping basement.
3.1.2 SDRs in the Central Margin Segment (74°N - 75°N)
The boundary between the northern and the central segment is located at approximately 75ºN and separates multiple SDRs in the southern part of the northern margin
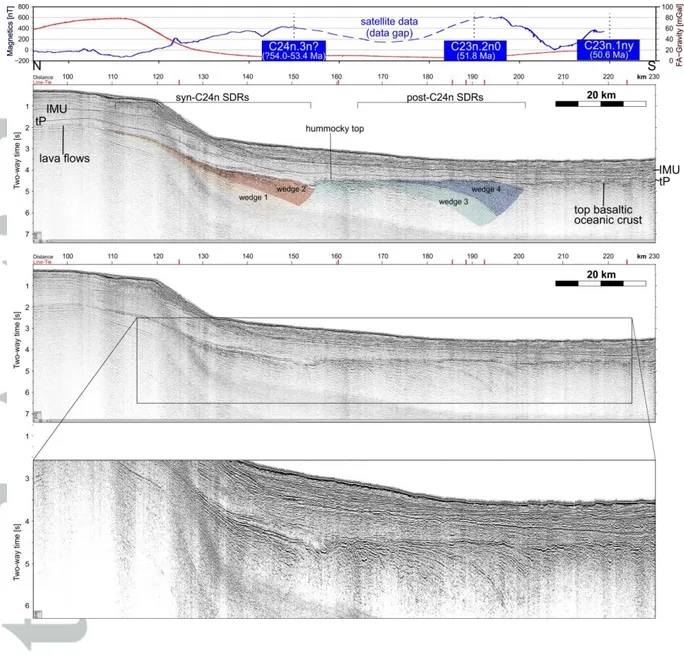
segment from single SDR wedge in the northern central margin segment (Supplement 2). The structural discontinuity was noted by Tsikalas et al. [2005], who proposed a transfer system in this part of the margin. These authors correlated this transfer system with the Bivrost lineament on the conjugate Norwegian margin. The segment boundary coincides with the southward interruption of the magnetic anomaly C24n.1n (C24A, Fig. 2). In line with Geissler et al. [2016] and Abdelmalak et al. [2016a], we interpret the distinct landward seaward dipping reflector wedges as inner SDRs, since they have all the characteristics that define a SDR package, including long, low-frequency continuous reflections with an arcuate shape and a well-defined diverging internal reflection pattern (Fig. 5). The smooth, strong, and continuous low-frequency top reflection merges landward with the acoustic basement, as expected for SDRs. The SDR wedge can easily be correlated across several seismic lines and its width lies within the range of observations at other margins (15-50 km) [Planke et al., 2000]. Because of its typical characteristics and its location, we interpret this SDR wedge as a succession of major subaerial flood basalt flows. In analogy to the volcanic assemblages drilled at ODP Site 642 [Planke, 1994] it is quite possible that the succession also includes sediments of volcanic provenance such as clays derived from basalt weathering or reworked volcanoclastic sediments, but in our view they would be genetically related to break-up volcanism rather than clastic syn-rift basin infill [Quirk et al., 2014]. In the central margin segment, both the landward and the seaward SDRs coincide with magnetic highs. The landward magnetic high has previously been interpreted as seafloor spreading anomaly C24n3n, the seaward as C23n [e.g. Skogseid et al., 2000; Gaina et al., 2009] (see Fig. 5). Our data corroborate the findings of Geissler et al. [2016] who observed an ‘outer low’ in between the inner and outer SDRs. This `outer low` is characterized by rubbly basement and is about 10-30 km wide. From the reflection pattern, sill intrusions and local lava flows are interpreted within the deepest sedimentary successions above the outer low (Fig. 5; distance 150-160). This means that there was a pause in volcanism during the deposition of the sedimentary succession before the seaward volcanic successions were emplaced.
3.1.3 The Southern Margin Segment (73°N - 74°N)
In the southern segment, a single, small SDR wedge is imaged that further decreases in size southwards (cf. Figs. 6, Suppl. 3). In the northern portion of the segment, the SDRs are located distinctly landward of magnetic anomaly C22 and coincide largely with a negative magnetic anomaly, which has been assigned an age corresponding to anomaly C23r
[e.g. Skogseid et al., 2000; Gaina et al., 2009]. The local positive magnetic pattern in prolongation of magnetic anomaly C23 coincides with a large-scale volcanic cone in the data (Fig. 3, Suppl. 3). The hummocky, high amplitude top reflections and the chaotic internal reflection pattern match the seismic characteristics of volcanic deposits at the transition from subaerial to shallow water emplacement [Abdelmalak et al., 2016a; Planke et al., 2000]. We thus consider it likely that these mounds with1 s (TWT) elevation consist of hyaloclastic sediments that were deposited in a shallow marine environment. However, it is unclear at what time the volcanic cone developed. As shown in Figure 6A, the cone has a different magnetization than the SDR wedge. Moreover, from the reflection characteristics there are sedimentary successions in between the base of the cone and the underlying top SDR reflection. Sedimentary successions in between the SDRs and the volcanic cones imply a different origin and a development of the volcanic cones later than the SDRs. This is discussed in detail in chapter 3.2.
It is still questionable if SDRs are present in the southern part of the southern margin segment. It might be that portions of the SDRs are masked by younger basalt flows and cones. However, where observable (e.g. Fig. 6B) low-frequency reflections close to the basement level may be interpreted as lava flows, but they are neither wedge-shaped nor arcuate. The southern limit of distinct SDRs in the southern segment coincides roughly with the Surt Lineament of Tsikalas et al. [2005] that is located at the continental slope, in prolongation of the Danmarkshavn Ridge (Fig. 2) [Hamann et al., 2005]. It also coincides with transfer zone “A”, identified in the onshore Greenland rift system [Rotevatn et al. 2018].
This lineament forms the northern boundary of widespread seamounts on the early oceanic crust (Fig. 9).
The eastern side of the Jan Mayen microcontinent, conjugate to the Møre margin, is interpreted as a volcanic rifted margin, hosting SDRs [Breivik et al., 2012; Gernigon et al., 2015; Peron-Pinvidic et al., 2012; Gudlaugsson et al., 1988; Planke and Alvestad, 1999].
This means that the SDRs were more or less continuous along the East Greenland margin before the Oligocene separation of this microcontinent. A gap in the SDRs in NE Greenland, around the West Jan Mayen Fracture Zone, is therefore striking. However, a similar observation has been made for the transition from the Vøring margin to the Møre margin at which there is no evidence for substantial magmatic crustal thickening [Berndt et al., 2001b].
In addition, the relatively magma-starved development of this segment had an influence on
the post-breakup evolution of the oceanic domain [Gernigon et al., 2012]. We interpret this to be due to the fracture zone itself, which juxtaposes the cold interior of the rifted sedimentary basin south of the fracture zone to the new oceanic crust in the north. This would lead to lateral heat transport from the north to the south and cooling of the upper mantle and subdued volcanism compared to the adjacent rifted margin segments. In addition, inheritance from old and pre-existing lower-crustal/upper mantle orogenic fabrics in connection to a Caledonian and Precambrian basement shear between the Møre and Vøring margins [Doré et al., 1999]
may have played a role.
3.2 Multiphase Development of SDRs
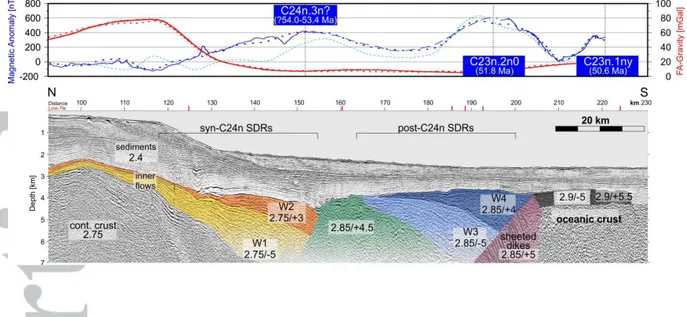
Forward modeling shows that the observed total-field magnetic anomalies at continental slopes can be created by the SDRs without the presence of steady-state oceanic crust [e.g. Davis et al., 2018; Koopmann et al., 2016]. To examine this for the northern East Greenland margin, potential field modelling was performed along a depth migrated seismic profile with prominent SDRs (Fig. 7, shown in the time domain in Fig. 5). The modelling is based on the structural crustal configuration based on the seismic interpretation and complemented by published data for the deeper crust. In our model, the sediments are up to
~2 km thick across the shelf and thin southwards to ~1 km in the oceanic domain (Fig. 7).
Since the volcanic flow units mask possible deeper pre-volcanic deposits, the defined top of the acoustic basement coincides in wide parts of the profile with the top of the lava sequence.
The depth to the acoustic basement increases from 2.5 km in the continental domain to 3.5 km in the oceanic domain. We adopt the geometry of the Moho from a published regional crustal model derived from refraction data [Funck et al., 2016; Voss et al., 2009]. The extracted Moho shoals from 22 km depth beneath the shelf to 10 km in the oceanic domain.
The absence of short-wavelength anomalies within the observed gravity and magnetic data implies a rather homogeneous sedimentary column. Therefore, we model the latter as one uniform non-magnetic layer with constant density (2.4 g/cm³). The crystalline basement is laterally subdivided into continental crust below the shelf (2.75 g/cm³), magmatically overprinted crust (2.85 g/cm³) and oceanic crust (2.9 g/cm³) southeast of the outer SDR sequence following average velocities and gravity modelling from refraction profiles for the same area [Voss et al., 2009]. The lithospheric mantle is divided into a continental (3.3 g/cm³) and an oceanic domain (3.25 g/cm³) following Voss et al. [2009]. The measured total magnetic field exhibits largest anomalies of up to 600 nT across the SDR sequences (Fig. 7).
The range of the modelled magnetic remanence corresponds to measured volcanic sequences from ODP-Leg 104, hole 642E at the Vøring margin, conjugate to the NE Greenland margin.
This well penetrates an 800 m thick volcanic sequence at the transition between the inner SDRs and the landward flows with an average remanence of ~5 A/m exceeding locally even 10 A/m [Schreckenberger, 1997]. The upper volcanic sequence with a thickness of ~750 m reveals a reversed magnetic polarity at Hole 642E and is correlated within magnetic polarity chron C24r (57 to 54 Ma) [Abdelmalak et al., 2016b]. This volcanic sequence corresponds to the deep package of the inner SDR. In contrast, the underlying lower volcanic series shows a normal polarity and may correlate with Chron C25n (57.01 to 57.6 Ma), although interlayered sediments suggest that their deposition postdates the Paleocene–Eocene thermal maximum (PETM) (~56 Ma). Our forward modelling shows that the observed magnetic anomalies can be explained by the magnetization of the SDRs and associated sheeted dike swarms.
However, a reasonable fit is archived only if the landward SDR sequence is modelled as two wedges with reversed earth’s magnetic field (Fig. 7; dotted light blue line). In agreement with the modelling results of Schreckenberger [1997] we subdivide the inner SDRs into an upper and a lower wedge with reversed polarization. Additionally, the ODP-hole 642E shows an underlying earlier volcanic phase which has not been modeled due to the low remanence [Schreckenberger, 1997]. However, offshore NE Greenland, corresponding volcanic flows may explain some subparallel seismic reflections underlying the landward SDR (Fig. 7).
Similar to the NE Greenland margin, the main, and undrilled inner SDRs wedge at the Vøring margin is associated with a prominent positive magnetic signature [e.g. Berndt et al., 2001a]. According to Gernigon et al. [2019], this indicates a normal polarity remnant magnetization for the uppermost part of the inner SDRs not sampled by the ODP-site 642 well. The landward SDRs in Figure 7 terminate at chaotic basement reflections in the southeast. The reflection characteristics resemble an outer high pattern that forms an atypically major depression. The magnetic signature indicates that this basement block may represent progressively intruded continental crust and separates the landward and the seaward SDR sequences. Similar to the landward SDRs, also the seaward SDRs are divided in a deeper package characterized by a reversed magnetic polarity and a shallower package with normal magnetic polarity (Fig. 7). This is a non-unique solution but is consistent across the margin and supports the structural configuration interpreted in the reflection seismic data (Fig. 5). Seaward, steeply dipping reflections may indicate a sheeted dike swarm. Further
seaward, seismic interpretation and potential field modelling both indicate typical oceanic crust.
If indeed the magnetic anomalies at the NE Greenland margin originate from the SDRs, the magnetic pattern can be used to deduce the relative timing of the emplacement of the volcanic wedges. The inner SDRs in the northern study area (75°N-75.8°N) are generally landward of magnetic lineation C24n.3n. The associated negative magnetic anomaly may correspond to chron C24r. This relative structural position indicates that the SDRs in the northern margin segment were emplaced before volcanic rifting took place in the central and southern margin segment.
Subsequently the SDRs in the central margin segment (74°N-75°N) were emplaced (Fig. 9). This may have started during the negative polarity chron C24r although the main portion of the SDRs is associated with a positive magnetic signature that is found in prolongation of magnetic chron C24n. The deposition of a separate seaward SDR wedge may even have lasted until chron C23n. The distinctively different magnetic anomalies associated with the two SDR wedges are taken as indication for a prolonged phase or multiple phases of volcanism resulting in the formation of two wedges. Finally, the small SDR wedge in the southern segment was emplaced. The SDRs are located landward of magnetic anomaly C22 and coincide generally with a negative anomaly, which has previously been identified as chron C23r [Gaina et al., 2017].
Multiple phases of volcanism are also indicated by the structural configuration. In the northern portion of the central margin segment, at about 75°N, the landward SDRs wedges are overlain by an up to 0.5 s (TWT) thick, wedge-shaped sedimentary depocenter (Fig. 8A).
Interestingly, the horizon that is draping the depocenter can be traced confidently along a strike line to the top Greenland escarpment (Fig. 8A; cf. Fig. 4). The low-amplitude reflections in the wedge-shaped structure (Fig. 8A distance 35-65 km) are in marked contrast to the inferred volcanics. From the low amplitudes and the internal reflection pattern, we are confident that they represent sediments that were deposited after the emplacement of the SDRs. This interpretation is further supported by the termination of the reflector package against an escarpment at the northern dip line (Fig. 8A distance 100 km). The structural relationship indicates that the top of the southern SDRs corresponds to the base of the northern SDRs, and thus reveals a time-progressive development.
This structural configuration indicates a stepwise development of the SDRs along- strike the margin rather than solely a transition from subaerial (landward flows) to subaqueous deposition (lava delta and inner flows) [e.g. Abdelmalak et al., 2016a]. As shown in the composite seismic lines in Figure 8A, the deposition of the southern SDRs was completed at the onset of the emplacement of the northern SDRs and the southern landward flows are an equivalent to the northern inner flows (using the definition of Planke et al.
[2000]). This shows that within the central margin segment, the SDRs at a latitude of 75- 75.2°N have been emplaced before those at 75.5°N. Alternatively, an earlier flow unit may be buried below the SDRs at 75.5°N; in this case the volcanism would have lasted a longer time in the north. Thus, even within a single margin segment, there was no continuous, elongated magmatic rift but several individual volcanic centers, resulting in the emplacement of SDRs.
In the southern portion of the northern margin segment, the direction of consecutive emplacement was from south to north, in the opposite direction of the general north to south emplacement of the breakup-related volcanics at the NE Greenland margin.
Another example for consecutive SDRs emplacement is found at the boundary between the southern and the central margin segments (Fig. 8B). Again, the top-reflection in prolongation of the top escarpment along line BGR17-212 merges with the base of the SDRs farther south along line BGR17-216. Thus, the SDRs in the central margin segment developed before the southern SDRs. Similarly, the inner volcanic flow units are emplaced in consecutive phases. The earlier phase coincides with the SDRs emplacement, the younger phase affects more the hinterland towards Shannon Ø. At least 250 ms (TWT) of sediments have been emplaced in between the two phases. We interpret the seaward lavas as landward flows (following the nomenclature of Planke et al. [2000]) and the landward lavas as lava flows emerging from the hinterland. In a similar manner, lava flow units in the oceanic domain reveal downlap configurations onto the SDR sequences (Suppl. 2). The landward flows are becoming progressively younger towards the south and downlap onto the acoustic basement (Fig. 6A).
3.3 Volcanism around the West Jan Mayen Fracture Zone
Existing wide-angle reflection/refraction data reveal the deep structure of the crust and the amount of magmatic underplating/intrusions during the rifting and seafloor-spreading phase [e.g. Voss et al., 2009]. The greatest amount of high-velocity lower crust was identified around the intersection of the West Jan Mayen Fracture Zone with the shelf [Voss et al.,
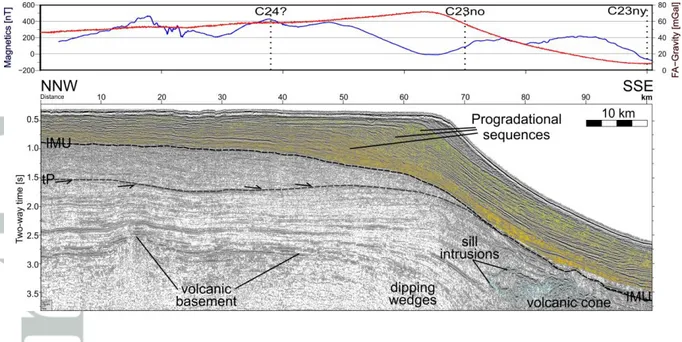
2009]. However, it is unclear if all mafic material is breakup-related and was assembled at the Paleocene-Eocene transition (c. 54 Ma) and e.g. Scott [2000] suggest that more magmatic material was emplaced during the separation of the Jan Mayen microcontinent from East Greenland in Oligocene/Miocene times. Relatively young volcanics, identified in the seismic data, support this view. Figure 10 shows a large volcanic structure below the shelf break. It stretches for about 35 km across the margin and is on average 0.5 s [TWT] thick (please note that the composite line in Fig. 10 is not straight). With an average velocity of 4.0 km/s this structure covers an area of ~35 km2 along the 2-D section. By assuming that the volcanic structure is continuous for about 80 km, as can be inferred from the magnetic data (Fig. 2), the volume would be 2.800 km3. The volcanic basement reflection in Figure 10 can confidently be followed from the NW to the SE, where it bends down beneath the volcanic structure. This leaves a distinct gap between the volcanics and the basement with well stratified and low amplitude reflections. We thus interpret a sedimentary succession in between the volcanics and the distinct acoustic basement, which is about 0.75 s (TWT) thick.
This indicates a distinct time lag between the formation of the two structures. The top of the acoustic basement, however is continuous along the northern East Greenland margin, and in the margin segments further north it is clearly related to the breakup of the Greenland Sea at 54 Ma. The top of the volcanic cone in Figure 10 corresponds to the near top Paleogene reflector (tP) that was traced from the northern study area. Certainly, the emplacement of the volcanics took place before the IMU (Mid-Late Miocene) horizon formed (Fig. 10). This indicates a magmatic phase associated with the progressive breakup of the Jan Mayen microcontinent and the evolution from the East to the West Jan Mayen Fracture Zone.
Portions of the strong reflections in the seismic data close to the shelf break farther north, up to about 73.4°N may also relate to this late-stage magmatism (see e.g. Figs. 3, 6a, Suppl. 3). A number of volcanic cones or seamounts formed mainly on early oceanic crust (Fig. 9) and are therefore younger than 54 Ma and may belong to this volcanic phase as well.
The oceanic crust in this area exhibits extensional deformation (e.g. Suppl. 3) that may have provided migration pathways for the magmas.
4. Discussion
In the following, we place the polyphase tectono-magmatic evolution of the northern East Greenland continental slope into a regional context, discuss our preferred COT location and examine the final rifting and breakup stage.
4.1 Phases of Volcanism and Tectonism
We can confirm the findings of Geissler at al. [2016] that there was not a continuous magmatically active zone along the break-up line of the NE Greenland margin. Instead, individual rift/magmatic centers can be inferred from the timing relationship of the SDRs and the varying SDR volumes. This is similar to the Vøring margin, where volumes of the Paleocene to early Eocene volcanism decrease from the central Vøring margin towards the south and north, respectively [Berndt et al., 2001a], indicating melt supplies from a relatively confined magmatic source [Hansen et al., 2009]. In our study area offshore NE Greenland, there is equally a decrease towards the south and north, respectively, in magma volume manifest in the SDRs (Fig. 9).
The SDRs in the northern segment were the first that have been emplaced, as indicated by the structural position of the SDRs relative to magnetic chron C24n and the associated negative magnetic signal. The landward SDRs in the central margin segment at 74.5°N to 75°N did follow (Fig. 9). The landward flows and lower series may have been emplaced during the same negative magnetic chron, likely C24r but the main SDR wedges in the central segment are associated with a prominent positive magnetic signal. Subsequently, the seaward SDRs in the central segment were emplaced during another change in magnetic polarization, likely chron C23. Both, the structural position of the SDRs relative to each other at the transition from the central to the southern segment (Fig. 8b) and the structural position relative to the magnetic chrons indicate that SDRs in the southern margin segment were the last to be emplaced. These southern SDRs tend to correlate with a weak relative negative magnetic anomaly. They likely correspond to a post-C24 chron as indicated by extrapolation of the seafloor spreading anomalies in the oceanic domain. Judging from the spatial relationship of the SDRs with the magnetic chrons, we estimate a duration of the magmatism of about 2-4 Ma (pre-C24n to C23n). Within this period, the SDRs have been emplaced from north to south along the northern East Greenland margin.
In addition, the data reveal a post-middle Eocene magmatic phase in the vicinity of the West Jan Mayen Fracture Zone (Figs. 9, 10). Seismic stratigraphy (top-Paleogene and IMU reflectors) indicates an emplacement age roughly around the late Oligocene, which indicates a relationship to the progressive breakup of the Jan Mayen microcontinent.
Additional evidence for a late Paleogene/early Miocene magmatic phase is the narrow Logi Ridge, which trends obliquely to the West Jan Mayen Fracture Zone (Fig. 9). Olesen et al.
[2007] associated this igneous complex with magmatism at the time of chron C22 (49–50 Ma). However, the ridge overprints the magnetic seafloor anomalies and thus appears to be younger than the Eocene/E. Oligocene seafloor it lies on [Tan et al., 2018]. The formation thus may have been contemporaneous with the latest Eocene magmatism, at ~36 Ma in Traill Ø, East Greenland [Price et al., 1997]. The discovery of Oligocene alkaline magmatism on the Jan Mayen microcontinent, which was then still attached to the NE Greenland margin demonstrates protracted alkaline magmatism in the region over more than 30 Ma [Kandilarov et al., 2012]. Rather than focusing only at the landward extension of the West Jan Mayen Fracture Zone, we consider it possible that post-middle Eocene magmatism reached up to 100 km farther north and may explain also the volcanic complexes seaward of the SDRs in the southern margin segment (e.g. Figs. 3, 6). Similar to the configuration near the West Jan Mayen Fracture Zone (Fig. 10), a sedimentary unit may be inferred in between the basement and the volcanic successions. An estimated minimum offshore extent for this post-middle Eocene magmatic phase is shown in Figure 9. This magmatism likely took place during the progressive separation of the Jan Mayen microcontinent. In this time interval, the movement along the East Jan Mayen Fracture Zone was overtaken by the West Jan Mayen Fracture Zone. When reconstructed, both fracture zones show a distinctively different trend (NW-SE versus E-W; see Fig. 9). The initially active East Jan Mayen Fracture Zone, a broad, lithosphere-scale zone consisting of three distinct segments, strikes almost perpendicular to the seafloor spreading anomalies. A change in plate motion at 49.7 Ma (magnetic chron C22) is observed in the southern portions of the North Atlantic, but not in the Greenland Sea [Gaina et al., 2009]. Intraplate deformation may thus be expected in the latter area. We suggest that the distribution of magmatism, observed around and to the north of the landward extension of the West Jan Mayen Fracture Zone, is explained by transtensional deformation of the northern East Greenland shelf during the anticlockwise migration of the East to the West Jan Mayen Fracture Zone. In this model, transtensional deformation opened up fractures for melt migration, enhanced by the formation of a leaky transform [Gernigon et al.,
2009]. Typically, transforms are regions of anomalously cold, thick lithosphere. However, if brittle weakening of the lithosphere along a fracture zone is considered, higher temperatures near the center of the transform faults may be expected that would enhance melting and promote the migration of off-axis melts into the transform zone, further weakening the plate boundary [Behn et al., 2007]. Thus, variations in the seafloor spreading direction, which generated extension across the Jan Mayen Fracture Zone, may have resulted in phases of additional melting around the transform.
4.2 The Continent-Ocean Transition (COT)
A key issue related to rifted continental margins is the structure and architecture of the COT, which is still not fully understood. Debate continues over the nature and origin of so- called “transitional crust”, whether there is a COT or a continent-ocean boundary (COB), and whether this boundary has lithosphere-scale or crustal-scale [e.g. Mjelde et al., 2007; Peron- Pinvidic et al., 2013]. Typically, a COT is determined by identifying the landward limit of oceanic crust and the seaward limit of continental crust. If both estimates match in position a boundary between continental and oceanic crust can be inferred (COB), if there is an area left between the landward limit of oceanic crust and the seaward limit of continental crust, typically a transitional area between continental and oceanic crust (COT) is defined. The seaward termination of the COT is generally interpreted from the location of the oldest oceanic magnetic anomaly, whereas the landward extent is related to the seaward termination of clearly identifiable rotated continental fault blocks [e.g. Mjelde et al., 2005]. At volcanic rifted margins, however, SDR wedges and associated volcanic flow units can produce magnetic anomalies that mimic seafloor spreading anomalies [Davis et al., 2018; Koopmann et al., 2016], hindering a proper identification of oceanic crust. Offshore NE Greenland this resulted in a COB/COT that differs considerably between a proposed landward position, close to the shoreline [e.g. Barnett-Moore et al., 2016; Le Breton et al., 2012; Scott, 2000]
and a proposed seaward location, close to the shelf break [e.g. Hopper et al., 2014], or in between [Tsikalas et al., 2005]. The NE Greenland shelf area thus has been either interpreted as being underlain by overthickened oceanic crust or by magmatically overprinted continental crust.
In favor of interpreting the shelf as being made up of oceanic crust may be the magnetic pattern (Fig. 2). However, this contribution shows that, the observed magnetic
anomalies landward of the shelf break resemble those of SDRs rather than seafloor spreading anomalies (see section 3.1). Fitting these landward sections with a forward model of oceanic crust containing anomalies C23 and C24 is not impossible, but would require significantly higher spreading rates and higher magnetizations than in the adjacent oceanic crust of the oceanic Greenland Sea. A more convincing interpretation is that lava flows which now form the outer and inner SDR wedges were emplaced during chrons 23 and 24, resp., and therefore carry the remanent magnetization of these chrons (Fig. 7). This creates a magnetic anomaly pattern which looks similar to seafloor spreading anomalies (Fig. 2) but is, upon closer examination, different in the sense that these anomalies are less 2D in their character, have higher amplitudes corresponding to the thickness of their source bodies, and are wider than would be expected if they were true seafloor spreading in origin.
It is widely accepted that at least the inner portions of the SDRs are deposited onto or through continental crust [e.g. Eldholm et al., 1987]. Scientific drilling in the North Atlantic provide evidence that the magma of the inner SDRs incorporated material from the continental lithosphere [Eldholm et al., 1987; Saunders et al., 1998; Meyer et al., 2009]. With this study, we present an interpretation of SDRs below the shelf break from 73°N to 75.8°N.
The presence of SDRs is in our view an important argument to interpret the COT at the continental slope, within the (landward) SDR sequences. Such an interpretation is in line with models derived from refraction seismics [Voss et al., 2009], which show that the crust is relatively thick in the shelf area and does not display velocities that are compatible with typical oceanic crust. The shelf in the study area is therefore interpreted as being underlain by continental crust, which has been magmatically overprinted to variable degrees.
4.3 The Rift to Drift Transition
The question how a continental rift develops into a seafloor spreading system with the formation of a new ocean is among the most difficult ones to answer. Uncertainties remain about how a continental spreading center first ruptures the surface and how this rupture evolves over time. Possibilities for this process include rift/spreading propagation, instantaneous breakup of long sections and punctual cells of seafloor spreading. In the following, we discuss key findings from the northern East Greenland margin with respect to this process.
The distribution of the SDRs along the northern East Greenland shelf indicates that the final rifting stage with the emplacement of the SDR wedges took likely place in confined areas with no clear propagation direction. The rift itself was certainly elevated above sea level because the SDR reveal the typical structure and smooth surface of the long (>20 km) flow units. However, both, the presence of an escarpment and the hummocky surface close to the landward termination of the SDRs in the northern margin segment indicate a transition into shallow water away from the rift. Similarly, data from the conjugate Vøring margin reveal lava delta fronts and a major volcanic escarpment that are typically interpreted as an indication for the palaeo-shoreline. Thus, at around 75° N (modern coordinates) there was likely a relatively narrow (less than 100 km wide) subaerial and highly magmatic rift center, which was surrounded by shallow water. In strike direction, the rift was not continuous along the incipient margin. Instead, it appears likely that individual, about 120 km-long rift segments broke up and SDRs were emplaced. In the central margin segment, the formation of the SDRs propagated initially towards the north but later the propagating direction changed towards the south. The last SDRs, close to the Jan Mayen Fracture Zone, were emplaced after chron C24.
Structures that compartmentalize a rift at high angles have long been recognized and, in NE Greenland, Rotevatn et al. [2018] point out that these transfer zone date back to the Caledonides. However, there is discussion if such rift segment boundaries necessarily develop into oceanic fracture zones after successful breakup of the continent. Here, we show that such segment boundaries do exist at the margins of the Greenland Sea but, as shown by Olesen et al. [2007], the segment boundaries did not necessarily develop into oceanic fracture zones. A main control of the margin segmentation was apparently lost with the onset of steady state oceanic crust formation, seaward of the outer SDRs. There may be examples where favorable stress conditions result in a direct continuation from continental transfer systems into oceanic fracture zones but this is obviously not always the case.
We find that during the final rifting evolution along the NE Greenland margin a narrow, elevated rift developed that had no clear propagation direction before the onset of steady-state seafloor spreading. The progressive development of breakup indicates that likely initially punctual seafloor spreading cells developed. This is close to the 3D configuration of analogue models, where after extensional deformation of the whole rift structure the breakup phase is characterized by the progressive propagation of periodic asthenospheric upwelling in
an extension-orthogonal (along-strike) direction [Corti et al., 2003]. A modern, albeit only moderately magmatic analogue may be the Red Sea, with the Pliocene punctiform regularly- spaced spots sequentially propagating in an extension-orthogonal direction and leading finally to steady-state seafloor spreading [Bonatti, 1985]. For the seafloor spreading stage, a more homogenous picture is derived. If the COT is located at the northern East Greenland continental slope, as we propose, the magnetic seafloor spreading anomalies in the oceanic domain terminate against the continental slope, supporting a southward propagating seafloor spreading system in the Greenland Sea [Koopmann et al., 2014; Voss et al., 2009]. During propagating, the active spreading ridge is offset laterally from the ridge it replaces [Hey et al., 2016]. Thus, propagating seafloor spreading is expected to produce asymmetric patterns and the pinch-out of oceanic spreading anomalies against the continental margin. This fits the distinct oblique angle of the anomalies C24A, C23 and C22 along the NE Greenland margin between Shannon Ø and the Jan Mayen Fracture Zone (Figs. 2 & 9). Thus, breakup took more than 4 Myrs from the Greenland Fracture Zone at 54.2 Ma (C24B) to the Jan Mayen Fracture Zone at 48-50 Ma [Skogseid and Eldholm, 1987], as suggested also by Voss et al.
[2009]. At least one additional phase of magmatism affected predominantly the area near the landward termination of the West Jan Mayen Fracture Zone. A large amount of volcanic rocks was emplaced across the shelf and this magmatic phase likely resulted also in the formation of the distinct volcanic Logi Ridge (Fig. 2). We consider it likely that this volcanism occurred in association with the separation of the Jan Mayen microcontinent from East Greenland in the late Oligocene/early Miocene.
5 Conclusions
Widespread voluminous breakup-related volcanic wedges are imaged in newly acquired reflection seismic data as SDRs along the northern East Greenland continental margin. These exhibit considerable variation in structural style and architecture along the 600 km-long continental slope between the West Jan Mayen Fracture Zone and the Greenland Fracture Zone. Generally, SDRs are found to decrease in size towards the north and south from a central point at 75°N. The most prominent SDRs are present 300 km along of the margin, between 74°N and 75.8°N. South of 74°N, a single, small SDR wedge is imaged that further decreases in size towards the West Jan Mayen Fracture Zone. Around the West Jan Mayen Fracture Zone, SDRs are indistinct or absent. From the architecture and tectono- magmatic style of the SDRs, it is shown that the NE Greenland margin is broadly segmented
into three segments that broke up in a consecutive way. The segment boundaries, however, did not develop into oceanic fracture zones, except the East Jan Mayen Fracture Zone.
We interpret the transition between oceanic and magmatically overprinted continental crust at the continental slope, in the vicinity of the SDR wedges. From magnetic modelling we propose that SDRs and lava flows are causing magnetic anomalies at the continental slope. The magnetic anomaly pattern associated with the SDRs, then is used to deduce a relative timing of the emplacement of the volcanic wedges. The inner SDRs in the northern margin segment (75°N-75.8°N) have been emplaced before the negative polarity chon C24r time and thus before volcanic rifting took place in the central and southern margin segment.
The SDRs in the central margin segment (74°N-75°N) initiated during the negative polarity chon C24r time but the major portion of the inner SDRs corresponds to the normal C24n magnetic chron (54.0–52.6 Ma). The deposition of a separate, seaward SDR wedge may even have lasted until chron C23n (51.8–50.6 Ma). The different magnetic anomalies associated with the two SDR wedges suggest two phases of volcanism resulting in the two wedges that were likely emplaced with a time lag. Finally, the small SDR wedge in the southern segment (73°N-74°N) coincide broadly with negative magnetic anomaly C23r (52.6-51.8 Ma).
The new data support a polyphase Cenozoic rift evolution with consecutive magmatic events. The Greenland Sea initiated in confined limited segments lacking a clear initial propagation direction. Breakup took place with punctual seafloor spreading, but the earliest steady-state oceanic crust formation reveals a clear, north to south-directed propagation. Each tectono-magmatic phase overprinted the areas that were previously rifted, resulting in tectonic deformation. Extensional deformation in association with the Kolbeinsey Ridge may extend farther north than previously assumed. Around the landward termination of the West Jan Mayen Fracture Zone, a major magmatic phase is identified that likely took place between 40 and 20 Ma (post-middle Eocene – pre-late Miocene). A controlling role of the transtensional deformation during the switch from the East to the West Jan Mayen Fracture Zone on volcanism in northern East Greenland is suggested.
Acknowledgments, Samples, and Data
We acknowledge funding of the research cruise MSM67 by the German Research Foundation (DFG). Master Ralf Schmidt and the entire crew of RV Maria S. Merian are thanked for their support during the cruise. The newly acquired reflection seismic data shown in this article can be accessed upon reasonable request via the pan-European marine geological and geophysical data centre Geo-Seas (www.geo-seas.eu). We thank the Geological Survey of Denmark and Greenland (GEUS) for loaning seismic data and the permission to publish example seismic sections (KANUMAS, GGU). We thank Laurent Gernigon and an anonymous reviewer for constructive reviews that improved the manuscript and editor Laurent Jolivet and an associate editor for editorial handling.
References
Abdelmalak, M. M., S. Planke, J. I. Faleide, D. A. Jerram, D. Zastrozhnov, S. Eide, and R.
Myklebust (2016a), The development of volcanic sequences at rifted margins: New insights from the structure and morphology of the Vøring Escarpment, mid-Norwegian Margin, Journal of Geophysical Research: Solid Earth, 121(7), 5212-5236, doi:
10.1002/2015jb012788.
Abdelmalak, M. M., et al. (2016b), Pre-breakup magmatism on the Vøring margin: Insight from new sub-basalt imaging and results from Ocean Drilling program hole 642E, Tectonophysics, 675, 258–274, doi: http://dx.doi.org/10.1016/j.tecto.2016.02.037.
Barnett-Moore, N., R. D. Müller, S. Williams, J. Skogseid, and M. Seton (2016), A reconstruction of the North Atlantic since the earliest Jurassic, Basin Research, 1-26, doi:
10.1111/bre.12214.
Becker, K., D. C. Tanner, D. Franke, and C. M. Krawczyk (2016), Fault-controlled lithospheric detachment of the volcanic southern South Atlantic rift, Geochemistry, Geophysics, Geosystems, n/a-n/a, doi: 10.1002/2015gc006081.
Behn, M. D., M. S. Boettcher, and G. Hirth (2007), Thermal structure of oceanic transform faults, Geology 35(4), 307-310, doi: 10.1130/G23112A.1.
Berger, D., and W. Jokat (2008), A seismic study along the East Greenland margin from 72°N to 77°N, Geophysical Journal International, 174(2), 733-748, doi: 10.1111/j.1365- 246X.2008.03794.x.
Berndt, C., S. Planke, E. Alvestad, F. Tsikalas, and T. Rasmussen (2001a), Seismic volcanostratigraphy of the Norwegian Margin: constraints on tectonomagmatic break-up processes, Journal of the Geological Society, 158(3), 413-426.
Berndt, C., R. Mjelde, S. Planke, H. Shimamura, and J. I. Faleide (2001b), Controls on the tectono-magmatic evolution of a volcanic transform margin: the Vøring Transform Margin, NE Atlantic, Marine Geophysical Researches, 22(3), 133-152.
Blischke, A., C. Gaina, J. R. Hopper, G. Péron-Pinvidic, B. Brandsdóttir, P. Guarnieri, Ö.
Erlendsson, and K. Gunnarsson (2016), The Jan Mayen microcontinent: an update of its architecture, structural development and role during the transition from the Ægir Ridge to the mid-oceanic Kolbeinsey Ridge, Geological Society, London, Special Publications, 447, doi:
10.1144/sp447.5.
Bonatti, E. (1985), Punctiform initiation of seafloor spreading in the Red Sea during transition from a continental to an oceanic rift, Nature, 316(6023), 33-37, doi:
10.1038/316033a0.
Breivik, A. J., R. Mjelde, J. I. Faleide, and Y. Murai (2012), The eastern Jan Mayen microcontinent volcanic margin, Geophysical Journal International, 188(3), 798-818, doi:
10.1111/j.1365-246X.2011.05307.x.
Brekke, H., H. I. Sjulstad, C. Magnus, and R. W. Williams (2001), Sedimentary environments offshore Norway - an overview, in Sedimentary environments offshore Norway - Palaeozoic to Recent., edited by O. J. Martinsen and T. Dreyer, pp. 7-37, Norwegian Petroleum Society (NPF) Special Publication
Corti, G., J. Van Wijk, M. Bonini, D. Sokoutis, S. Cloetingh, F. Innocenti, and P. Manetti (2003), Transition from continental break-up to punctiform seafloor spreading: How fast, symmetric and magmatic, Geophysical Research Letters, 30(12, 1604), 1-4, doi:
10.1029/2003GL017374.
Davis, J. K., A. Bécel, and W. R. Buck (2018), Estimating emplacement rates for seaward- dipping reflectors associated with the U.S. East Coast Magnetic Anomaly, Geophysical Journal International, 215(3), 1594-1603, doi: 10.1093/gji/ggy360.
Døssing, A., P. Japsen, A. B. Watts, T. Nielsen, W. Jokat, H. Thybo, and T. Dahl-Jensen (2016), Miocene uplift of the NE Greenland margin linked to plate tectonics: Seismic evidence from the Greenland Fracture Zone, NE Atlantic, Tectonics, 35(2), 257-282, doi:
10.1002/2015tc004079.
Doré, A. G., E. R. Lundin, L. N. Jensen, Ø. Birkeland, P. E. Eliassen, and C. Fichler (1999), Principal tectonic events in the evolution of the northwest European Atlantic margin, Geological Society, London, Petroleum Geology Conference series, 5, 41-61, doi:
10.1144/0050041.
Eldholm, O. (1991), Magmatic tectonic evolution of a volcanic rifted margin, Marine Geology, 102(1–4), 43-61, doi: http://dx.doi.org/10.1016/0025-3227(91)90005-O.
Eldholm, O., J. Thiede, E. Taylor, and e. al. (1987), Summary and preliminary conclusions, ODP Leg 104, College Station, TX (Ocean Drilling Program).
Elliott, G. M., and L. M. Parson (2008), Influence of margin segmentation upon the break-up of the Hatton Bank rifted margin, NE Atlantic, Tectonophysics, 457(3-4), 161-176.
Faleide, J. I., K. Bjørlykke, and R. H. Gabrielsen (2010), Geology of the Norwegian Continental Shelf, in Petroleum Geoscience: From Sedimentary Environments to Rock Physics, edited, pp. 467-499, Springer Berlin Heidelberg, Berlin, Heidelberg, doi:
10.1007/978-3-642-02332-3_22.
Funck, T., W. H. Geissler, G. S. Kimbell, S. Gradmann, Ö. Erlendsson, K. McDermott, and U. K. Petersen (2016), Moho and basement depth in the NE Atlantic Ocean based on seismic refraction data and receiver functions, Geological Society, London, Special Publications, 447, doi: 10.1144/sp447.1.
Gaina, C., L. Gernigon, and P. Ball (2009), Palaeocene–Recent plate boundaries in the NE Atlantic and the formation of the Jan Mayen microcontinent, Journal of the Geological Society, 166(4), 601-616, doi: 10.1144/0016-76492008-112.
Gaina, C., A. Nasuti, G. S. Kimbell, and A. Blischke (2017), Break-up and seafloor spreading domains in the NE Atlantic, Geological Society, London, Special Publications, 447, doi:
10.1144/sp447.12.
Gaina, C., S. C. Werner, R. Saltus, S. Maus, and t. C.-G. GROUP (2011), Chapter 3 Circum- Arctic mapping project: new magnetic and gravity anomaly maps of the Arctic, Geological Society, London, Memoirs, 35(1), 39-48, doi: 10.1144/m35.3.
Geissler, W. H., C. Gaina, J. R. Hopper, T. Funck, A. Blischke, U. Arting, J. Á. Horni, G.
Péron-Pinvidic, and M. M. Abdelmalak (2016), Seismic volcanostratigraphy of the NE Greenland continental margin, Geological Society, London, Special Publications, 447, doi:
10.1144/sp447.11.
![Table 1: Magmatic and tectonic events according to 1 [Abdelmalak et al., 2016b], 2 [Storey et al., 2007], 3 [Price et al., 1997], 4 [Gernigon et al., 2012], 5 [Gaina et al., 2009], 6 [Tegner et al., 2008], 7 [Mosar et al., 2002], 8 [Hey et al., 2016], 9](https://thumb-eu.123doks.com/thumbv2/1library_info/5300016.1677704/34.892.94.806.159.1136/table-magmatic-tectonic-according-abdelmalak-storey-gernigon-tegner.webp)