sciences
Article
Techniques and Emerging Trends for State of the Art Equipment Maintenance
Systems—A Bibliometric Analysis
Burkhard Hoppenstedt1,*, Rüdiger Pryss1, Birgit Stelzer2, Fabian Meyer-Brötz2, Klaus Kammerer1 ID, Alexander Treß3and Manfred Reichert1
1 Institute of Databases and Information Systems (DBIS), Ulm University, 89081 Ulm, Germany;
ruediger.pryss@uni-ulm.de (R.P.); klaus.kammerer@uni-ulm.de (K.K.); manfred.reichert@uni-ulm.de (M.R.)
2 Institute of Technology and Process Management, Ulm University, 89081 Ulm, Germany;
birgit.stelzer@uni-ulm.de (B.S.); fabian.meyer-broetz@uni-ulm.de (F.M.-B.)
3 ATR Software GmbH, 89231, Neu-Ulm, Germany; tress@atr-software.de
* Correspondence: burkhard.hoppenstedt@uni-ulm.de
Received: 28 March 2018; Accepted: 30 May 2018; Published: 2 June 2018
Abstract: The increasing interconnection of machines in industrial production on one hand, and the improved capabilities to store, retrieve, and analyze large amounts of data on the other, offer promising perspectives for maintaining production machines. Recently, predictive maintenance has gained increasing attention in the context of equipment maintenance systems. As opposed to other approaches, predictive maintenance relies on machine behavior models, which offer several advantages. In this highly interdisciplinary field, there is a lack of a literature review of relevant research fields and realization techniques. To obtain a comprehensive overview on the state of the art, large data sets of relevant literature need to be considered and, best case, be automatically partitioned into relevant research fields. A proper methodology to obtain such an overview is thebibliometric analysismethod. In the presented work, we apply a bibliometric analysis to the field of equipment maintenance systems. To be more precise, we analyzed clusters of identified literature with the goal to obtain deeper insight into the related research fields. Moreover, cluster metrics reveal the importance of a single paper and an investigation of the temporal cluster development indicates the evolution of research topics. In this context, we introduce a new measure to compare results from different time periods in an appropriate way. In turn, among others, this simplifies the analysis of topics, with a vast amount of subtopics. Altogether, the obtained results particularly provide a comprehensive overview of established techniques and emerging trends for equipment maintenance systems.
Keywords: bibliometric analysis; predictive maintenance; research front graph; article density;
trend analysis
1. Motivation
This presented literature study systematically reviews existing literature related to equipment maintenance systems to elaborate the state of the art as well as to discover current research trends.
In this context, predictive maintenance (PdM) constitutes a specific method that aims to improve maintenance management methods, such asrun-to-failure[1] orpreventive maintenance[2], by including knowledge of the machine behavior with the goal to derive an optimal maintenance strategy. According to Mobley, the common target ofpredictive maintenance applications(PMA) constitutes “[...] regular monitoring of the actual mechanical condition, operating efficiency, and other indicators of the operating condition of machine-trains [...] to ensure the maximum interval between repairs as well as to minimize the number and cost of unscheduled outages created by machine-train failures ” [3].
Appl. Sci.2018,8, 918; doi:10.3390/app8060918 www.mdpi.com/journal/applsci
In general, literature reviews [4] offer a technique to structure scientific articles. Existing review types focus on different strategies and should be chosen to fit best to the problem definition.
Our requirements for reviewing the field of state of the art equipment maintenance systems are (1) to cover a wide range of articles, (2) to identify contemporary maintenance procedures and techniques, (3) to discover current trends, (4) to discover highly cited and influential articles, and (5) to include latest research on equipment maintenance systems. Other literature reviews do not always satisfy these requirements, e.g., the authors of [5,6] do not address Requirement 1. Concerning Requirement 2, for example, the authors of [7,8] do not consider recent research. In other works, in turn, the analyzed equipment maintenance strategy is too specific [9,10] or too general [11] compared to the literature review presented in this paper. To properly address Requirements 1–5, the literature review we accomplished uses thebibliometric analysis. In particular, the bibliometric analysis offers several advantages:
• It visualizes relevant study articles based on various connection types, e.g., research fronts, knowledge bases, authors, and author affiliations.
• It enables us to automatically cluster articles.
• It enables quick recalculations of clusters based on different time periods.
Consequently, bibliometric analyses tend to be very effective when facing large and heterogeneous data sets. Thus, we apply the bibliometric analysis in the context of our literature review on equipment maintenance systems. We believe that this research field involves a multitude of research issues as well as complex interdependencies between them.
The procedure to accomplish the presented bibliometric analysis comprises ten steps as illustrated in Figure1in the left column. (Please note that that Figure1also shows in the middle and right columns, which steps have been actually accomplished for the present work.) The first step (cf. Figure1, 1) is to select the academic databases from which relevant works shall be obtained. Frequently, the following databases are used:Google Scholar,Scopus,Web of Science, andScienceDirect. Despite the wide-spread use of Google Scholar in Computer Science, we decided to base our review on Web of Science for two reasons. First, Web of Science and Scopus (Scopus would be another valuable source for our approach. Please note that both Web of Science and Scopus are payment platforms [12]. The reason we use just one is that our institution only has an account for Web of Science. In addition, according to [12], the differences between the two platforms constitute no crucial threat to validity.) currently generate citation data that can be comfortably used with existing bibliometric analysis software tools.
Second, Web of Science is compared to Google Scholar a so-called human-curated academic database, which leads to more controlled citation data. On the other hand, Google Scholar reflects a more current status of all published papers and theses in most cases. However, we still rely on Web of Science, as a visual inspection revealed that only a few recent papers can be found with Google Scholar, but not in Web of Science. Furthermore, an in-depth comparison of academic databases is a complex endeavor, which is beyond the scope of this paper. However, we are aware of this limitation regarding the presented review.
In the second step of a bibliometric analysis, one must specify the set of search strings to be applied to the used academic database (cf. Figure1, 2). In the context, we applied the following search strings to Web of Science: predictive maintenance, condition monitoring, smart maintenance, lean maintenance,reliability-centered maintenance, andpredictive analytics. Those search strings were defined after an open search on various maintenance techniques. All those techniques can be also applied in the field ofEngineering Asset Management([13,14]). Concerning the 12 functions of general asset management, as introduced by [15], we are mainly interested in Risk Management, Condition Monitoring, Asset Usage Life Cycle, Performance Measures, and Information Systems. For example, the integration of a maintenance method into asset management, e.g., by using condition monitoring [16], represents one typical workflow that is relevant for us.
After applying the search strings to Web of Science, we exported the results (cf. Figure1, 3) to apply several preprocessing steps (cf. Figure1, 4–5) to remove unfitting results (e.g., maintenance in a
medical context) from the extracted data. Following this, the cleansed data was fed into a software for bibliometric analysis. As depicted in Figure1, the performed calculations and related interpretations comprise five steps (i.e., Steps 5–10 in Figure1). The obtained results, in turn, provide a valuable overview for state of the art maintenance systems in general and predictive maintenance in particular.
Additionally, we were able to identify fundamental (i.e., distinguished) papers in this field. Moreover, to the best of our knowledge, the work at hand is the first one that applied bibliometric analysis in reviewing the research field of equipment maintenance systems. In addition, our results underlie that bibliometric analyses are able to gain valuable insights.
The remainder of this paper is structured as follows: Section2provides deeper insight into the methodology applied, i.e., the bibliometric analysis. The result set obtained from the search strings applied to Web of Science are discussed in Section3. In Section4, results of the bibliometric analysis are presented. In turn, Section5introduces a novel measure to rank single articles in a multi-dimensional way. Section6predicts research trends based on the past development of related topics, whereas Section7discusses threats to validity. Finally, Section8concludes the paper and gives an outlook.
Select Data Source 1
Step Input Result
Define Query String
2 Comprehensive
Literature Study List of Search Queries
Export Articles from Web of Science
3 + List of Search
Queries
Data Sets
Calculated content Author content Data source
Select Fitting Categories
4 Category Entries
from Data Sets Whitelist of
Categories
Remove Unfitting Categories
5 Whitelist
Data Sets
Filtered Data Sets
Calculate Clusters
6 Filtered Data Sets Networks
Interpret Clusters
7 Networks Research Fronts,
Techniques, Trends
Identify Top Articles
8 Research Fronts List of Top Articles
Rank Top Articles
9 Importance Measure
+ List of Top Articles
Sorted List of Top Articles
Forecast
10 Trends Prognose
+
Figure 1.Workflow of a Bibliometric Analysis.
2. Bibliometric Analysis
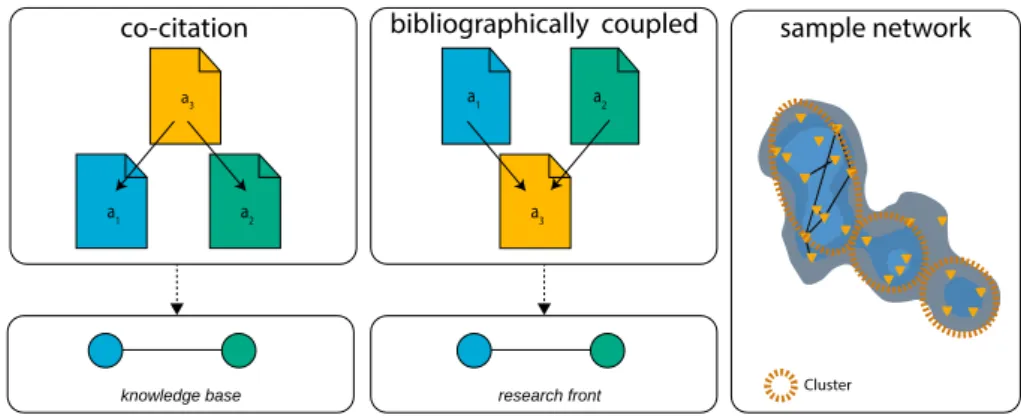
Bibliometric analysis is a method from the field of Bibliometrics [17]. The latter, in turn, has connotations with the termstatistical bibliography and constitutes a quantitative approach to literature research. In the bibliometric analysis we performed with the goal to identify existing research fields in the context of state of the art equipment maintenance systems, we follow the basic idea presented in [18], which introduced mathematical graphs, denoted as networks, as a suitable solution to represent a set of connected literature. In this network, each article is represented by a node, whereas edges constitute their bibliographic connections. In turn, connections can be established based on a multitude of similarity measures. In general, a similarity measure is based on the assumption that two articles pose a similarity in terms of thematic content. To identify entire research fields, denoted as clusters in a network (cf. Figure2), two similarity measures are of utmost importance:Knowledge Bases andResearch Fronts[19] (cf. Figure2). Two articles are bibliographically coupled (i.e., they are part of a research front) if they reference the same third article. Couplings between nodes become stronger (i.e., represented by a thicker line in the plotted network) if they co-cite multiple articles. By contrast, two references are connected by co-citation (i.e., they are part of a knowledge base) if they are both referenced by a third article. In addition to identify relevant research fields, we were interested in networks for authors [20], countries, and organizations, which can be established by other similarity measures. Based on the evaluation of networks, valuable results can be obtained according to [21]:
• Identifying the research field structure
• Detecting general contextual factors
• Discovering developments in research
• Forecasting coming trends
a3
a1 a2 a3
a1 a2
co-citation
knowledge base research front
bibliographically coupled sample network
Cluster
Figure 2.Knowledge Base, Research Front, and Sample Network.
Another crucial aspect in performing a bibliometric analysis concerns the use of an appropriate software tool. In the field of bibliometrics, there exist tools that are specifically developed for for bibliometric analysis visualization techniques [22]). We used NetCulator [23] for the bibliometric analysis we conducted. NetCulator offers features to calculate the mentioned networks. Furthermore, it combines bibliographic coupling with lexical measures that, in turn, compare the similarity of terms (cf.TF-IDFin AppendixA.2). Next, NetCulator calculateshybrid second-order similarities(See AppendixA.2) with severeedge cutting[24]. The latter improves the calculation speed by ignoring all weak edges that result from weak coupling between nodes. Finally, NetCulator computes clusters based onLouvain Clustering[25]. Visualization and layouting forresearch frontsandknowledge baseseither rely on the OpenOrd-Method [26], which provides a quick overview by automatically summarizing clusters, or the Fruchterman-Reingold algorithm [27] enabling a more detailed view. NetCulator offers many other valuable features, we utilized the context of our bibliometic analysis, e.g.,
• Identifying core articles (i.e., significant papers within a research field).
• Identifying frequently used terms in a research field.
• Identifying trends based on calculated timelines [28] for research fronts.
Although the technique of bibliometric analysis is promising, it also comes with some limitations:
First, the articles need to be published in an academic database. As a drawback, especially in the field of industrial production, articles are often represented as patents and internal enterprise documents.
As another drawback, competition between companies leads to a large number of non-disclosure agreements. Second, any bibliometric analysis is dependent on the choice of the used search strings [29].
Finally, a time lag must be considered, as it might take years for research to be published and cited.
3. Data Set
3.1. Search Strings
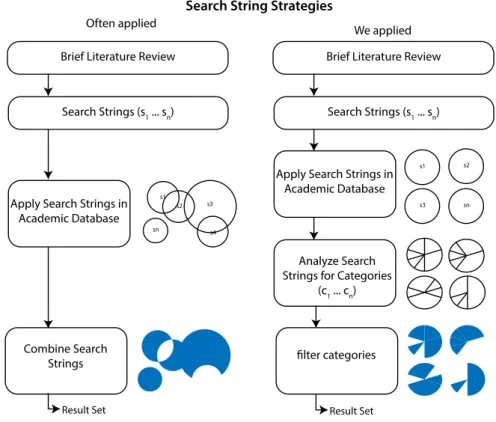
Based on a comprehensive literature prestudy, as well as interviews with domain experts, we selected predictive maintenance [3], condition monitoring [30], smart maintenance [31], lean maintenance[32],reliability-centered maintenance[33], andpredictive analytics[34] as appropriate search strings for our search strategy (cf. Figure3).
Often applied Brief Literature Review
We applied Search String Strategies
Search Strings (s1 ... sn)
Apply Search Strings in Academic Database
s1
s2 s3
sn s4
Combine Search Strings
Result Set
Apply Search Strings in Academic Database
s1
Brief Literature Review
Search Strings (s1 ... sn)
Analyze Search Strings for Categories
(c1 ... cn)
s2
s3 sn
filter categories
Result Set
Figure 3.Applied Search Strategy.
The Web of ScienceCore Collectionis used to gather the article result set (date of withdrawal:
11 November 2016). Results for the search strings applied to Web of Science are shown in Table1.
Table 1.Overview of the gathered data set.
Query Entries Oldest Typical Category Articles from 2016
PDMa 4742 1970 EEE * 311
CMb 144,758 1956 EEE * 8416
SMc 1447 1970 EEE * 109
LMd 1299 1967 ND ** 74
RCMe 588 1978 EEE * 27
PAf 717 1996 EEE * 119
*Engineering Electrical Electronic.**Nutrition Dietetics.aPredictive Maintenance.bCondition Monitoring.c Smart Maintenance.dLean Maintenance.eReliability-centered Maintenance.f Predictive Analytics.
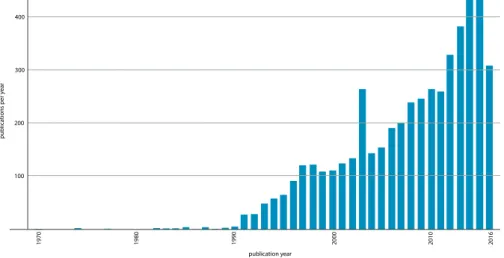
In this paper, we particularly focus on the results related to predictive maintenance. Concerning research history, the first article referring topredictive maintenancein its title [35] was published in 1970 in the field of chemical engineering. The number of papers published per year has significantly increased since the 1990s (cf. Figure4). For example, in 2015, the extracted predictive maintenance articles had an averageh-index [36] of 118 and a mean of 17.18 citations per item. By contrast, articles dealing withcondition monitoringhave an average h-index of 36 and a mean of 2.97 citations per item. Finally note that the search stringcondition monitoringis often used as a synonym for predictive maintenance in case of a costly monitoring approach. Accordingly, the borders between predictive maintenance and condition monitoring blur.
100 200 300 400
publications per year 1970 1980 1990 2000 2010 2016
publication year
Figure 4.Published Articles forPredictive Maintenance.
3.2. Preprocessing Dataset
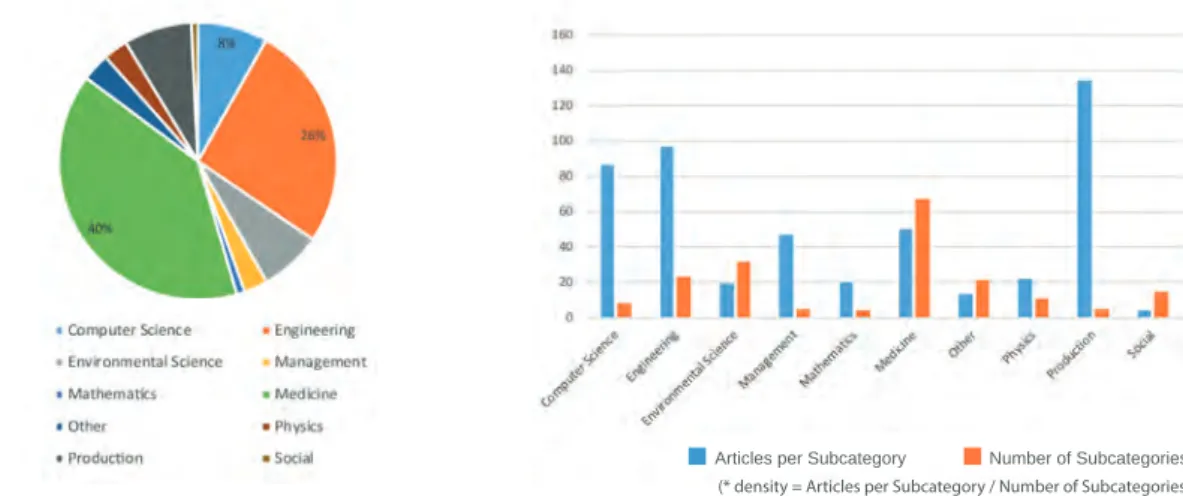
As Web of Science categorizes each article based on a multitude of categories, first of all, we had to choose the relevant ones. To simplify the categorization, we summarized Web of Science categories to sections. Figure5illustrates all sections (In addition, the left side of Figure6illustrates the distribution of sections for the search string predictive maintenance.) on one hand and the ones identified as being relevant on the other. Based on the relevant Web of Science categories, we filter articles utilizing the white list principle, i.e., we keep an article in the data set, if it matches at least with one of the relevant categories. As can be obtained from Figure5, we excluded a lot of Web of Science categories for the search stringpredictive maintenance. First, we calculated an article density for sections (cf. Figure6, right side). The density is defined as(number of articles in section)/(number of categories in section). If the density for a section is low, the section is excluded.
Accepted
ye s no
Section Categories (Selection) Computer Science
Engineering Management Production
Environmental Science Mathematics Medicine Physics Social Other
AI, Software Engineering, Hardware Architecture, Cybernetics Electrical-, Mechanical-, Aerospace,- Nanotechnology Operations Research, Business, Finance
Control Systems, Transportation, Industrial Engineering Environmental Engineering, Biodiversity Conservation Statistics, Applied Mathematics
Surgery, Immunology, Health Care Optics, Thermodynamics, Nuclear Education, Political Science, Sociology Sport, Food Science
Figure 5.Relevant Web of Science Categories.
For example, in the section medicine (cf. Figure6), the density is very low, meaning that the average number of articles per category is small. The reason we exclude such sections is based on the assumption that predictive maintenance solely plays a side role in these sections.
Articles per Subcategory Number of Subcategories (* density = Articles per Subcategory / Number of Subcategories)
Figure 6.Section Distribution and Article Density (Improved Readability).
4. Biblometric Analysis Results
We apply the bibliometric analysis to the data set described in Section3using the NetCulator tool.
Thereby, for each aspect to be evaluated (i.e., research fronts, knowledge bases, authors, organizations, countries, terms), several NetCulator parameters have to be defined.
First of all, a time period needs to be specified. For our bibliometric analysis, we decided to do the calculations for different time periods in order to identify how the topic of predictive maintenance evolves over time. More specifically, we use three time periods: [1990–2000], [2000–2008], and [2008–2016]. These periods were defined using an iterative process in NetCulator and comparing emerging paper distributions. Please note that that this is a common way pursued in a bibliometric analysis. Then, the NetCulator user must define many more parameters (e.g., cluster size). Thereby, the user can either use default parameters or specifies his own parameter set. All parameters that can be specified are shown in Figure7. Finally, NetCulator presents the calculated networks to the user.
Please note that that the Figure7shows the actual parameters used for the presented bibliometric analysis in this work.
Figure 7.Calculation Parameters (Improved Readability).
4.1. Predictive Maintenance
In the following, we provide a detailed analyses forpredictive maintenancein the aforementioned time periods (cf. Figure8).
PdM Period 1 PdM Period 2 PdM Period 3 CM Related Methods Country Network
Keyword Ranking Research Front Clusters Research Front Graph Publication Map
Research Front Flow Diagram Keyword Ranking Comparison Coorporation Map Identified Techniques 3D Density Matrix
Moved to Appendix
Figure 8.Visualizations in each Period.
4.1.1. Period 1990–2000
First of all, the results for the first period are based on 175 articles. The first work for this period was initiated by the American Association for Artificial Intelligence, whose subgroup, calledSpecial Interest in Manufacturing(SIGMAN), organized workshops collecting ideas in this context. Since an American organization was pioneering the topic of predictive maintenance in this period, the leading publication nation was the US (29.7%), followed by France (8.0%) and Canada (7.4%). According to Figure9, we can observe an increasing cooperation of countries over time and a stronger thematic focus. More specifically, each data point in Figure9represents a country, a close distance between them indicates researching in similar topics. However, closeness does not necessarily display collaborations, but constitutes an indicator of a high knowledge transfer between the involved countries. In general, the research in this first period did not reveal any outstanding research topic. Accordingly, no leading author or institution could be identified. The keyword analysis for the first period (cf. Table2) shows a strong connection between the termspredictive maintenanceandmonitoringas they belong to the same cluster (i.e., Cluster1from Table2. Furthermore, as monitoring is represented by the two keywords condition monitoringandmonitoring, this topic is a leading one in this period.
1990 - 2000 2000 - 2008 2008 - 2016
Publication density Countries Strong cooporation
Figure 9.Evolution of Country Networks (obsolete).
Interestingly,monitoringandpredictive maintenanceare in the same cluster, while this does not apply to condition monitoring, i.e., in this period, despite the thematic closeness ofcondition monitoring andpredictive maintenance, they were addressed independently. Please note that that this result supports our decision to considercondition monitoringas a separate search string. In general, we assume the following order of complexity for tasks in the context of equipment maintenance systems:
Report→Analysis→Monitoring→Prediction
Furthermore, we assume the techniquemonitoringneeds mainly humans as decision makers and rarely relies on techniques ofmachine learning.
Table 2.Keywords.
Keyword Quantity Percentage Cluster
Predictive Maintenance 25 14.3 1
Condition Monitoring 12 6.9 3
Maintenance 8 4.6 1
Diagnosis 7 4.0 2
Monitoring 6 3.4 1
Models 6 3.4 1
Neural Networks 5 2.9 2
Vibration 5 2.9 2
After calculating research fronts, we sort the articles based on the number of citations.
The most popular paper, according to citations, is denoted aslead document. In a manual inspection, used techniques of the lead document and a thematic field for each cluster have been identified.
The collected information are shown in Table3, where the thematic field is denoted ascluster label.
The manual labeling of each cluster, denoted as cluster caption, and the identification of the used technique considers top terms, scanning the resulting articles. Please note that not every article in each research front needs to deal with the topic the cluster caption implies. In general, a bigger cluster size increases the probability of afalse-positivecluster classification. The research front clusters from Table3 are explained in the following. Cluster 1 deals with the continuous status monitoring. This cluster is coined by a joint project between the US and Egypt, as represented by the Alexandria National Iron &
Steel Company. Second, in Cluster 2, items were found dealing withvibration analysis. Here, vibrations caused by for example pumps, spindles and motors are used to refer to abnormal machine behavior.
Cluster 3 assembles literature that deals with maintenance in risky environments, such as oil refinery and nuclear power plants. With a focus on special electronic equipment, such as radars and motors, Cluster 4 contains research based on the question how to predict electric systems behavior.
Table 3.Research Front Clusters.
# Lead Document Citations Cluster Label Technique
1 Predictable scheduling of
173 On-line Monitoring Network Minimax a job shop subject to breakdowns [37]
2 Analysis of computed order tracking [38] 173 Vibration Analysis Frequency analysis 3 The analytic hierarchy process applied
133 Nuclear Risks and Safety Analytic Hierarchy Process to maintenance strategy selection [39]
4 Insulation failure prediction in AC
82 Prediction on Electric Systems Band Pass Filter machines using line-neutral voltages [40]
5 Pontis: A System for Maintenance Optimization
53 Stochastic Models Markov Processes
and Improvement of US Bridge Networks [41]
6 Classification techniques for metric-based
50 Software Maintenance Fuzzy Classification software development [42]
7 Model-predictive control of a combined
39 Model Predictive Control Model Predictive Control sewer system [43]
8 Emissivity measurement and temperature
26 Emission Control IR Camera
correction accuracy considerations [44]
9 Prediction of wafer state after plasma processing
23 Hydroelectricity & Photovoltaics Neural Network using real-time tool data [45]
Cluster 5 represents the research field of stochastic approaches in various applications. Since not only machines need to be supervised, but also the software itself, the field ofsoftware maintenance6 addresses these challenges with code metrics and fuzzy structures. Cluster 7 lists literature dealing withmodel predictive control(MPC). It is an advanced method of process control and it is frequently used in the context of lime production and kiln heating. Next, literature concerning emission control is collected in Cluster 8. Emission changes, e.g., caught by a infrared camera, indicate a changing machine behavior. Finally, Cluster 9 is labeled with the term hydroelectricity & photovoltaics. In this cluster,agent-basedmethods can be frequently found.
4.1.2. Period 2000–2008
First, research fronts and lead documents are extracted analogous to the way described in Section4.1.1(cf. TableA1). Some research front labels from the previous period can be reused, while new clusters are presented in the following. The topic ofpredictive models(1) bundles general approaches to model and improve maintenance approaches, including even basic ideas (e.g., corporations between firms for data exchange). In the previous period, the keyword analysis recognizedmonitoring(3) as being important, but no further cluster were identified for monitoring. In turn, during the second period, there exists a cluster with a focus on visualization. Third, when considering maintenance, costs constitute an important factor as well. The cluster ofcost-based models(4) emphasizes the costs for exchanging and maintaining machine parts. This cluster can be seen in contrast to the approach ofreliability-centered maintenance. Concerning abrasion and the condition of cables, the clustercable diagnostic(8) discusses solutions. With growing complexity of maintenance systems, themanagement (9) aspect is evolving accordingly. In this cluster, the literature stresses the organization of maintenance strategies as well as the evaluation of their performance. Next, research onmotor fault prediction(10) grew forming a cluster. A widely used method in this context is theroot cause analysis. Moreover, a new cluster denoted asgeneric approach(11) was found. Thereby, in most papers data-mining or machine-learning methods are utilized to enable adaptive maintenance systems. Finally, the cluster sensor data(13) deals with the integration of sensors into maintenance systems.
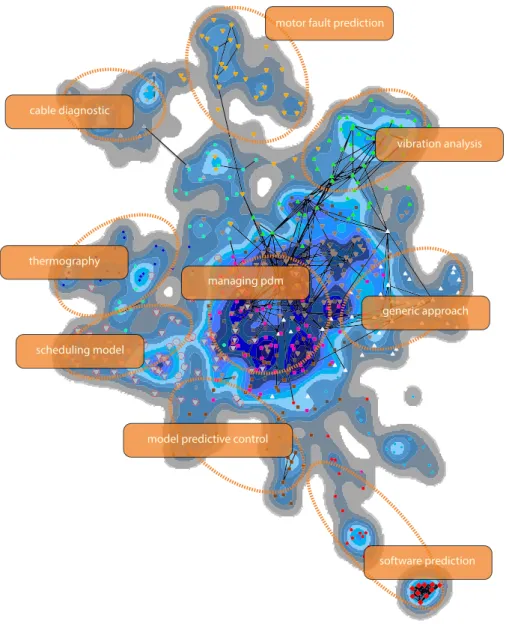
A visualization of the research fronts corresponding to TableA1is illustrated in Figure10. Articles from the same cluster are plotted with the same shape and color, whereas their proximity indicates a thematic similarity. Please note that a high article density is marked with dark blue. Figure10depicts all 574 papers from the second period. When regarding their connections, however, only the strongest 242 out of 4826 are shown. The research frontmanaging pdm is the central cluster, as it is an indirect part of many other research fields. By contrast, thesoftware predictioncluster is outside of the center as it is not thematically connected to most other clusters.
motor fault prediction
vibration analysis
software prediction model predictive control
cable diagnostic
thermography
scheduling model
managing pdm
generic approach
Figure 10.Research Front Graph.
Concerning participating countries in research, the increase of Chinese publications is noticeable.
More specifically, the number of publications grew from 0 to 54 (cf. Figure11), making China the second most publishing country in this field. Remarkable seems to be the fairly low participation in research of highly industrialized countries like Japan and Germany. The United States remain the most active country in the research field of predictive maintenance and the University Cincinnati (Ohio) constitutes the driving force.
4.1.3. Period 2008–2016
Again, first of all, research fronts are calculated and evaluated (cf. TableA2). The newly emerging clusters are presented in the following. First, one of the added clusters deals withmulti-component applications(1), that aim to combine data of multiple production units into one predictive model.
2 Number of Publications 377
Figure 11.Published Literature.
With increasing interest in alternative energies,wind turbines(4) come into the focus of predictive maintenance systems. Third, the discipline known asprognostics and health management(5), which links failure mechanisms to system life cycle management, forms a cluster as well. Furthermore clusterCloud and IoT(6) aims at better production results by, first and foremost, including recent developments from Big Data AnalyticsandDistributed Systems. Dealing with certain machine components, the analyzes of rolling bearings(7) andcapacitors(8) form other clusters. Literature referring to the prediction of metal deterioration due tocorrosionis collected in (11), whereasrail maintenance(14) monitors the current state of roads and rails. Finally, by analyzing changes inoil(15) consistency and consumption, a changing machine behavior must be considered. Concerning the publishing countries, China increases its number of publications, while the US remain number one. In turn, the Tsinghua University (Peking) constitutes now the driving force for publications in this topic.
After discussing the results of the periods separately, keywords, research fronts, and techniques over all three periods are juxtaposed in the following.
Keyword Ranking
A first possibility of showing the development of research during the time periods is the comparison of top keywords. Table4shows the top mentioned key words, their percentage distribution, and their difference in ranking position compared to the previous period (cf. Section4.1.1). The ranking difference is denoted as ∆, whereby a positive∆ denotes growing importance of this keyword.
Furthermore, letternstands fornot mentioned yet, meaning that this keyword was not introduced in a previous period. Two particular developments can be obtained from Table4. First, the complexity of predictive maintenance systems rises over time. During the first period, there is a focus on rather simple methods, such as monitoring and preventive maintenance, while their importance decrease during the last period, in which more complex issues (e.g., prediction and prognostics) are addressed.
An example of this development can be seen in the ratio betweenfault detectionandfault diagnosis.
During the first period, they are equally important, while in the last period the diagnostic part is more important. As a second aspect, the used techniques are not explicitly mentioned anymore in the last period. The disappearance of techniques likeneural networksandgenetic algorithms, which had an outstanding ranking position before, indicates that they are now in a rather major state, i.e., they are no longer explicitly mentioned.
Table 4.Keyword ranking.
1990–2000 2000–2008 2008-2016
# Key % Key % ∆ Key % ∆
1 predictive maintenance 17.99 predictive maintenance 11.86 0 predictive maintenance 9.61 0
2 condition monitoring 8.63 maintenance 3.83 +1 condition monitoring 3.17 +1
3 maintenance 5.76 condition monitoring 3.35 −1 maintenance 2.73 −1
4 diagnosis 5.04 neural network 2.75 +3 reliability 2.12 +1
5 monitoring 4.32 reliability 2.51 +27 condition-based maintenance 1.5 +7
6 models 4.32 fault detection 1.92 +7 fault diagnosis 1.32 +11
7 neural networks 3.6 preventive maintenance 1.8 +2 prognostics 1.28 +2
8 vibration 3.6 genetic algorithm 1.56 n prediction 1.15 +36
9 preventive maintenance 2.88 prognostics 1.44 n model predictive control 0.93 +67
10 emissivity 2.16 partial discharges 1.32 n data mining 0.93 +8
11 thermography 2.16 condition-based maintenance 1.32 n preventive maintenance 0.93 −4
12 fault diagnosis 2.16 diagnostics 1.2 +22 fault detection 0.88 −6
13 fault detection 2.16 modelling 1.08 n optimization 0.79 +48
14 failure prediction 2.16 sensors 0.96 n wind turbine 0.75 n
15 failures 1.44 maintenance management 0.96 n monitoring 0.71 +7
Research Front Development
To gain insights into the development of research fronts, we sort all identified research fronts according to their relative size in the period and search for recurrences (cf. Figure12). Furthermore, we identify highly overlapping subjects, using the graphical representation of research fronts, and put related research fronts in brackets. As vibration analysis is constantly present in all periods, it is being revealed as the most important research field. In addition, we discovered that the thematic field Internet of Thingsgains importance over time and it is connected to generic approaches as well.
Prediction in Electric Systems
Emission Control Hydroelectricity
Model Predictive Control
Vibration Analysis
Software Maintenance
On-line Monitoring Network
4% > clustersize 4% ≤ clustersize < 8%
8% ≤ clustersize < 12%
12% ≤ clustersize < 16%
16% ≤ clustersize Stochastic Models Nuclear Risks and Safety
Vibration Analysis Predictive Models
Motor Fault Prediction
Wind Turbines Generic Approach
Sensor Data Managing PdM Monitoring
Software Prediction Cable Diagnostics Thermography
Model Predictive Control Cost Based Model
Cloud and IoT Prediction in Electric Systems
Prognostics and Health Management Model Predictive Control
Rolling Bearing Capacitors Corrosion
Multi-Component Systems
Rail Maintenance
Oils
Vibration Analysis
Generic Approach
Software Prediction Thermography
Nuclear Risks and Safety
1990-2000 2000-2008 2008-2016
Figure 12.Research Front Flow Diagram (Color and Font Sizes).
Technique Identification
A final comparison over all three time periods aims to identify the techniques applied in the maintenance approaches. Thereby, for the lead document of each cluster, the used technique is extracted from the abstract and keywords as well as by evaluating the context of the document. In addition, the identified techniques were manually classified into the following four categories:
• Technical. The approach focuses on application-specific technical parameters.
• Stochastic. The approach emphasizes the importance of stochastic issues.
• Generic. The approach deals with adaptive and learning methods.
• Process. The approach focuses on the maintenance lifecycle.
Based on these categories, the identified techniques are visualized in a timeline (cf. Figure13) to obtain further insights. In general, we can observe a dominance of technical approaches. Thereby, most research focuses on concrete machine use cases, whereas general frameworks are less considered.
1990 1995 2000 2005 2010 2015
Technical Stochastic Band Pass Filter
IR Camera Neural Network
Markov Process MPC
Generic Frequency Analysis
Fuzzy Classification
Process AHP
Minimax
SOM Interfirm Nets RCA
FEA
HTC
Analog Signature Analysis Total Productive Maintenance
e-Maintenance ROSE Framework
FA IR Camera MCO
Data-mining CSM Decision Framework
PIDC Genetic Algorithm
Kalman Filtering Corrosion Rate Markov Process Degradation Model
Fuller‘s Earth Dissipation Factor
SVM
MPC Model Predictive Control RCA Root Cause Analysis FEA Finite Element Analysis FA Frequency Analysis HTC Heat Transfer Coefficient CSM Covariance Structure Model
AHP Analytic Hierachy Process IR Infrared
MCO Maintenance Cost Optimization SOM Self Organizing Map
SVM Support Vector Machine
PID Proportional-Integral-Derivative Controller
Figure 13.Timeline of Techniques.
4.2. Predictive Analytics, Reliability-Centered Maintenance, Predictive Analytics, and Smart Maintenance We combine the datasets of four search strings in order to obtain cluster sizes comparable to the ones for search stringspredictive maintenanceandcondition monitoring. The resulting dataset, in turn, contains 2330 items. Concerning countries, similar to the results we obtained forpredictive maintenance, the US is the driving force in this research field, with the Universities of Washington, Illinois and Cincinnati being leading organizations for the time between 1990 and 2016. Please note that the University of Cincinnati was another driving force in the field of predictive maintenance in the period from 2000 to 2008. Finally, Figure14reveals corporations of countries from 2008 to 2016.
cluster 1 2 3 4
Research clusters
Figure 14.Cross-Country Cooperations during 2008–2016.
4.2.1. Period 1990–2000
Analogous to the approach used forpredictive maintenance, research fronts are calculated and evaluated (cf. Table5). If a research field for this evaluated search string was also identified in Section4.1, it gets marked with (1)–(3). The numbers (1)–(3) represent periods. For example, the research fieldsensorsfrom Table5was found in the second period of predictive maintenance, with the following results obtained: First,lean networks (1) deal with the process optimization for maintenance, especially for companies that want apply the method oflean production.Reliability-centered maintenance, in turn, can be frequently found inaircraft(2) applications due to the high safety standards required in this field. Finally, explanations onnuclear power plants(3) andsensors(4) can be already found in Section4.1.
Table 5.Research Front Clusters.
# Lead Document Citations Cluster Label Technique
1 Collaborative Advantage—The art of alliances[46] 274 Lean networks Alliances
2 Reliability centered maintenance [47] 92 Aircraft RCM
3 Optimization of standby safety system maintenance
76 Nuclear Power Plants(1),(3) Dynamic Programming schedules in nuclear power plants [48]
4 Stochastic crack growth analysis methodologies
36 Sensors(2) Crack Growth Analysis
for metallic structures [49]
4.2.2. Period 2000–2008
For the second period, the research fronts are shown in a 3D visualization (cf. Figure15). Figure15 is based on the same calculated data as Figure10(cf. Section4.1). However, the article density, denoted asρ, is represented through the height of the 3D surface plot. Thereby, local peaks in the surface plot represent research fields. The latter, in turn, are partly aggregated to finally form seven research fronts of this period (cf. Table6)). Please note that the results of the search stringsreliability centered maintenanceandsmart maintenancecan be clearly separated.
Smart Maintenance Reliability Centered Maintenance
y x ρ(x,y)
Figure 15.Article Density Surface.
The first cluster revealed is denoted aslean manufacturing(1). It is strongly connected to cluster lean maintenancediscovered in the previous period. Second, a main cluster deals withmaintainable systems(2). Process-oriented approaches, in turn, are collected in cluster lifecycle management(3).
Moreover, clusterscondition-based maintenance(4) andreliability-centered maintenance(5) are considered.
Finally, smart networks (7) often integrate smart sensors in the production lifecycle.
Table 6.Research Front Clusters.
# Lead Document Citations Cluster Label Technique
1 bundles, and performance [50]
475 Lean Manufacturing Lean Manufacturing bundles, and performance [50]
2 The present status of maintenance strategies
116 Maintainable Systems Maintainnable System and the impact of maintenance on reliability [51]
3 Research issues on product lifecycle management
86 Lifecycle management Lifecycle Management and information tracking using smart embedded systems [52]
4 System health monitoring and prognostics—a
85 Condition-based
Health Monitoring review of current paradigms and practices [53] Maintenance
5 Reliability-centered predictive maintenance scheduling
82 Reliability-centered Reliability-centered for a continuously monitored system subject to degradation [54] Maintenance Maintenance 6 Aircraft composites assessment by means
71 Aircraft Non-destructive Testing
of transient thermal NDT [55]
7 Wireless Industrial Monitoring and Control
52 Smart Networks Bluetooth
Using a Smart Sensor Platform [56]
4.2.3. Period 2008–2016
Table7shows the results for this period.Smart meters(1) constitute the first newly discovered research field. These intelligent electronic devices enable two-way communication between meter and production system. Furthermore,Big Data Analysis(3) andData Science(4) are focusing on data analytics. The increasing capabilities of distributed systems increase the potential forautomation systems (4). Finally,total productive maintenance(7) constitutes a method includingkey performance indicators (KPI) for production control.
Table 7.Research Front Clusters.
# Lead Document Citations Cluster Label Technique
1 Smart meters for power grid: Challenges,
issues, advantages and status [57] 87 Smart meters Power Grid
2
Prognostics and health management design for rotary machinery systems-Reviews, methodology and applications [58]
66 Prognostics and Health Management(3)
Prognostics and Health Management 3 Predictive analytics in information systems
research [59] 52 Big Data Analysis Statistical Model
4
Service-Oriented Infrastructure to Support the Deployment of Evolvable Production Systems [60]
47 Automation Systems Web Services
5
Data Science, Predictive Analytics, and Big Data: A Revolution That Will Transform Supply Chain Design and Management [61]
46 Data Science Supply Chain
management
6
Development of an optimized condition-based maintenance system by data fusion and reliability-centered maintenance [62]
44 Reliability-centered
Maintenance Data Fusion
7 In pursuit of implementation patterns: The
context of Lean and Six Sigma [63] 44 Total Productive Maintenance
Total Productive Maintenance 8
Reliability-Centered Maintenance for Wind Turbines Based on Statistical Analysis and Practical Experience [64]
39 Wind Turbine(3) Failure Mode and
Effect Analysis 9 Robust Self-Healing Concrete for
Sustainable Infrastructure [65] 39 Smart Material Self-healing Concrete
10
Intelligent Systems for Improved Reliability and Failure Diagnosis in Distribution Systems [66]
28 Smart Grid Distribution Fault
Anticipation
11
A survey on virtual machine migration and server consolidation frameworks for cloud data centers [67]
27 Cloud Computing(3) VM Migration
12
State of the art review of inspection technologies for condition assessment of water pipes [68]
26 Road Maintenance Non-destructive
Inspection 13 Direct Evaluation of IEC 61850-9-2 Process
Bus Network Performance [69] 12 Circuit Breakers Smart Grids
14 Electrical energy storage systems:
A comparative life cycle cost analysis [70] 11 Energy Systems Monte Carlo
4.3. Condition Monitoring
Papers related to condition monitoring contribute the largest dataset. To allow for a comparability with the other data sets, calculation parameters have to be adapted. To be more precise, the average cluster size is increased to 200, whereas each period of time is limited to one year. Hence, the periods differ from the previously defined ones. Following this approach, twelve research fronts were calculated.
Table8lists the discovered lead documents and techniques for each year. Interestingly, many known research fields from previous Sections could be observed and only two new research fields were discovered at the end: First,data-driven systems(8) enrich production workflows by including data evaluation methods. Second,cyber-physical systems(12) focus on the combination of physical and software components.
4.4. Engineering Asset Management
As we also consider that the revealed maintenance methods should be applicable in the field of Engineering Asset Management, which is not used as a direct search string, we discuss this connection briefly. Therefore, we show connections between revealed papers and this research field using the definition of general asset management functions as presented by the authors in [15]. First,Risk Managementis the process of identifying risks and taking steps to reduce the latter [71]. In case of equipment maintenance, this would be the identification of theRemaining Useful Life(RUL) [72]. It is evident thatCondition Monitoringcan be directly found in our revealed papers, e.g., as shown by [73]. Next, theAsset Usage Life Cycleis of paramount importance and [70] uses this concept for energy storage systems. Moreover, maintenance strategies have a great impact on Performance Measures, as
shown, for example, by the authors of [74]. Finally, IntelligentInformation Systemsenrich maintenance approaches by improving the reliability [66]. In conclusion, our revealed papers cover many parts of the Engineering Asset Management field.
Table 8.Research field and technique of the most cited papers or corresponding clusters 2005–2012.
# Year Lead Document Citations Cluster Label Technique
1 2005 [75] 591 Motor Analysis(2) Motor Current Signature Analysis
2 2006 [76] 936 Prognostics and Health Management(3) Sensor Data Fusion
3 2007 [77] 284 Motor analysis(2) Support Vector Machine
4 2008 [78] 187 Motor analysis(2) Principle Component Analysis
5 2009 [79] 297 Wind Turbines(3) Fault Detection System
6 2010 [80] 375 Sensor-based Systems(2) Wearable Systems
7 2011 [72] 248 Monitoring(2) Remaining Useful Life
8 2012 [81] 380 Data-driven Systems Process Monitoring
9 2013 [82] 90 Thermography(2),(3) IR-Camera
10 2014 [83] 243 Monitoring(2) Data-Driven Approach
11 2015 [84] 243 Monitoring(2) Data-Based Techniques
12 2016 [85] 1 Cyber-physical Systems Adaptive Learning
5. Importance Measure
By collecting all lead documents for each time period, we obtain lists with potentially relevant papers. Please note that the importance of literature entries in these lists is not directly comparable for two reasons. First of all, when judging the importance of a paper, not only the number of its citations should be considered. Additionally, for two papers with same number of citations, their date of publication should be considered as well. For this purpose, we introduce a correction factortcn
(cf. Equation (2)). Second, theciting culturediffers across the various research fields. For example, in economics, the mean number of citations is higher than in computer science. In line with the latter observation, regarding the results of search stringLean Maintenance, we obtain articles with high numbers of citations that mainly focus on management-oriented issues ([46,50]). To reduce these two effects and to express aspects from the bibliometric analysis more properly, we propose an alternative impact measure. (For a general overview of impact measures see [86]).
The first part of the importance measure represents anomalies caused by the different search strings (Predictive Maintenance (PDM), Condition Monitoring (CM), Predictive Analytics (PA), Reliability-centered Maintenance (RCM), Lean Maintenance (LM), and Smart Maintenance (SM)).
Assuming that the search strings differ in their relevance for state of the art equipment maintenance systems, we express their importance on scale from 0 to 1. This factor is denoted astopic neighborhood (tn) assigned to each articlea:
tn(a) =
1.0,a∈ {PDM} 0.7,a∈ {CM}
0.4,a∈ {PA∪RCM∪LM∪SM}
(1)
As opposed to theh-index[36], which cannot decrease over time, we apply a logarithmic reduction (cf . Figure16) for the value of a citation. For example, Figure16shows a decreasing, normalized influence value for 88 fictive citations over a time span of 18 years.
tn = 1 tn = 0,7 tn = 0,4
# years
0 2 4 6 8 10 12 14 16 18
importance
0.1 0.2 0.3 0.5 0.4 0.6 0.7 0.8 0.9 1.0
0.2
Figure 16.Logarithmic Importance Reduction.
Since the bibliometric analysis is based on clustering, it seems to be appropriate to include the relative cluster size(cs) of a cluster c in period pas well. In addition, the averageh-indexof the first and last author will be part of the importance measure to express that literature from authors widely read is very important. Finally, graph-based indicators contribute to the importance measure.
The important papers from a cluster can be identified using thearticle degree, also named as well valency [87]. Besides, according to the graph theory, a cluster can be denoted as a graphG, with each article representing a vertexv, wheredeg(v)is the number of edges incident to the vertex. A second graph unit isbetweenness[88], which constitutes acentrality measure. Betweenness represents the number of shortest paths in the cluster that crossv. Clusters containing a high number of items automatically produce large betweenness values and. Hence, the betweenness needs to be calculated relatively to the cluster size.
In a nutshell, the importance index of an article, suggested by us, considers the following attributes:
• aget[2016-publish year]
• times citedtc
• cluster sizecs
• number of itemsnpin the assigned periodp
• h-indexmean (hi) of the first and last author
• topic neighbourhoodtn
• degreed
• betweennessb
The newly introduced importance measure refers to five different variables (cf. Equation (2)), whereby each term is weighted according to the preferences of the study leader. For our analysis, we stress the importance of the centrality measures. (cf. Equation (3)).
tcn = tc·tn (log(t+1) +1)
,csn =100·cs np
,hn =hi,dn=d,bn = b np
(2) The resulting impact factor for each article is then calculated as follows:
im=0.3·tcn+0.15·csn+0.05·hn+0.25·dn+0.25·bn (3) The impact measures of selected articles and the parameters involved are shown in Table9(all values are normalized), accompanied by the statistical measuresaverage(avg),median(med), and standard deviation(std). Please note that the high weight of the centrality measures leads to top positions for articles showing excellent degree and betweenness values. Exemplarly, we will discuss the first
row of Table9. The paper was cited 53 times and was 5 years old when the collection process took place. It is indirectly connected to maintenances and receives therefore the topic neighbourhood of 0.4.
According to Equation (2), the valuetcnis calculated and is 0.03. This number indicates that this paper is relatively seldom cited among all papers. Next, the paper was revealed as the most important paper in a cluster of size 318 in a period with 1813 entries. This results in a relative cluster size of about 17%
and a normalized value of 0.43. According to Web of Science the h-Index of the first and last author are 17 and 15, which produces a normalzed value of 0.4. Both degree and degreeness are the highest values among all papers and therefore represented by the normalized value 1. Using Equation (3), the final importance measure for this paper is 0.59.
Table 9.Article Ranking Sorted by Importance Measure
# Cite Times Cited Cluster Size H-Index Degree Betweenness Importance
1 [59] 0.03 0.43 0.40 1 1 0.59
2 [89] 0.28 0.05 0.43 0.28 1 0.43
3 [76] 1.00 0.18 0.36 0.18 0.02 0.40
4 [38] 0.07 0.32 0.33 0.18 0.90 0.36
5 [75] 0.62 0.43 0.26 0.32 0.02 0.35
31 [47] 0.89 0.15 0.02 0.31 0.06 0.14
32 [51] 0.05 0.43 0.38 0.15 0.00 0.14
73 [69] 0.01 0.03 0.31 0.14 0.00 0.06
74 [67] 0.02 0.03 0.02 0.14 0.00 0.05
avg 0.1 0.21 0.25 0.21 0.10 0.15
med 0.05 0.18 0.19 0.17 0.03 0.12
std 0.16 0.16 0.21 0.12 0.22 0.10
Finally, two other aspects need to be mentioned. First, the presented ranking can be easily parameterized by changing the values oftnand the used weights. Second, the introduced importance measure is well suited for a complex bibliometric analysis including various research areas.
6. Forecast
We forecast the development of identified research fronts based on the history of scientific and public interest. According to [90],scanningconstitutes a prerequisite of forecasting. Scanning involves
“collecting information: the system, history, and context of the issue [...]”. We collected the required information from our bibliometric analysis. For this forecast, we only include those research fields connected to search stringpredictive maintenance. Thereby, we assume that a higher interest in the topic will result in more publications. Furthermore, we distinguish betweenscientificandpublic interest.
To describe thescientific interest, six research fronts from the period 2008–2016 were chosen and their names were used as new search queries for Web of Science. This period constitutes the latest one and, hence, the most important period for us. From this period, we take six important research fronts and analyze their development over the last 20 years; i.e., according to the published items per year. . This time, we were not interested in extracting literature, but in measuring the published items per year (cf.
Figure17). Interestingly, the development over the last 20 years has shown a significant growth in almost all connected research fields. In particular, the research frontInternet of Thingsis identified to be a potential driving force for publications in the context of predictive maintenance.
IoT Vibration Analysis
Thermography Software Maintenance
Wind turbines
Nuclear Plants
1995-2015 1995-2015 1995-2015
published items per yearpublished items per year
1000 1000
Figure 17.Published Items Per Year.
As an indicator forpublic interest, we choose the Google trend analysis. (https://www.google.
de/trends/explore) Interest, as measured by Google searches, is visualized in a normalized form for the period from 2004 to 2017 (cf. Figure18). The topicInternet of Thingsgrew significantly during the last years. The greatest difference between scientific and public interest can be observed in the graphs related tosoftware maintenance. Please note that the Fukushima Daiichi nuclear disaster in March 2001 distorts the graph fornuclear power plants. The public interest was enormous due to this event, causing a peak in the graph.
Wind turbines Internet of Things
Vibration Analysis Software Maintenance
Thermography
Nuclear Plants
Jan 2004 Jan 2017
100 %
0 % 100 %
0 % 100 %
0 % 100 %
0 % 100 %
0 % 100 %
0 %
Figure 18.Google Trend Visualization.
Furthermore, we link upcoming developments in the field of predictive maintenance to the development of theInternet of Things. Three aspects are of particular interest in this context:
• Algorithm Development. Current success stories ondeep learninghave not affected research yet.
In particular, neural networks were used in all periods. Please note that the introduction of