Academic Performance of Students with the Highest and Mediocre School-leaving Grades: Does the Aptitude Test for Medical Studies (TMS) Balance Their Prognoses?
Abstract
Background:Admission to undergraduate medical training in Germany occurs by central and local pathways. Central admission includes two
Guni Kadmon
1Martina Kadmon
2distinct groups: Students with top school-leaving grades (best-SLG group) and students with inferior school-leaving grades who are admitted with
a delay of up to seven years (delayed admission group). Students with 1 Heidelberg University, Medical Faculty, Heidelberg, Germany
academic difficulties and early dropouts are present in both groups.
Local admission at our university involves the German Test for Medical Studies (TMS) and allows the admission by merit of students with a wide range of school-leaving grades.
2 Carl-von-Ossietzky-University of Oldenburg, Faculty of Medicine and Health Aims:To examine the justification of a TMS-based strategy to reduce
the admission of potentially weak best school-leavers and enhance the Sciences, Oldenburg, Germany
admission of potentially able candidates with mediocre school-leaving grades.
Method:The prognostic contribution of the school-leaving (SL) GPA and the TMS to academic performance and to continuity in the pre-clinical part of the undergraduate medical program was examined in two study groups: best school leavers (SL grade 1.0, SL-GPA 823-900 points) and mediocre school leavers (SL grades 2.0-2.3, SL-GPA 689-660 points).
The outcomes in both groups were compared in relation to their TMS results. The prospective study included four consecutive cohorts.
Results:In each study group the TMS predicted the academic perform- ance (β=0.442-0.446) and the continuity of studies (OR=0.890-0.853) better than the SL-GPA (β=0.238-0.047; OR=1.009-0.998). Attrition was most strongly associated with failing to take the TMS (OR=0.230- 0.380). Mediocre school leavers with TMS scores ≥125 performed as well as the best school leavers. Mediocre school leavers with TMS scores between 110-124 performed on average less well but within the required standards. Best school leavers with mediocre TMS scores and 30% of the best school leavers who hadn't taken the TMS performed less well than most mediocre school leavers with high TMS scores.
Discussion:The TMS appears to differentiate between potentially suc- cessful and less successful students in both GPA categories. Mediocre school leavers (SLG 2.0-2.3) with exceptionally high TMS results reach better pre-clinical examination results than best school leavers (SLG 1.0) with mediocre TMS results. Thus, the present data justify the use of the TMS to facilitate the participation of mediocre school leavers in the competition for admission slots.
Keywords:student admission, undergraduate medical training, aptitude, test for medical studies, TMS, school-leaving GPA
Introduction
The academic performance at the secondary education or pre-university college level is generally considered as the strongest indicator for academic merit in tertiary education. The prognostic validity of school-leaving grades for academic performance in undergraduate medical training may vary between institutions and curricular years
[1] but it often exceeds 0.3 and even 0.5. [2], [3], [4], [5].
Strong prognostic validity of school-leaving grades has also been documented for other academic courses [4], [6] as well as for non-academic professions [7]. For this reason, school-leaving grades are utilised worldwide as the major yardstick of merit in the admission or pre-selec- tion to medical school.
In Germany, about 10% of the medical school admission slots are allocated to legally defined privileged applicants.
Of the remaining admission slots up to 20% are centrally allocated to applicants with top school-leaving grades ("best-SLG group"). Another 20% are reserved for applic- ants with inferior school-leaving grades who are admitted centrally with a delay of up to seven years ("delayed ad- mission group"). Approximately 50% of the medical stu- dents are locally admitted by the selection criteria of the individual university, whereby the school-leaving grade must by law carry substantial weight in the admission decision (local admission group).
The dominant role of the school-leaving grade in the ad- mission to medical school has in recent years increasingly become a matter of discussion. Admission by school- leaving grades tends to result in homogeneous student bodies [8], [9] and to discriminate against multiple groups of applicants including graduates from public schools, applicants from socioeconomic and educationally de- prived backgrounds [10], [11] and male school leavers [12], [13]. Moreover, school-leaving grades do not neces- sarily reflect non-cognitive qualities that are important for patient-centred medical practice.
A broad spectrum of additional, cognitive as well as non- cognitive admission instruments has been developed to accommodate for the shortcomings of the school-leaving grades as an admission instrument. The cognitive admis- sion instruments include general intelligence tests such as the SAT in the USA [14], SweSAT in Sweden [15], and the psychometric test in Israel [16], scientific knowledge tests such as the BMAT in Britain [17] and the Ham-Nat in Germany [18], and special aptitude tests for medical studies such as the MCAT in the USA [19], the UMAT in Australia [20], UKAT in Britain [21], and the Aptitude Test for Medical Studies (TMS) in Germany [22], [23] and Switzerland (EMS, [24]). Non-cognitive instruments includ- ing interviews [5], [25], [26], motivational essays [5], personal qualities assessment (PQA) [27], [28], and psy- chological tests [29] are also employed but generally lack reliable prognostic values for performance in medical school. However, instruments that depict a limited spec- trum of non-cognitive traits may be of prognostic relev- ance with respect to specific competencies, examination types, or course formats [30], [31].
In view of the prognostic insecurity of non-cognitive ad- mission instruments Brown and Lilford [32] recommended limiting student selection to cognitive instruments. Con- ceivably, applicants with different school-leaving grades reflecting different school histories may demonstrate similar aptitude for medical studies by alternative cognit- ive admission instruments. Such applicant cohorts may represent a wider range of interests and competencies than applicants with a uniform school-leaving grade. On the basis of this rationale our faculty developed a com- pensatory admission procedure that is primarily based on the school-leaving GPA and the TMS score. To this end a ranking formula was used that is given in the methods section.
The TMS is composed and administered once yearly by ITB Consulting®LTD. It comprises nine parts, takes ap- proximately 5 hours and 10 minutes, and does not require prior academic knowledge. In a slightly different form it is also used in Switzerland (EMS, [24], [33]). Four parts test scientific and mathematical thinking as well as text and data comprehension. The scores achieved in these parts correlate moderately (r=0.33) with the school- leaving GPA [22]. The remaining five parts test visual cognition, pattern analysis, graphic and verbal memory.
These parts do not substantially correlate with the school- leaving GPA (r=0.16) [22]. The scores achieved in the test are standardised each year with mean 100 and standard deviation 10. Preparation for the test is benefi- cial to the result [34], suggesting that it might also reflect motivation.
The advantage of assessing applicants who are weak in one instrument also by an alternative instrument which may better reflect their aptitude has been discussed [35], [36]. The compensatory ranking formula enables poten- tially able applicants to compensate for poor school- leaving grades by strength in the TMS as an additional measure of merit.
In an earlier study [2] it has been observed that some students of the best-SLG group have academic difficulties in undergraduate medical training whereas some students with mediocre school-leaving grades reach high levels of performance. However, students with mediocre school- leaving grades normally are admitted to medical school with several years’ delay and tend to withdraw from the course pre-maturely due to age-related factors. These observations are supported by the experience that the introduction of the Medical College Admission (Moss) Test (MCAT) in the USA resulted in improved prediction of academic performance, drastically reduced attrition [37], and increased diversity of students by race and re- ligion [38]; the BioMedical Admissions Test (BMAT) better predicts academic success of candidates from low ranking schools than personal statements [39], and veterinary students may become good veterinary doctors despite having inferior school leaving grades [40]. We therefore suggested that potentially able applicants with mediocre school-leaving grades should be given the chance to compete for study places within the regular admission procedure at the expense of applicants with top school- leaving grades but lower potential for academic success [2]. The present work aims at examining whether the compensatory admission procedure described above can identify best school-leavers with low potential and me- diocre school-leavers with high potential for success in the undergraduate medical program. To this end the academic performance and continuity of the students of the central admission groups, the best-SLG group and the delayed admission group, were compared to the performance and continuity of the locally admitted stu- dents with the corresponding school-leaving grades. The differential predictive values of the school-leaving grade and the TMS for academic performance and continuity
of studies were statistically elucidated. The work focused in three consecutive studies on the following questions:
• Study 1: Does the TMS help to predict the differential academic performance and continuity of students that have the best school-leaving grade 1.0 (best school leavers)?
• Study 2: Does the TMS help to predict the differential academic performance and continuity of students whose school-leaving grades are on the level of the national average (2.0-2.3 – mediocre school-leavers)?
• Study 3: Do students with mediocre school-leaving grades but high TMS scores reach levels of academic performance that justify their inclusion in the primary competition for admission slots?
Methods
Participants and inclusion criteria
The participants were medical students of the Heidelberg Medical Faculty of Heidelberg University who enrolled in 2009, 2010, 2011, and 2012. Included were:
• All students with grade 1.0 in the German school- leaving certificate (“Abitur”).
• All students having German school-leaving grades 2.0- 2.3.
Exclusion criteria
Excluded from the study were students with foreign school-leaving certificates and students admitted by dif- ferent pathways than the regular admission procedure (priority admissions, cases of hardship, second-degree students, admissions by lawsuit). Students who hadn't taken the TMS were excluded from analyses involving the TMS score. They were included in comparisons between the students who had taken the TMS and those who hadn't taken it.
Data recruitment and data protection
The study was performed in connection with the quality management of the admission procedure of the Heidel- berg Medical Faculty. Birth dates, registration and de-re- gistration dates, examination results, and the date of passing the first part of the Medical Licensing Examina- tion (M1) were retrieved from the data bank of the faculty.
The school-leaving grades of the locally admitted students were retrieved from their application files. The school- leaving grades of the centrally admitted students were reported by the Foundation for Higher Education Admis- sions (SfH). The data were tabulated in MS Excel®and anonymised prior to their analysis by removal of the columns that contained personal data except for age and gender. The work was approved by the ethics committee of the medical faculty (file #S-440/2009).
Assessment scales
School-leaving-GPA:It ranges from 240 points (pass) to 840 points or 300 (pass) to 900 points. The 840 point scale was converted to the 900 point scale when used.
The two scales have been used in different years and are still differently used by different German federal states.
School-leaving grade:The school-leaving GPA is officially converted to the school-leaving grade on the scale of 1.0 - 6.0 (1.0=best, 4.0=pass). The GPA scores corresponding to Grades 1.0, 2.0-2.3 are given in Table 1.
Standardised TMS score:0-135 points, mean=100 points, SD=10 points. The TMS scores were divided into seven categories with the following score ranges: (1) ≥125, (2) 120-124, (3) 117-119, (4) 114-116, (5) 110-113, (6) 106-109, (7) ≤105. Wider TMS score intervals were chosen for the marginal categories (1,2,6,7) in ordert to increase the sample sizes of rare cases. Rare cases were included in the analysis since they were in the focus of interest with respect to the research questions. An eighth category was defined as the absence of TMS results.
Weighted compensatory ranking formula: The compens- atory local admission procedure was based on the follow- ing ranking formula, whereby only better than average TMS scores were considered:
where RP=ranking points, GPA=school-leaving GPA, GPAMax=840 or 900 points depending on the respective GPA scale, TMS=standardised TMS score, =mean standardised TMS score (100), TMSMax=130, Bonus=max- imally 10 percent points for additional criteria. Since only few students qualified for bonus points the bonus was neglected in the present study.
Faculty examination results:The examinations included the chemistry exam of the first semester, the physics, human genetics, and the integrated exams (anatomy, physiology and biochemistry) of the second, third, and fourth semesters. Different point scales were transformed to the percent scale (100%=highest possible score in a given examination, 60%=pass). The arithmetic mean of the transformed pre-clinical examination results was defined as the mean pre-clinical grade and regarded as a measure for academic performance.
The analysis of the students’ performance was based on the results of their first try at each examination. It was assumed that the first try better reflects the actual learning performance than the repetition of failed exam- inations. Passing the examinations is an obligatory condi- tion for taking the M1 examination, but the time point for taking some examinations is flexible.
Continuity of studies was analysed as passing the first part of the Medical Examination (M1) in the prescribed time of four semesters (regular continuity), at a later stage (prolonged studies), or withdrawing from the program prior to the M1 examination (dropout).
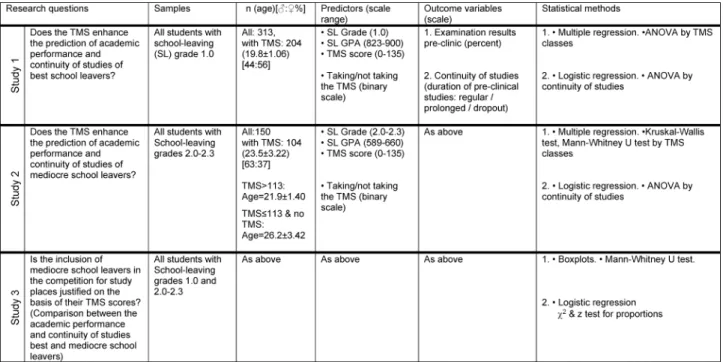
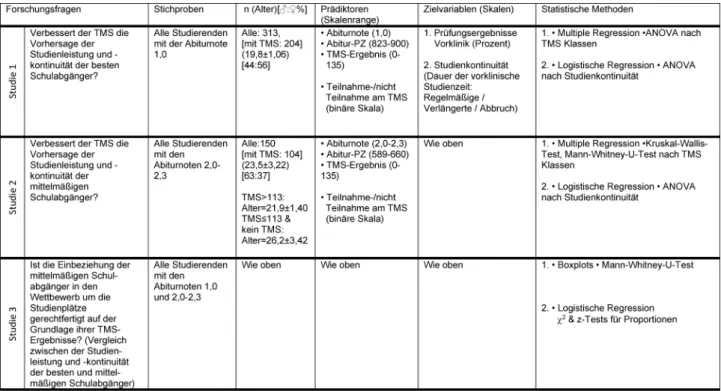
Table 1: Study design
Admission criteria
The admission criteria for the different admission groups were:
• Central admission:
1. SLG-best group– School-leaving grade (almost exclus- ively grade 1.0).
2. Delayed admission group– waiting time by number of semesters. (Applicants who do not comply with the regular admission criteria but are entitled to a study place by the constitutional freedom of occupational choice. They are admitted with a delay of up to seven years after leaving school.)
3. Local admission– school-leaving GPA with pre-selec- tion cut-off at GPA 589 (grade 2.3), above-average TMS score (>100) and additional “bonus criteria”
(vocational training and professional experience in medicine-related fields, success in education-related competitions, and voluntary social service). The ap- plicants were ranked by the formula given above.
Study design
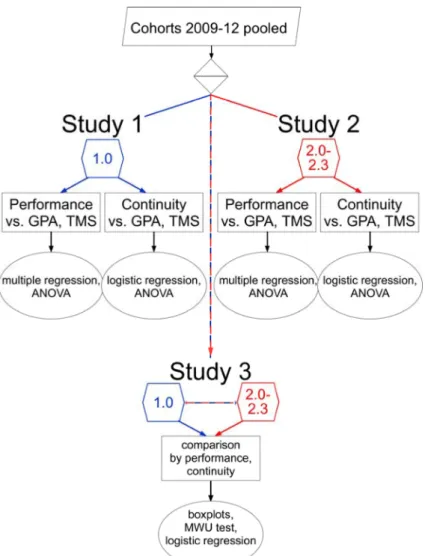
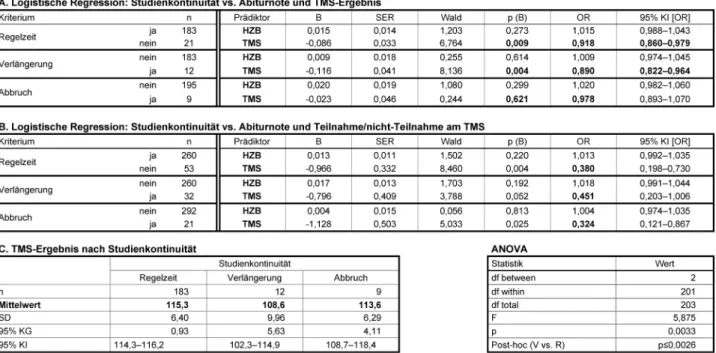
The study design is summarised in Figure 1 and table 1.
The investigation included two study groups: students with the school-leaving grade 1.0 (best school leavers) and students with the school-leaving grades 2.0-2.3 (mediocre school leavers). For each study group the data of the students that had matriculated between 2009 and 2012 by the different admission procedures were pooled.
The data included the school-leaving GPA, the TMS score, the faculty examination results and the continuity of studies.
The investigation was divided in three studies. Study 1 included the best school leavers and study 2 included
the mediocre school leavers. In each of these two studies the relationship between the mean pre-clinical grades and the predictors school-leaving GPA and TMS score as well as between continuity of studies and these predictors was analysed. Additionally, the relationship between the outcome variables (mean pre-clinical grade, continuity of studies) and taking or not taking the TMS was also ana- lysed. In study 3 the outcome variables of the two study groups were compared with respect to the given predict- ors. The study groups were examined in toto as well as in subgroups by TMS categories as defined above.
Statistical methods
The predictive values of the school-leaving grade and of the TMS score for academic performance were examined by multiple linear regression as well as by ANOVA by TMS categories. ANOVAs were followed post-hoc by Bonferroni or non-parametric (Mann-Whitney U) tests. The predictive values of the school-leaving grade and the TMS score for continuity was examined by logistic regression. The pos- sible risk for academic performance and for continuity by not taking the TMS was also examined by logistic re- gression. The mean TMS scores by continuity of studies were compared by ANOVA. In study 3 the academic per- formance of the two groups was compared in relation to their TMS results. To this end the TMS results were cat- egorised as described above. The proportions of students of the two study groups who completed the pre-clinical part of the program in the prescribed time, after a delay, or dropped out were compared by χ2test for proportions.
The proportion of students who had taken (or not taken) the TMS was compared among the subgroups by continu- ity (regular continuity, prolonged studies, dropout) using the z test for proportions.
Figure 1:Flow chart of the study design. Study 1 and study 2 examine the academic performance and the continuity of studies of the students with the school-leaving grades 1.0 and 2.0-2.3, respectively, in the pre-clinical part of the medical course. The
performance and the continuity of both groups are compared in the third study.
Basic statistics, distribution analyses, multiple linear and logistic regression analyses, Pearson correlations, confid- ence interval determinations, ANOVA, Kruskal-Wallis H test, Mann-Whitney U test, χ2test, z-test for proportions and Boxplots were performed in IBM SPSS®21. Holm- Bonferroni correction for multiple comparisons was per- formed on an Excel®template by Justin Gaetano [https:/
/www.researchgate.net/publication/236969037_
Holm-Bonferroni_Sequential_Correction_An_EXCEL_
Calculator]. Participants with missing data were omitted from the respective analysis. SPSS output was exported to MS Excel®. Graphics were generated in Excel and fin- ished in Canvas®10 (ACD Systems).
Results
Study 1: Best school leavers (school-leaving grade 1.0)
Dependence of academic performance on GPA and TMS score
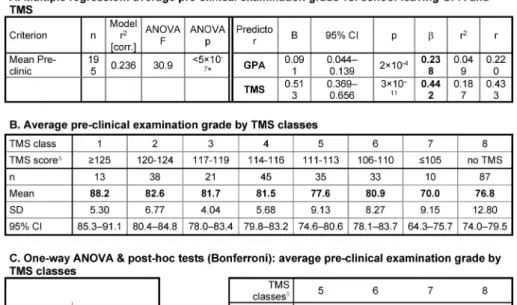
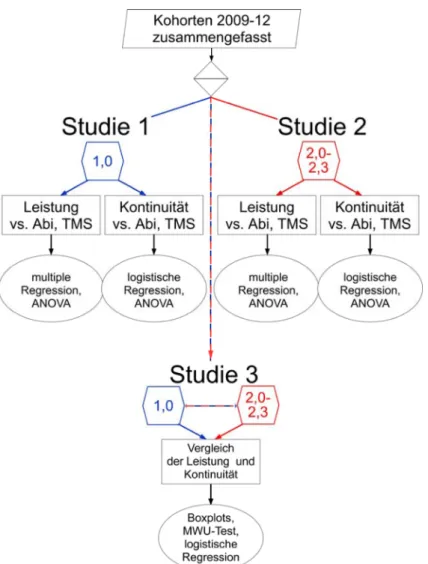
By multiple linear regression analysis both the school- leaving GPA and the TMS score contribute to the predic- tion of the mean pre-clinical examination result of the best school leavers. However, the predictive contribution of the school-leaving GPA (β=0.238) was weaker than the predictive value of the TMS (β=0.442; see Table 2, Point A). Sub-grouping the best school leavers by their TMS scores revealed two outstanding subgroups with respect to their academic performance (see Table 2, Points B and C). The one subgroup included students with TMS scores ≥125. TMS scores ≥125 are at least 2.5 standard deviations better than the mean score of all TMS participants. These students reached mean pre- clinical examination results that were significantly or nearly significantly better than examination results of the
Table 2: Relationship between academic performance, school-leaving GPA, and TMS score among students with the school-leaving grade 1.0
subgroups with lower TMS scores. The other subgroup included the students with TMS scores ≤105, that is, around the mean score of all TMS participants. Their mean pre-clinical examination results were significantly worse than those of most other subgroups. The students who had not taken the TMS also reached on average rel- atively low examination results (see Table 2, Point B). The mean pre-clinical examination results of the remaining subgroups with TMS scores between 106 and 124 did not differ significantly.
Dependence of continuity of studies on GPA and TMS score
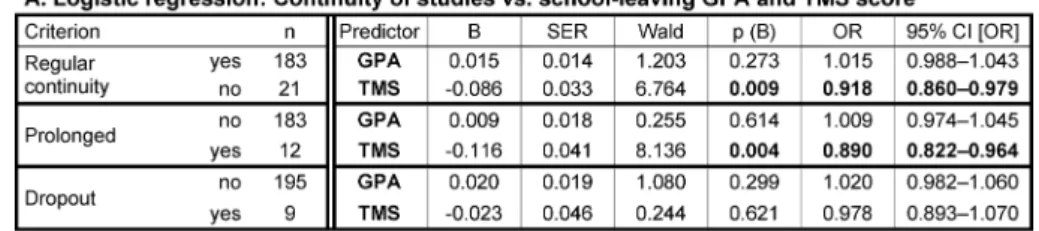
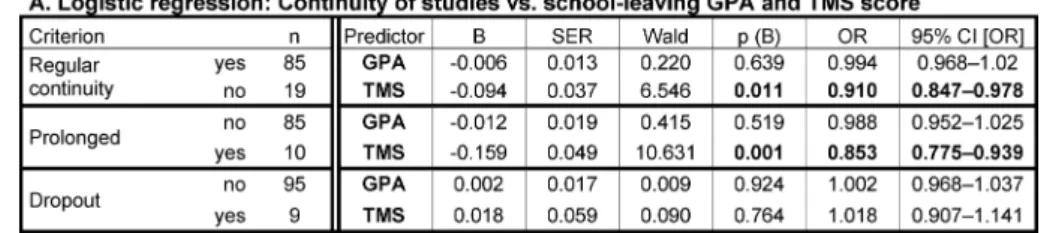
By logistic regression, the best school leavers' risk of prolonging their pre-clinical studies and the risk of drop- ping out of the course were not related to the school- leaving GPA (see Table 3, Point A). In contrast, lower TMS scores significantly predicted the prolongation of the studies albeit with an odds ratio of only 0.89 (see Table 3, Point A; OR<1 denotes the chance of not prolonging the studies). The odds ratio was possibly weak due to the small number of students who had taken the TMS and withdrew from the program. The students who prolonged their studies had significantly lower TMS scores than students who completed the pre-clinical part of the pro- gram in the prescribed time (see Table 3, Point C).
A higher risk for prolonging the studies and for dropout was detected among the best school-leavers who had
not taken the TMS as compared to those who had taken the TMS (OR 0.324 and 0.451, respectively; see Table 3, Point B). The majority (82 out of 97) of the best school leavers who had not taken the TMS belonged to the centrally admitted SLG-Best group. Thirteen had been admitted otherwise and were older at enrolment.
Study 2: Mediocre school leavers (school-leaving grades 2.0-2.3)
Dependence of academic performance on GPA and TMS score
Multiple linear regression analysis did not reveal an asso- ciation between the school-leaving GPAs of the mediocre school leavers and their mean pre-clinical examination grades (β=0.047, ns). In contrast, their TMS scores ap- peared to predict their pre-clinical performance similarly to the group of the best school leavers (β=0.446; see Table 4, Point A). The GPA ranges of both groups were similar (see Table 1), whereas the range of the TMS scores of most mediocre school leavers was more restric- ted – 74% were within 8 score points, 117-124 (see Table 4, Point B). Therefore, their regression was possibly more strongly susceptible to outliers.
Upon sub-grouping the mediocre school leavers by TMS scores a downward gradient of academic performance with decreasing TMS scores appeared as a general trend (see Table 4, Point B). However, the differences between
Table 3: Relationship between continuity of studies, school-leaving GPA, and TMS score among students with the school-leaving grade 1.0
Table 4: Relationship between academic performance, school-leaving GPA, and TMS score among students with the school-leaving grades 2.0-2.3
the mean pre-clinical grades of the different subgroups were with the exceptions described below not significant (see Table 4, Point C), possibly due to the small size of most subgroups.
The mean pre-clinical grades of the subgroups with TMS scores ≤105 and with no TMS result were significantly
lower than in most other subgroups and were close to the "pass" mark of 60% (see Table 4, Points B and C).
This outcome is more difficult to relate to the gradient in TMS scores than in the group of the best school leavers, since the mediocre school leavers with TMS scores <113 or no TMS belonged to the delayed admission group. They
were several years older at enrolment than the rest of the students (see Table 1).
Dependence of the continuity of studies on GPA and TMS score
The statistical relationship between the continuity of studies of the mediocre school leavers and their school- leaving GPAs and TMS scores was similar to the one ob- served in the group of the best school leavers. By logistic regression dropout was not related to the TMS score whereas the risk of study prolongation by low TMS scores was determined at an odds ratio of 0.85 (see Table 5, Point A). Also, the TMS scores of the mediocre school leavers who prolonged their studies were much lower than those of the mediocre school leavers who did not prolong their studies or withdrew from the program (see Table 5, Point C). Similarly as observed among the best school leavers, the highest risk for prolonging the studies and for dropout was associated with not having taken the TMS (see Table 5, Point B). As pointed out above, the interpretation of these observations is limited by the age difference between the mediocre school leavers with TMS scores <113 or no TMS and the mediocre school leavers with better TMS scores.
Study 3: Mediocre vs. best school leavers
Academic performance by TMS categories
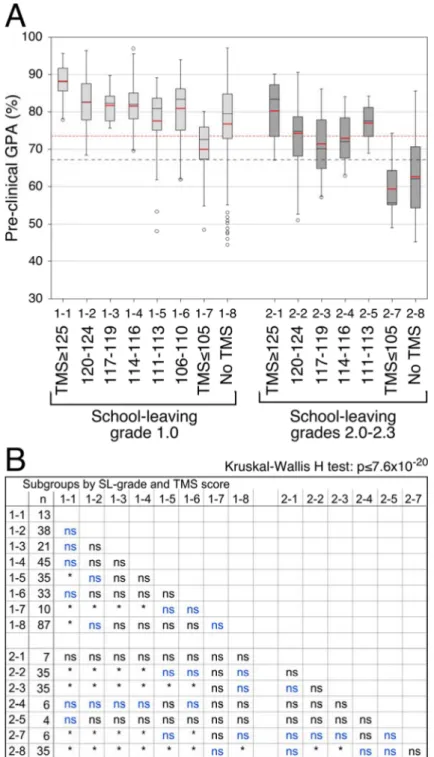
Generally, the mediocre school leavers tended to perform less well than the best school leavers who had taken the TMS (see Figure 2, Point A). The differences were only partly significant (see Figure 2, Point B), possibly due to the small size of most subgroups of the mediocre school leavers. In both study groups the students with exception- ally high TMS scores (≥125) performed better than the rest of their respective group members and the students with mediocre TMS scores (≤105) performed less well than the rest of their respective group (see Figure 2, Points A and B). The academic performance of the best school leavers with TMS scores between 106 and 124 was on average relatively uniform at a level of mean pre- clinical grades around 82% (see Figure 2, Point A). A similar level of academic performance was achieved by the mediocre school leavers with TMS scores ≥125. Their pre-clinical grades did not differ significantly from those of the best school leavers including those with TMS scores
≥125. However, due to the small size of the subgroups with TMS scores ≥125 true differences may have been masked by type II error. The mediocre school leavers with TMS scores between 117 and 124 performed, on aver- age, significantly less well than the majority of the best school leavers who had taken the TMS (see Figure 2, Points A and B). Yet, they performed clearly better than the minimal required standard of 60% ("pass"). Mediocre school leavers with TMS scores below 117 were too rare for drawing clear conclusions about them.
The academic performance of the mediocre school leav- ers in the pre-clinical examinations was also compared to that of the best school leavers who had not taken the TMS. The differences were not significant. This finding is especially meaningful with respect to the mediocre school leavers with TMS scores ≥117 whose subgroups were large enough for reliable comparisons (see Figure 2, Points A and B). In fact, the mean performance of 27 best school leavers without TMS (31%) was lower in the pre- clinical examinations than the mean performance of the mediocre school leavers with TMS scores >105. Further- more, 18 of the former (20%) performed less well than the 25 percentile of the latter (see Figure 2, Point A).
Among the best school leavers with TMS scores ≤116 24% performed less well than the mean and 9% per- formed less well than the 25 percentile of the mediocre school leavers with TMS scores >105 (see Figure 2, Point A).
Continuity of studies
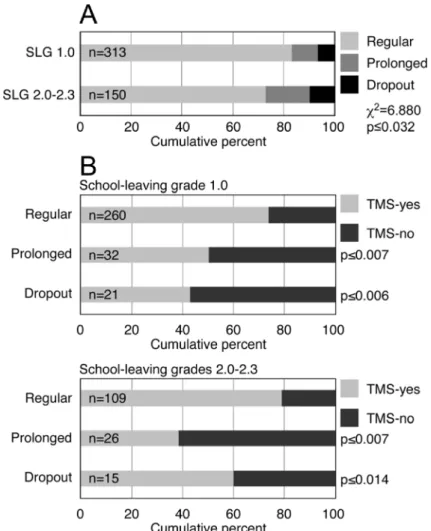
Similar proportions of students of both study groups, the best and the mediocre school leavers, completed the pre- clinical program. However, approximately 10% more best school leavers (83.1%) than mediocre school leavers (72.7%) completed it in the prescribed time (see Figure 3, Point A). In both groups the majority of students who completed the pre-medical program in the prescribed time had taken the TMS. Conversely, 40-60% of the stu- dents who prolonged their studies or dropped out had not taken the TMS (see Figure 3, Point B).
The two study groups, the best and the mediocre school leavers, were pooled together for further analysis. The range of the school-leaving GPAs was larger in the pooled sample than in each study group alone. Yet, logistic re- gression indicated that also in the pooled sample the school-leaving GPA only marginally affected the prolong- ation of the studies or the withdrawal from the program if at all (see Table 6). The TMS scores (see Table 6, Point A) and not having taken the TMS (see Table 6, Point B) represented similar risk potentials for attrition as separ- ately observed in each study group (compare to Table 3 and table 5).
Discussion
The present study explores the possibility of having excel- lent students who had left school with poor grades and having unsuccessful students who had excelled in sec- ondary education. Clearly, it would be desirable to identify the applicants who occupy these "tails of the probability distribution" already during the admission process. It can be expected that students with varying school histories may contribute substantially to the di- versity of the student body [41]. To accomplish this, a selection instrument must be employed that can detect potentially unsuccessful best school leavers and poten- tially successful mediocre school leavers. The ability of
Table 5: Relationship between continuity of studies, school-leaving GPA, and TMS score among students with the school-leaving grades 2.0-2.3
the TMS to fulfil this function was examined in the present work.
Prognostic values of the school leaving GPA and the TMS for academic performance and continuity of best and mediocre school leavers (studies 1 & 2)
Academic performance:Differences in academic perform- ance were weakly related to GPA differences among the best school leavers and unrelated to the GPA among the mediocre school leavers. Moreover, attrition – prolonga- tion of the studies and dropout – was also unrelated to the school leaving GPA. The range of the school-leaving GPA was similar in both study groups, just above 70 points. This range comprises only a fraction of the com- plete scale of GPA scores. Thus, the observed absence of a (clear) relationship between the outcome variables and the school-leaving GPA may be restricted to the study groups and cannot be generalised at this stage.
The TMS, on the other hand, predicted the academic performance in both study groups with β values above 0.4. Upon closer inspection, in each group the mean academic performance of students with TMS results between one and 2.5 standard deviations above the mean score of all TMS participants was relatively uniform.
The best school leavers having TMS scores within this range reached on average better examination grades than the corresponding mediocre school leavers. Never- theless, the examination grades of the latter subgroups were on average also well above 60%, the required "pass"
level.
Exceptions to this general trend were observed in the marginal subgroups having either exceptionally high (better than 2.5 SD above the mean) or mediocre TMS results. In each study group the subgroup with exception- ally high TMS scores reached better mean examination grades than the remaining subgroups. This was most conspicuous in the group of the mediocre school leavers, although due to the small size of this subgroup the ob- served advantage was not statistically significant. The subgroups with TMS scores around 100, the mean of all TMS participants, performed significantly less well in the pre-clinical examinations than their fellow students with better TMS results. This observation is especially mean- ingful with respect to the best school leavers, since their subgroups did not differ in age. In the group of the me- diocre school leavers, age is a latent variable that must be considered in the interpretation of the results.
Continuity of studies:In both study groups the TMS was also a predictor of study prolongation. This result can be expected, since the prolongation of the pre-clinical period is often associated with academic difficulties [2]. Interest- ingly, the binary variable, "taking/not taking" the TMS, emerged in both study groups as the strongest predictor for both study prolongation and dropout. Therefore, future investigations should examine whether taking the TMS reflects motivation and identification with the chosen course of studies, and whether failing to take it might be associated with reduced motivation and endurance.
Mediocre vs. best school leavers (study 3)
The comparison of the two groups revealed three relevant phenomena:
Figure 2:Academic performance by school-leaving grade and TMS score. A. Boxplots by TMS categories. The subgroups are denoted by a group number (1 or 2) and a subgroup number (1 to 8). The mean values are superimposed in red. Red and black
broken lines: Mean and 25 percentile, respectively, of the performance of the mediocre school leavers with TMS>105. B.
Kruskal-Wallis H test with pairwise post-hoc comparisons by Mann-Whitney U test with global α=0.05 and Holm-Bonferroni correction for multiple comparisons. *Significant at α=0.05; (n) number of cases; (ns) not significant; (blue print) significant
prior to the Holm-Bonferroni correction.
1. The mediocre school leavers with exceptionally high TMS scores performed in the pre-clinical examinations on average similarly well as the best school leavers with high TMS scores.
2. Quite a few best school leavers without TMS particip- ation and with TMS results below 117 performed less well than many mediocre school leavers.
3. Differences in GPA could not explain the attrition even upon pooling the school-leaving GPAs of both study
groups, whereas the TMS score did predict the attri- tion.
The prognostic risk for attrition was associated most strongly with not having taken the TMS.
The results indicate that the admission to medical school of mediocre school leavers with exceptionally high TMS results is fully justified. Moreover, it is questionable whether the a priori exclusion of such applicants from the primary competition for admission slots by faculties that do not employ compensatory admission instruments
Figure 3:Continuity of studies of best and mediocre school leavers. A. Proportional distribution of the students who completed the pre-clinical program in the prescribed time (Regular) or later (Prolonged) or who withdrew from the program (Dropout) in the two study groups. (SLG) School-leaving grade. The distributions of both study groups were compared by χ2test. B. Proportional distribution of the students who had taken the TMS (TMS-yes) or had not taken it (TMS-no) among the students who completed the pre-clinical program in the regular time, prolonged their studies or who dropped out. (p) The proportions of the students who had not taken the TMS among those who had prolonged their studies or dropped out were compared by z-test for proportions
to the equivalent proportion among the students who had completed their pre-clinical studies in the regular time.
Table 6: Logistic regression analysis of the relationship between continuity of studies and the school-leaving GPA and the TMS score in the pooled sample of best and mediocre school leavers.
would be appropriate. The present findings also indicate that even the admission of mediocre school leavers with better TMS scores than one standard deviation above the mean of all TMS participants is more reasonable than
the admission of best school leavers with mediocre TMS results. Our experience is that they are likely to enrich the diversity of the student body [41] and level out aca-
demically with the best school leavers in the clinical part of the program [2].
Taken together, the present findings confirm the need for public discussion about the obligatory attribution of priority weight to the school-leaving grade in the admis- sion decision as required by German law.
Advantage of voluntary admission tests
The assumption that taking the TMS may reflect motiva- tion, identification, and endurance must await future verification. However, the current observations appear to support the importance of offering the TMS and per- haps any comparable admission test on a voluntary basis as an indicator of potential continuity and attrition.
TMS credits in other German universities
The majority of the German medical faculties that acknow- ledge the TMS result in their admission procedure con- sider the TMS on an additive rather than a compensatory basis. They attribute a uniform credit to either the TMS equivalent grade 1.0 or to TMS percentile rank values
≥90. The TMS equivalent grade 1.0 includes in different years all TMS scores above 116 or above 117. The per- centile rank value 90 encompasses the TMS scores above approximately 112. Consequently, exceptionally high TMS scores have no advantage, success in the TMS has a rel- atively small incremental effect on the admission de- cision, and applicants with school-leaving grades above approximately 1.8 are excluded from the competition for study places [42].
Demographic considerations
Demographic data of the students except for age and gender were not documented in the data bank of the faculty due to the data protection regulations as they are not relevant to the admission procedure. The age distri- bution of the students of the different admission groups has been published [2]. So far, we have not detected gender differences in performance and attrition in our faculty [2], and only minor gender differences in course evaluation have been found [43]. For these reasons and in order to avoid further sample fragmentation analysis by gender has not been performed in the present study.
Limitations of the study
The interpretation of the results is limited by a number of confounders as listed below. Most notably, the small size of the marginal subgroups of interest, the best school leavers with mediocre TMS scores and the mediocre school leavers with exceptionally high TMS scores, re- stricts the confidence in the generalizability of the find- ings. The association between the school-leaving grades and the age at matriculation as well as between taking or not taking the TMS and age may further limits the in- terpretation of the findings. The large number of possible
examination dates available to the students renders the analysis of the sources of variance in a nested set-up impractical. The results must, therefore, be regarded as observations that pose questions to further generalising work, especially concerning the marginal subgroups.
Confounders and sources of bias
• Age: Due to the delayed admission procedure the school-leaving GPA scale and, partly, taking or not taking the TMS are linked to the age at enrolment. Age is a strong predictor for dropout, less so for academic performance [2].
• Variance restriction: The analyses focused on groups of the student cohorts that represent selected seg- ments of the school-leaving GPA scale. They were fur- ther divided by TMS categories into subgroups that in part were very small. Consequently, the interpretation of the findings may be limited by variance restriction.
• Statistical errors: Due to variance restriction type I and type II errors possibly limit the reliability of the results.
• Examination results: Latent factors affecting academic performance such as health condition, personal and familial difficulties, exam anxiety, variations in examin- ation severity, had not been documented and were neglected in the analysis.
Conclusions
Advantage in admission should ideally be given to applic- ants who are likely to succeed in the course over those who potentially would fail to reach the desired level of performance regardless of their respective school histor- ies. Moreover, it makes little sense to curtail the coping potential of potentially successful, consistent students by deferring their admission by several years only because top grades were not their top priority at high school. The present data indicate that a compensatory admission procedure involving the TMS should be considered for balancing the required substantial weight of the school- leaving grade in the assessment of potential academic aptitude.
Acknowledgements
The authors wish to thank Martina Damaschke and Dr.
Ariunaa Batsaikhan for their patient assistance in retriev- ing examination results and tabulating the data. They are also grateful to Dr. Janine Kahmann, Anna Kirchner, and Stefan Teichert for their advice on the admission proced- ures and their constructive discussions. Special thanks are due to Melanie Fröhlich for critical reading of the manuscript and her help in avoiding unnecessary mis- takes.
Competing interests
The authors declare that they have no competing in- terests.
References
1. Edwards D, Friedman T, Pearce J. Same admission tools, different outcomes: a critical perspective on predictive validity in three undergraduate medical schools. BMC Med Educ. 2013;13:173.
DOI: 10.1186/1472-6920-13-173
2. Kadmon G, Resch F, Duelli R, Kadmon M. Predictive Value of the School-leaving Grade and Prognosis of Different Admission Groups for Academic Performance and Continuity in the Medical Course – a Longitudinal Study. GMS Z Med Ausbild.
2014;31(2):Doc21. DOI: 10.3205/zma000913
3. Trapmann, S, Hell B, Weigand S, Schuler H. The Validity of School Grades for Academic Achievement – A Meta-Analysis. Z Pädagog Psychol. 2007;21(1):11-27. DOI: 10.1024/1010-0652.21.1.11 4. Ferguson E, James D, Madeley L. Factors associated with success
in medical school: systematic review of the literature. Brit Med J. 2002;324:952-957. DOI: 10.1136/bmj.324.7343.952 5. Salvatori P. Reliability and validity of admission tools used to
select students for the health professions. Adv Health Sci Edu.
2001;6(2):159-175. DOI: 10.1023/A:1011489618208 6. Gold A, Souvignier E. Prognose der Studierfähigkeit. Ergebnisse
aus Längsschnittanalysen [Prediction of college outcomes.
Results from longitudinal studies] German. Z Entwicklungspsychol pädagog Psychol. 2005;37(4):214-222. DOI: 10.1026/0049- 8637.37.4.214
7. Roth PL, BeVier CA, Switzer FS III, Schippmann JS. Meta-analysing the relationship between grades and job performance. J Appl Psychol .1996;18(5):548-556. DOI: 10.1037/0021- 9010.81.5.548
8. Cliffordson C. Selection Effects on Applications and Admissions to Medical Education with Regular and Step-Wise Admission Procedures. Scan J Educ Res. 2006;50(4):463–482. DOI:
10.1080/00313830600823811
9. Jones BJ, Borges NJ, Manuel RS. A Validation of Medical School Objectives Project Attributes: Altruistic, Knowledgeable, Skillful, and Dutiful Students. Ann Behav Sci Med Educ. 2004;10(2):64- 67.
10. Powis D, James D, Eamonn F. Demographic and socio-economic associations with academic attainment (UCAS tariff scores) in applicants to medical school. Med Educ. 2007;41(3):242-249.
DOI: 10.1111/j.1365-2929.2006.02683.x
11. Dhalla IA, Kwong JC, Streiner DL, Baddour RE, Waddell AE, Johnson IL. Characteristics of first-year students in Canadian medical schools. Canad Med Assoc J. 2002;166(8):1029-1035.
12. Quenzel G, Hurrelmann K. Gender and school performance: the inversion of a social stratification pattern. Köln Z Soziol Sozialpsychol. 2010;62:61-69. DOI: 10.1007/s11577-010-0091- 4
13. Budde J. Bildungs(miss)erfolge von Jungen und
Berufswahlverhalten bei Jungen/männlichen Jugendlichen.
Bildungsforschung 23. Bonn: Bundesministerium für Bildung und Forschung; 2008.
14. Sackett PR, Kuncel NR, Arneson JJ, Cooper SR, Waters SD.
Socioeconomic status and the relationship between the SAT®
and freshman GPA: An analysis of data from 41 colleges and universities. The College Board. Research Report 2009-1. New- York: The College Board; 2009. Zugänglich unter/available from:
http://research.collegeboard.org/sites/default/files/
publications/2012/9/researchreport-2009-1-socioeconomic- status-sat-freshman-gpa-analysis-data.pdf
15. Åberg-Bengtsson, L. Separating the quantitative and analytic dimensions of the Swedish Scholastic Aptitude Test (Swesat).
Scan J Educ Res. 2005;49:359-383. DOI:
10.1080/00313830500202892
16. Halpern N, Bentov-Gofrit D, Matot I, Abramowitz MZ. The effect of integration of non-cognitive parameters on medical students' characteristics and their intended career choices. Israel Med Assoc J. 2011;13:488-493.
17. Emery JL, Bell JF. The predictive validity of the BioMedical Admissions Test for pre-clinical examination performance. Med Educ. 2009;43(6):557–564. DOI: 10.1111/j.1365-
2923.2009.03367.x
18. Hampe W, Klusmann D, Buhk H, Münch-Harrach D, Harendza S. Possible reduction of the medical school dropout number by the Hamburg Assessment test for Medicine - part Natural sciences (HAM-Nat). GMS Z Med Ausbild. 2008;25(2):Doc82.
Zugänglich unter/available from: http://www.egms.de/static/
de/journals/zma/2008-25/zma000566.shtml
19. Donnon T, Oddone Paolucci E, Violato C. The predictive validity of the MCAT for medical school performance and Medical Board Licensing Examinations: A metaanalysis of the published research. Acad Med. 2007;82(1):100–106. DOI:
10.1097/01.ACM.0000249878.25186.b7
20. Mercer A, Chiavaroli N. UMAT: A Validity Study. A review of the underlying constructs and an analysis of the content of the Undergraduate Medicine and Health Sciences Admission Test.
Crawley/WA: The University of Westerm Australia; 2007.
Zugänglich unter/available from: http://umat.acer.edu.au/files/
UVSExecutive_Summary.pdf
21. Tiffin PA, McLachlan JC, Webster L, Nicholson S. Comparison of the sensitivity of the UKCAT and A levels to sociodemographic characteristics: a national study. BMC Med Educ. 2014;14:7.
DOI: 10.1186/1472-6920-14-7
22. Kadmon G, Kirchner A, Duelli R, Resch F, Kadmon M. Why The German Aptitude Test for Medical Studies (TMS)? Z. Evid Fortbild Qual Gesundhwes. 2012;106(2):125-130. DOI:
10.1016/j.zefq.2011.07.022
23. Trost G, Nauels HU, Klieme E. The Relationship between Different Criteria for Admission to Medical School and Student Success.
Ass Educ Princip Policy Pract. 1998;5(2):247-254. DOI:
10.1080/0969594980050206
24. Kraft HG, Lamina C, Kluckner T, Wild C, Prodinger WM. Paradise lost or paradise regained? Changes in admission system affect academic performance and drop-out rates of medical students.
Med Teach. 2013;35(5):e1123-1129. DOI:
10.3109/0142159X.2012.733835
25. Bodger O, Byrne A, Evans PA, Rees S, Jones G, et al. Graduate Entry Medicine: Selection Criteria and Student Performance.
PLoS ONE. 2011;6(11):e27161. DOI:
10.1371/journal.pone.0027161
26. Hell B, Trapman S, Weigand S, Schuler H. The validity of admission interviews – a meta-analysis. Psychol Rundsch.
2007;58(2):93-102. DOI: 10.1026/0033-3042.58.2.93 27. Dowell J, Lumsden MA, Powis D, Munro D, Bore M, Makubate B,
Kumwenda B. Predictive validity of the personal qualities assessment for selection of medical students in Scotland. Med Teach. 2011;33(9):e485–e488. DOI:
10.3109/0142159X.2011.599448
28. Lumsden MA, Bore M, Millar K, Jack1 R, Powis D. Assessment of personal qualities in relation to admission to medical school.
Med Educ. 2005;39(3):258-265. DOI: 10.1111/j.1365- 2929.2005.02087.x
29. Trapmann S, Hell B, Hirn JO, Schuler H. Meta-Analysis of the relationship between the big five and academic success at university. Z Psychol. 2007;215(2):132-151. DOI:
10.1027/0044-3409.215.2.132
30. Eva KW, Reiter HI, Trinh K, Wasi P, Rosenfeld J, Norman GR.
Predictive validity of the multiple mini-interview for selecting medical trainees. Med Educ. 2009;43(8):767-775. DOI:
10.1111/j.1365-2923.2009.03407.x
31. Chamberlain SE, Searle J. Assessing suitability for a problem- based learning curriculum: evaluating a new student selection instrument. Med Educ. 2005;39(3):250–257. DOI:
10.1111/j.1365-2929.2005.02086.x
32. Brown CA, Lilford RJ. Selecting medical students. Tests of cognitive ability are probably the best method at present. BMJ.
2008;336:786. DOI: 10.1136/bmj.39517.679977.80 33. Hängsen KD, Ischi N. Eignungsprüfung für das Medizinstudium.
Kriterien und Testverfahren. Bericht über das Internationale Symposium in Bern, Bericht 3. Fribourg: Universität Fribourg;
1996.
34. Meunier E. Transferevaluation eines Testtrainings für den Test für medizinische Studiengänge (TMS). Diplomarbeit. Berlin: Freie Universität Berlin; 2010. S.31ff
35. Emery JL, Bell JF. The predictive validity of the BioMedical Admissions Test for pre-clinical examination performance. Med Educ. 2009;43(6):557-564. DOI: 10.1111/j.1365-
2923.2009.03367.x
36. Bore M, Munro D, Powis D. A comprehensive model for the selection of medical students. Med Teach. 2009;31(12):1066- 1072. DOI: 10.3109/01421590903095510
37. McGaghie WC. Assessing readiness for medical education.
Evolution of the Medical College Admission Test. J Am Medic Assoc. 2002;288(9):1085-1090. DOI:
10.1001/jama.288.9.1085
38. Borst CG. Choosing the Student Body: Masculinity, Culture, and the Crisis of Medical School Admissions, 1920-1950. History Educ Quart. 2002;42(2):181-214. DOI: 10.1111/j.1748- 5959.2002.tb00106.x
39. Emery JL, Bell JF, Vidal Rodeiro CL. The BioMedical Admissions Test for medical student selection: Issues of fairness and bias.
Med Teach. 2011;33(1):62-71. DOI:
10.3109/0142159X.2010.528811
40. Michell R. Student selection: time to reconsider? Vet Rec.
1990;127(21):512-514.
41. Kadmon G, Kadmon M. Chance für Bewerber ohne Einser-Abitur.
Dtsch Arztebla. 2011;108(45):A2388-A2392.
42. Hinneberg H. Der "Test für medizinische Studiengänge" im Auswahlverfahren der Hochschulen. Hochschulwes. 2012;3:94- 98.
43. Kadmon G, Schmidt J, De Cono N, Kadmon M. Integrative vs.
traditional learning from the student perspective. GMS Z Med Ausbild. 2011; 28(2):14-26. DOI: 10.3205/zma000740 44. Hampe W, Hissbach J. Kein Ersatz für die Abiturnote. Dtsch
Ärztebl. 2010;107(26):A1298-1299.
45. Hissbach J, Feddersen L, Sehner S, Hampe W. Suitability of the HAM-Nat test and TMS module "basic medical-scientific understanding" for medical school selection. GMS Z Med Ausbild.
2012;29(5):Doc72. DOI: 10.3205/zma000842
46. Reibnegger G, Caluba HC, Ithaler D, Manhal S, Neges HM, Smolle J. Progress of medical students after open admission or admission based on knowledge tests. Med Educ.
2010;44(2):205-2014. DOI: 10.1111/j.1365- 2923.2009.03576.x
47. Reibnegger G, Caluba HC, Ithaler D, Manhal S, Neges HM, Smolle J. Dropout rates in medical students at one school before and after installation pf admission tests in Austria. Acad Med.
2011;86(8):1040-1048. DOI:
10.1097/ACM.0b013e3182223a1b
Corresponding author:
Guni Kadmon
Heidelberg University, Medical Faculty, Im Neuenheimer Feld 155, D-69120 Heidelberg, Germany, Phone: +49 (0)6221/56-6716, Fax: +49 (0)6221/56-7207 guni.kadmon@med.uni-heidelberg.de
Please cite as
Kadmon G, Kadmon M. Academic Performance of Students with the Highest and Mediocre School-leaving Grades: Does the Aptitude Test for Medical Studies (TMS) Balance Their Prognoses? GMS J Med Educ.
2016;33(1):Doc7.
DOI: 10.3205/zma001006, URN: urn:nbn:de:0183-zma0010062
This article is freely available from
http://www.egms.de/en/journals/zma/2016-33/zma001006.shtml
Received:2014-07-12 Revised:2015-09-30 Accepted:2015-10-29 Published:2016-02-15
Copyright
©2016 Kadmon et al. This is an Open Access article distributed under the terms of the Creative Commons Attribution 4.0 License. See license information at http://creativecommons.org/licenses/by/4.0/.
Studienleistung von Studierenden mit den besten versus mittelmäßigen Abiturnoten: Gleicht der Test für
Medizinische Studiengänge (TMS) ihre Prognosen aus?
Zusammenfassung
Hintergrund:Die Auswahl Medizinstudierender wird in Deutschland teils zentral, teils lokal durchgeführt. Die zentrale Auswahl umfasst zwei
Guni Kadmon
1Martina Kadmon
2Gruppen: Studierende mit den besten Hochschulzulassungsnoten (Ab- iturbeste) und Studierende mit schlechteren Abiturnoten, die erst nach
einer Wartezeit von bis zu sieben Jahren nach Schulabschluss zum 1 Universität Heidelberg, Medizinische Fakultät, Heidelberg, Deutschland Studium zugelassen werden (Wartezeitquote). Studierende mit Lern-
schwierigkeiten sowie solche, die das Studium frühzeitig abbrechen,
befinden sich in beiden Gruppen. Die hochschuleigene Studierenden- 2 Carl-von-Ossietzky-Universität Oldenburg, Fakultät für auswahl (AdH) unserer Fakultät berücksichtigt das Ergebnis des Tests
Medizin und für Medizinische Studiengänge (TMS) und ermöglicht die leistungsbezo-
Gesundheitswissenschaften, Oldenburg, Deutschland gene Zulassung von Studierenden mit einer breiten Spannweite an
Abiturnoten.
Ziel:Zu untersuchen, ob die Gewichtung des TMS in der hochschuleige- nen Auswahl gerechtfertigt ist, die darauf abzielt, die Zulassung poten- tiell leistungsschwacher Abiturbesten zu reduzieren und stattdessen die Zulassung potentiell leistungsstarker Bewerber zu fördern, die mit- telmäßige Schulabgangsnoten mitbringen.
Methode:Der prognostische Beitrag der Abiturpunktzahl und des TMS zur Studienleistung und zur Studienkontinuität im vorklinischen Ab- schnitt des Medizinstudiums wurde an zwei Studierendengruppen un- tersucht: Abiturbeste (Abiturnote 1,0, Abiturpunkte 823-900) und mit- telmäßige Abiturienten (Abiturnoten 2,0-2,3, Abiturpunkte 689-660).
Das Outcome beider Gruppen wurde im Verhältnis zu ihren TMS-Ergeb- nissen verglichen. Die Studie umfasste vier aufeinander folgende Ko- horten.
Ergebnisse: In beiden Gruppen sagte der TMS die Studienleistung (β=0,442-0,446) und die Studienkontinuität (OR=0,890-0,853) besser vorher als die Abiturnote (β=0,238-0,047; OR=1,009-0,998). Die Stu- dienverlängerungs- und -abbruchsrate war am stärksten mit der Nicht- Teilnahme am TMS assoziiert (OR=0,230-0,380). Studierende mit mit- telmäßigen Abiturnoten und TMS-Ergebnissen (standardisiertem Test- wert) ≥125 erzielten ähnlich gute Studienleistungen wie die Abiturbes- ten. Mittelmäßige Schulabgänger mit TMS-Ergebnissen zwischen 110- 124 erbrachten im Schnitt weniger gute aber noch ausreichende Stu- dienleistungen. Abiturbeste mit mittelmäßigen TMS-Ergebnissen und 30% der Abiturbesten, die nicht am TMS teilgenommen hatten, erreich- ten nicht das Studienleistungsniveau der meisten Studierenden mit mittelmäßigen Abiturnoten und sehr guten TMS-Leistungen.
Diskussion: Der TMS scheint, zwischen potenziell erfolgreichen und weniger erfolgreichen Studierenden beider Abiturnotenbereiche zu dif- ferenzieren. Mittelmäßige Abiturienten mit besonders hohen TMS-Er- gebnissen erreichten bessere Studienergebnisse im vorklinischen Stu- dienabschnitt als die Abiturbesten, die im TMS nur mittelmäßigen Erfolg hatten. Diese Beobachtungen rechtfertigen die Anwendung des TMS, um die Chancen von Studienbewerbern mit mittelmäßigen Abiturnoten am Wettbewerb um die Studienplätze zu erhöhen.
Schlüsselwörter:Studierendenauswahl, Medizinstudium, Eignungstest, Test für medizinische Studiengänge, TMS, Abitur
Einleitung
Die Leistung in der Sekundarausbildung oder im College vor Eintritt in ein universitäres Studium wird generell als der stärkste Indikator für Lernerfolg auf der Tertiärstufe betrachtet. Die prognostische Validität von Schulabgangs- noten für die Leistungen im Medizinstudium kann zwi- schen Hochschulen und Ausbildungsjahren variieren [1], übersteigt aber häufig 0,3 und sogar 0,5 [2], [3], [4], [5].
Die starke prognostische Validität der Schulabgangsnoten wurde auch für andere Studiengänge [4], [6] und für nicht akademische Berufe [7] dokumentiert. Aus diesem Grunde werden Schulabgangsnoten weltweit als das pri- märe Auswahlkriterium für die Zulassung bzw. die Voraus- wahl von Medizinstudierenden eingesetzt.
In Deutschland werden etwa 10% der Studienplätze des Studiengangs Humanmedizin gesetzlich definierten be- vorzugten Bewerbern zugeteilt. Zwanzig Prozent der übri- gen Studienplätze werden zentral an Bewerber mit den besten Abiturnoten vergeben (Abiturbestenquote). Weitere 20% der Studienplätze sind Bewerbern vorbehalten, die schlechtere Abiturnoten haben und nach einer Wartezeit von bis zu sieben Jahren zentral zum Studium zugelassen werden (Wartezeitquote). Circa 50% der Medizinstudie- renden werden durch die medizinischen Fakultäten an- hand eigener Auswahlkriterien lokal ausgewählt, wobei die Abiturnote bei der Auswahlentscheidung maßgeblich gewichtet werden muss (Auswahlverfahren der Hochschu- len, AdH).
Die dominante Rolle der Abiturnote in der Zulassung zum Medizinstudium rückte in den letzten Jahren zunehmend in das Blickfeld der öffentlichen Diskussion. Die Zulassung anhand von Schulabgangsnoten begünstigt die Auswahl homogener Studierendenkohorten [8], [9] und scheint unterschiedliche Bewerbergruppen wie Absolventen öf- fentlicher Schulen, Bewerber mit sozioökonomisch be- nachteiligtem und bildungsschwachem Hintergrund [10], [11] sowie männliche Schulabgänger [12], [13] zu benach- teiligen. Des Weiteren bilden Schulabgangsnoten nicht- kognitive Eigenschaften, wie sie in der patientenorientier- ten Medizin von Bedeutung sind, nicht unbedingt ab.
Ein breites Spektrum an zusätzlichen, kognitiven und nicht-kognitiven Auswahlinstrumenten wurde entwickelt, um die Grenzen der Schulabgangsnoten als Auswahlkri- terium zu kompensieren. Zu den kognitiven Auswahlin- strumenten gehören allgemeine Intelligenztests wie der SAT in den USA [14], der SweSAT in Schweden [15] und der PET in Israel [16], naturwissenschaftliche Wissens- prüfungen wie der BMAT in Großbritannien [17] und der Ham-Nat in Deutschland [18] sowie spezielle Eignungs- tests für medizinische Studiengänge wie der MCAT in den USA [19], der UMAT in Australien [20], der UKAT in Großbritannien [21] und der Test für Medizinische Stu- diengänge (TMS) in Deutschland [22], [23] und der Schweiz (EMS, [24]). Daneben werden nicht-kognitive Instrumente einschließlich Interviews [25], [26], [5], Mo- tivationsschreiben [5], Personal Qualities Assessment (PQA) [27], [28] und psychologische Testverfahren [29]
eingesetzt. Sie haben im Allgemeinen keinen zuverlässi-
gen prognostischen Wert für die Leistung im Medizinstu- dium. Instrumente, die konkrete nicht-kognitive Eigen- schaften abbilden, können jedoch prognostische Relevanz in Bezug auf spezifische Kompetenzen, Prüfungstypen oder favorisierte Lehrformate haben [30], [31].
In Anbetracht der prognostischen Unsicherheit der nicht- kognitiven Auswahlinstrumente empfahlen Brown und Lilford [32], sich für die Auswahl Medizinstudierender auf kognitive Instrumente zu beschränken. Es ist denkbar, dass die Nutzung alternativer kognitiver Auswahlinstru- mente unter Bewerbern mit unterschiedlichen Schulab- gangsnoten eine ähnliche Eignungsvorhersage für das Medizinstudium zulässt wie die Schulabgangsnote. Solche Bewerberkohorten könnten ein breiteres Spektrum an Interessen und Fertigkeiten mitbringen, als Bewerberko- horten mit einheitlicher Schulabgangsnote. Auf der Grundlage dieser Überlegung wurde an unserer Fakultät ein kompensatorisches Auswahlverfahren entwickelt, das hauptsächlich auf der Abiturpunktzahl und dem standar- disierten TMS-Testwert basiert und eine Rangformel ver- wendet, die im Methodenteil angegeben wird.
Der TMS wird von der ITB Consulting®GmbH entwickelt und einmal jährlich durchgeführt. Er enthält neun Unter- tests, dauert ungefähr fünf Stunden und 10 Minuten und bedarf keines schulischen Vorwissens. Eine geringfügig unterschiedliche Version des Tests wird in der Schweiz verwendet (EMS, [24], [33]). Vier Untertests bilden wis- senschaftliches und mathematisches Denken sowie Text- und Datenverständnis ab. Die erreichten Punkte in diesen Testteilen weisen eine moderate Korrelation (r=0,33) mit der Abiturpunktzahl auf [22]. Die übrigen fünf Untertests bilden visuelle Kognition, Musteranalyse, grafisches und verbales Gedächtnis ab. Diese Testteile korrelieren nicht wesentlich mit der Abiturpunktzahl (r=0,16 [22]). Die von allen TMS-Teilnehmern erreichten Punktzahlen werden jedes Jahr auf einen Mittelwert von 100 und eine Stan- dardabweichung (SD) von 10 standardisiert. Vorbereitung auf den Test ist vorteilhaft für das Testergebnis [34], möglicherweise weil sie eine Motivationslage reflektiert.
Der Vorteil darin, die Qualitäten eines Bewerbers*, der in einem Auswahlinstrument Schwächen zeigt, mithilfe eines alternativen Instrumentes, das seine Eignung bes- ser abbilden kann, einzuschätzen, wurde diskutiert [35], [36]. Die im Methodenteil angegebene kompensatorische Rangformel ermöglicht es potenziell fähigen Bewerbern, schwache Abiturnoten durch Erfolg im TMS, als ein zusätz- liches Eignungsmaß, auszugleichen.
Eine frühere Untersuchung [2] hat gezeigt, dass einige Studierende der Abiturbestenquote im vorklinischen Studienabschnitt Schwierigkeiten haben, die akademi- schen Anforderungen zu erfüllen, während einige Studie- rende mit mittelmäßigen Abiturnoten ein durchaus hohes Leistungsniveau erreichen. Studierende mit mittelmäßi- gen Abiturnoten werden jedoch in der Regel erst nach mehrjähriger Wartezeit zum Studium zugelassen. Sie weisen eine hohe Tendenz auf, das Studium aus alters- bezogenen Gründen vorzeitig abzubrechen [2]. Einschlä- gige Erfahrungen aus dem Ausland zeigen Möglichkeiten auf, diesen Gegebenheiten entgegenzuwirken. Die Einfüh-
rung des Medical College Admissions (Moss) Test (MCAT) in den USA hatte zur Folge, dass sich die Prädiktion der Studienleistung verbesserte und die Abbrecherquote drastisch reduzierte [37], während sich die Diversität der Studierenden in Bezug auf Rasse und Religion vergrößer- te [38]. Es wurde außerdem beschrieben, dass der Bio Medical Admissions Test (BMAT) den Studienerfolg von Studierenden aus benachteiligten Schulen besser vorher- sagt als "Personal Statements" [39], und Tiermedizinstu- dierende gute Tierärzte werden können, auch wenn sie schlechte Schulabgangsnoten haben [40]. Aus diesen Beobachtungen resultierte die Zielsetzung der Fakultät, potenziell fähigen Bewerbern mit mittelmäßigen Abitur- noten bereits im Hauptauswahlverfahren unmittelbar nach Erlangung der Hochschulzugangsberechtigung die Möglichkeit einzuräumen, mit Bewerbern um die Studien- plätze zu konkurrieren, die zwar bessere Abiturnoten aber ein schlechteres Leistungspotenzial mitbringen [2].
Ziel der vorliegenden Arbeit war es, zu untersuchen, ob das oben beschriebene kompensatorische Auswahlver- fahren ermöglicht, Bewerber mit Abiturbestnote aber schlechtem Leistungspotential und solche mit mittelmä- ßigen Abiturnoten aber hohem Leistungspotential im Studiengang Humanmedizin bereits im Auswahlverfahren zu erkennen. Zu diesem Zweck wurden die Studienleis- tung und kontinuität der Studierenden der zentralen Zu- lassungsgruppen (Abiturbesten- und Wartezeitquote) und der im AdH zugelassenen Studierenden mit gleichen Ab- iturleistungen verglichen. Der differentielle prädiktive Wert der Abiturnote und des TMS für Studienleistung und -kontinuität wurde statistisch ermittelt. Die Arbeit fokus- sierte in drei aufeinander folgenden Studien auf die fol- genden Fragen:
• Studie 1: Hilft der TMS, die differentielle Studienleis- tung und -kontinuität von Studierenden mit der Abitur- note 1,0 (Abiturbesten) zu prognostizieren?
• Studie 2: Hilft der TMS, die differentielle Studienleis- tung und -kontinuität von Studierenden mit Abiturnoten auf dem Niveau des nationalen Durchschnitts (2,0-2,3 – mittelmäßigen Abiturienten) zu prognostizieren?
• Studie 3: Erreichen Studierende mit mittelmäßigen Abiturnoten ein Studienleistungsniveau, das ihre Chancenerweiterung im Wettbewerb um die Studien- plätze im Hauptauswahlverfahren ohne Wartezeit rechtfertigt?
Methoden
Teilnehmer und Einschlusskriterien
Studienteilnehmer waren Medizinstudierende der Medi- zinischen Fakultät Heidelberg der Universität Heidelberg, die ihr Studium in den Jahren 2009, 2010, 2011 und 2012 begannen. Eingeschlossen waren:
• Alle Studierenden mit der Abiturnote 1,0.
• Alle Studierenden mit den Abiturnoten 2,0-2,3.
Ausschlusskriterien
Von der Untersuchung ausgeschlossen wurden Studieren- de mit ausländischen Schulabgangszeugnissen sowie Studierende, die zum Studium in anderen Quoten als der Abiturbesten-, Wartezeit- und AdH-Quote zugelassen wurden (bevorzugt Zugelassene, Härtefälle, Studierende im Zweitstudium, Zugelassene nach Klageverfahren).
Studierende, die nicht am TMS teilgenommen hatten, wurden von Analysen mit Auswertung des TMS-Ergebnis- ses ausgeschlossen, aber in die Analysen eingeschlossen, in denen Unterschiede zwischen TMS-Teilnehmern und Nicht-Teilnehmern untersucht wurden.
Datenrekrutierung und Datenschutz
Die Arbeit wurde im Rahmen der Qualitätssicherung des Studierendenauswahlverfahrens der Medizinischen Fa- kultät Heidelberg durchgeführt. Alter, Geschlecht, Geburts- datum, Datum der Immatrikulation bzw. Exmatrikulation, Prüfungsnoten und das Bestehensdatum des ersten Ab- schnitts der Ärztlichen Prüfung (M1) wurden der Daten- bank der Fakultät entnommen. Die Abiturnoten der AdH- Studierenden wurden ihren Bewerbungsunterlagen ent- nommen. Die Abiturnoten der zentral zugelassenen Stu- dierenden wurden von der Stiftung für Hochschulzulas- sung (SfH) übermittelt. Die Daten wurden in MS Excel® tabellarisch erfasst und durch Löschung der Spalten mit Personen identifizierenden Angaben vor der Analyse an- onymisiert. Die Arbeit wurde von der Ethikkommission der Fakultät genehmigt (Aktenzeichen S-440/2009).
Auswertungsskalen
Abiturpunktzahl:Die Abiturpunktzahl, die zum Hochschul- zugang berechtigt, umspannt 600 Punkte, 240 (Beste- hensgrenze) bis 840 Punkte bzw. 300 (Bestehensgrenze) bis 900 Punkte, je nach Jahr der Hochschulzugangsbe- rechtigung und Bundesland. Für die Analysen wurden die Werte auf der 840 Punkteskala auf die 900 Punkteskala konvertiert.
Abiturnote:Die Abiturpunktzahl wurde in die Abiturnote mit der Skala 1,0 – 6,0 (1,0=beste Note, 4,0=Bestehens- grenze) umgerechnet. Die Abiturpunktzahlen der Noten 1,0 und 2,0-2,3 sind in Tabelle 1 angegeben.
Standardisierter TMS-Testwert: 0-135 Punkte. Mittel- wert=100 Punkte, SD=10 Punkte. Der TMS-Testwert wurde als das TMS-Ergebnis betrachtet und in sieben Kategorien mit jeweils dem folgenden Umfang unterteilt:
(1) ≥125, (2) 120-124, (3) 117-119, (4) 114-116, (5) 110-113, (6) 106-109, (7) ≤105. Für die Randkategorien (1,2,6,7) wurden breitere Spannweiten gewählt, um die Stichproben seltener Fälle zu vergrößern. Seltene Fälle wurden in die Analyse aufgenommen, da sie in Bezug auf die Forschungsfragen besondere Bedeutung haben. Das Fehlen von TMS-Ergebnissen bildete eine achte Kategorie.
Gewichtete kompensatorische Rangformel: Das lokale (AdH) kompensatorische Auswahlverfahren basierte auf der folgenden Rangformel, in der nur überdurchschnittli-