Policy Research Working Paper 6802
Why Are Adult Women Missing?
Son Preference and Maternal Survival in India
Annamaria Milazzo
The World Bank
Development Research Group
Human Development and Public Services Team March 2014
WPS6802
Public Disclosure AuthorizedPublic Disclosure AuthorizedPublic Disclosure AuthorizedPublic Disclosure Authorized
Abstract
The Policy Research Working Paper Series disseminates the findings of work in progress to encourage the exchange of ideas about development issues. An objective of the series is to get the findings out quickly, even if the presentations are less than fully polished. The papers carry the names of the authors and should be cited accordingly. The findings, interpretations, and conclusions expressed in this paper are entirely those of the authors. They do not necessarily represent the views of the International Bank for Reconstruction and Development/World Bank and its affiliated organizations, or those of the Executive Directors of the World Bank or the governments they represent.
Policy Research Working Paper 6802
This paper is the first to show that excess mortality among adult women can be partly explained by strong preference for male children, the same cultural norm widely known to cause excess mortality before birth or at young ages. Using pooled individual-level data for India, the paper compares the age structure and anemia status of women by the sex of their first-born and uncovers several new findings. First, the share of living women with a first-born girl is a decreasing function of the women’s age at the time of the survey. Second, while there are no systematic differences at the time of birth, women with a first-born girl are significantly more likely to develop anemia when young (under the age of 30) and these differences disappear for older women. Moreover,
This paper is a product of the Human Development and Public Services Team, Development Research Group. It is part of a larger effort by the World Bank to provide open access to its research and make a contribution to development policy discussions around the world. Policy Research Working Papers are also posted on the Web at http://econ.worldbank.org.
The author may be contacted at amilazzo@worldbank.org.
among those in the older age group, they appear to be significantly better off in terms of various predetermined characteristics. These findings are consistent with a selection effect in which maternal and adult mortality is higher for women with first-born girls, especially the poor and uneducated with limited access to health care and prenatal sex diagnostic technologies. To ensure the desired sex composition of children, these women resort to a fertility behavior medically known to increase their risk of death. The observed sex ratios for first births imply that 2.2–8.4 percent of women with first-born girls are
‘missing’ because of son preference between the ages of 30 and 49.
Why Are Adult Women Missing?
Son Preference and Maternal Survival in India
∗Annamaria Milazzo
†JEL classification: J16, J13, I10, D63
Keywords: missing women, maternal mortality and morbidity, son preference, fertility, birth spacing, India
∗I am grateful to Eliana La Ferrara for continued guidance and support, and to Alberto Alesina, Siwan Anderson, Sonia
Bhalotra, Maristella Botticini, Abel Brodeur, Jishnu Das, Jed Friedman, Robert Garlick, Selim Gulesci, Eeshani Kandpal, Elaine Liu, Owen Ozier, Debraj Ray, Dominique van de Walle, and Adam Wagstaff for very helpful comments. I thank seminar participants at Bocconi University, 2012 NEUDC conference, and 2013 CEA Conference at HEC Montr´eal for comments and suggestions. All errors are my own. The findings, interpretations, and conclusions expressed in this paper do not necessarily represent the views of the World Bank, its Executive Directors, or the countries they represent.
†The World Bank. Email: amilazzo14@gmail.com; amilazzo@worldbank.org
1 Introduction
Research on missing women has documented severe gender bias at birth and at young ages due to pervasive son preference in India and other Asian countries (Das, 1987; Das Gupta, 1987; Sen, 1990; Arnold, Kishor and Roy, 2002; Jha et al., 2006, 2011). Recent studies confirm these previous findings but also demonstrate that most women are instead missing at adult ages (Anderson and Ray, 2010, 2012; World Bank, 2011).
1,2Anderson and Ray (2012) find a large state-wise variation in the distribution of excess mortality across age groups in India and argue that the traditional explanation of strong preference for male children can only explain the phenomenon of missing women in states with abnormally male-biased sex ratios
at birth. They contend that the explanationfor excess mortality in adulthood must reside in other, unspecified, factors.
3This paper provides evidence that, on the contrary, strong son preference is also partly responsible for high mortality rates among adult women.
India has the world’s largest number of maternal deaths. The ‘female disadvantage in mortality during the reproductive ages is in part driven by the risk of death in pregnancy and childbirth and associated long-term disabilities’ (World Bank, 2011, p. 78). It is estimated that for every maternal death there are twenty other women who suffer pregnancy-related illness, infection, injury, and other physical and psychological long-term consequences (Nanda, Switlick, and Lule, 2005; Filippi et al., 2006; UNICEF, 2008). Anemia, one of the most common indirect causes of maternal mortality in Asia, is pervasive among Indian women. Medical research has shown that repeated and closely spaced pregnancies are associated with increased risk of maternal mortality and morbidity. This behavior is common among women who have only daughters and want to conceive again for a son. The diffusion of prenatal sex diagnostic technologies in the late 1980s has been found to be associated with increasing sex ratios at birth (the fraction of male births) in India which is strongly suggestive of sex selection (Arnold, Kishor, and Roy, 2002; Bhalotra and Cochrane, 2010). Research
1Missing women, or excess female mortality, is based on a counterfactual in which there is no discrimination based on gender (Sen, 1990). As a counterfactual, Anderson and Ray (2010) use developed countries, while in their study on India, Anderson and Ray (2012) also use Kerala as an alternative benchmark.
2Klasen and Vollmer (2013) challenge the methodology developed in Anderson and Ray (2010) and argue that the data used in their computations are largely unreliable (especially those on adult mortality for sub-Saharan Africa) and use a reference benchmark that does not account for differences in the disease and mortality environment. Anderson and Ray (2012) replicate their decomposition exercise for India and find that their results are robust to using Kerala as a benchmark (rather than developed countries), though of smaller magnitude. It is important to note that the issues at stake in this debate do not alter the motivation for this paper, which is to analyze the factors contributing to the high number of maternal deaths in India. High maternal mortality is certainly partly due to generally poor health conditions and services and, as argued in this paper, it isaggravatedby strong son preference.
3Jayaraman, Ray, and Wang (2013) find evidence that women seek treatment for eye care later than men, while they do not seem to receive less surgical care in India.
has shown that sex-selective abortion is more common among educated women and
afterthe first child is born (Das Gupta, 1987; Jha et al., 2011).
The central idea of this paper is that maternal and adult mortality is higher among women with a first-born daughter. As a result of strong son preference, such women are more likely to engage in fertility behavior that adversely affects their health. This effect should and is found to be stronger among women with generally more vulnerable health, lower access to maternal care and to technologies for fetal sex determination, typically the poor and uneducated.
I pool three rounds of the India National Family Health Survey (NFHS) and find several signif- icant findings. First, there are no systematic differences between women whose first birth is male and women whose first birth is female close to the time they give birth. Significant differences appear in the sample of older women (i.e., aged 30 to 49), both in terms of variables related to fertility behavior, and predetermined characteristics. The latter is suggestive of selection among women with a first-born girl as a result of higher mortality. The empirical strategy rests on the identifying assumption of conditional exogeneity of the sex of the first-born. Second, compared to women with first-born sons, women with first-born daughters are 5.1 percentage points more likely to desire more children, 6.8 percentage points less likely to be sterilized, 2.5 percentage points more likely to have undergone an ultrasound test, 1.1 percentage points more likely to have had a terminated pregnancy, and to have given birth to 0.3 additional children. These results reinforce findings from the existing literature on son-preferring stopping behavior and sex-selective abortion.
I investigate heterogeneous effects by women’s education level (with education as a proxy for socio-
economic status) and find that, as expected, educated women with a first-born girl are more likely
to have had a terminated pregnancy and to exhibit an attenuated effect on fertility (compared to
uneducated women). Moreover, a first-born girl increases the probability of a short birth interval
by 0.5 percentage points (the effect is 0.8 percentage points for women with a second-born girl
conditional on a first-born girl). This result is robust to the inclusion of mother fixed effects and is
larger for uneducated women. Although the effects of two or more successive daughters on fertility
outcomes are consistently larger (reflecting increasing pressure for having a son), I focus on the
sex of the first-born to maintain a causal interpretation. Third, among women under the age of
30, those with a first-born girl develop anemia at a higher rate: they are in fact 1.4 percentage
points more likely to be anemic (compared to those with a first-born boy), even after controlling
for height, current pregnancy and breastfeeding status. Fourth, differences in anemia prevalence
disappear for women older than 30. Fifth, the share of living women whose first birth is female
decreases with mother’s age at the time of the survey, especially among the uneducated. This
suggests that maternal and adult mortality is higher among uneducated women with a first-born
girl. State-wise variation confirms that this decreasing pattern is found in states with the highest
proportion of missing women of adult ages (Assam and Bihar), and not in states with the most
male-biased sex ratios at birth (Punjab and Haryana).
I address potential alternative interpretations of the findings. First, based on evidence that poor maternal nutrition might be associated with the sex of the child (Mathews, Johnson, and Neil, 2008;
Almond and Mazumder, 2011), I estimate the timing of the emergence of anemia differences. If predetermined health affects the sex of the child, differential incidence of anemia between women with a first-born girl or boy should be present at the time of birth (and even
before, but this cannotbe verified with the data at hand). The results indicate no differential incidence of anemia close to the time of birth. Women with a first-born girl start developing anemia approximately one and a half years after birth. Therefore, biological differences do not seem to explain the anemia pattern, which is rather consistent with behavioral factors. Second, I test whether the estimates are affected by selective reporting bias according to which women might under-report female births, and find no evidence supporting it. Third, I show nonparametric evidence that the decreasing share of women as a function of their age (found for the uneducated) cannot be affected by the diffusion of the practice of sex-selective abortion.
4Finally, I check whether women suffer other forms of overt discrimination as direct ‘punishment’ for having had a first-born daughter. I do not find evidence that they are punished through withholding of food (or receive less iron supplements), while they appear to be more likely to have been the victims of severe domestic violence inflicted by their husbands. The effect on violence is specific to the period close to the time of birth and to uneducated women. Therefore, increased violence is possibly contributing to higher mortality among women with daughters as the result of strong preference for male children. All these findings are consistent with a model in which son preference induces women whose first birth is female into a fertility behavior that is medically known to be associated with higher risk of maternal mortality and morbidity. This pattern is especially found among uneducated women who have poorer access to maternal care. These women develop anemia at a higher rate and appear to suffer a higher risk of death.
This paper is related to three strands of literature. The first is the recent literature on the age distribution of missing women (Anderson and Ray, 2010, 2012; World Bank, 2011). While previous studies use aggregate data on mortality and find that most women are missing in adulthood, this paper uses individual-level data to examine the possible channels generating this phenomenon.
Second, it is related to the literature on the effects of son preference on children’s health. Son- preferring fertility stopping rules can in fact lead to less resources being allocated to female children within the household even
unintentionallyon the part of parents. Jayachandran and Kuziemko
4Abortion was legalized in 1971 in India. In 1994, the Government of India passed the Prenatal Diagnostic Techniques Regulations and Misuse Act (PNDT Act) to make the use of ultrasound or amniocentesis for the purpose of sex determination illegal. However, there is evidence that this Law is often ignored and not enforced (Arnold, Kishor, and Roy, 2002; Bhalotra and Cochrane, 2010).
(2011) show that gender disparities in breastfeeding duration arise because parents want to try again for a son and therefore girls are weaned sooner than boys as a result. Jensen (2003) finds that the gender differential in education is the consequence of the fact that girls tend to be born in larger households. Barcellos, Carvalho, and Lleras-Muney (2014) develop a methodology to account for the effect of son-preferring stopping rules on family size and find that boys still receive more parental inputs (including childcare time, breastfeeding, vaccinations, and vitamin supplementation) than girls in India. Recently, Jayachandran and Pande (2013) find that the cultural norm of eldest son preference can in part explain the child height gap between India and Africa. This paper contributes to this literature by suggesting another channel through which strong son preference can affect children’s health, namely higher mortality of mothers (which often results in mortality of the newborn or increased health risks for older children).
Third, it refers to the literature on the consequences of the diffusion of prenatal sex diagnostic technologies and sex-selective abortion. Research has shown evidence of massive female foeticide in India, especially from the late 1980s with the diffusion of ultrasound testing (Arnold, Kishor, and Roy, 2002; Jha et al., 2006; Bhalotra and Cochrane, 2010; Jha et al., 2011).
5The ability to detect the sex of the fetus has also been found to be associated with preferential prenatal treatment for boys (Bharadwaj and Lakdawala, 2013). Other authors have argued that sex selective abortion implies a substitution in discrimination against female children from the postnatal to the prenatal period (Goodkind, 1999). Hu and Schlosser (2011) find that the practice of selective abortion is associated with lower malnutrition among girls likely due to differential reductions in family size (larger for girls than boys). This paper provides evidence that, in addition to its general health benefits, easier access to maternal antenatal care, and in particular to prenatal sex determination technologies, can also reduce the risk of maternal mortality as women tend to rely less on a fertility behavior that entails major risks to their health. Importantly, lower maternal mortality does not necessitate easier access to sex-selective abortion, but is instead the outcome of improved maternal care for all women, especially those practicing son-preferring fertility behavior due to increased access to treatment of the complications deriving from it.
The remainder of the paper is organized as follows: section 2 provides some background infor- mation on the prevalence of maternal mortality and anemia in India; section 3 describes the data;
section 4 presents nonparametric evidence; section 5 introduces the empirical methodology used to analyze fertility outcomes, birth spacing, health outcomes, and describes the results; section 6 discusses alternative interpretations; section 7 reports some calculations of the implied fraction of missing women due to son preference; and section 8 concludes.
5Akbulut-Yuksel, and Rosenblum (2012) find that, after the initial introduction of ultrasound, a recent rapid spread in ultrasound use in the 2000s in some parts of India is not associated with further increase in sex selection.
2 Son preference, fertility behavior and maternal health outcomes
2.1 Maternal mortality, morbidity, and anemia prevalence in India
Maternal mortality and morbidity related to childbirth are among the main drivers of excess female mortality during the reproductive years in India (Anderson and Ray, 2010; World Bank, 2011).
6The WHO estimates that 117,000 maternal deaths occurred in India in 2005 (out of 536,000 worldwide), more than in any other country (WHO, 2007). These figures are considered to un- derestimate the real burden of maternal mortality due to problems with its standard definition, measurement issues, and lack of adequate data (AbouZahr, 2003; Koblinsky et al., 2012). A ma- ternal death is defined as the ‘death of a woman while pregnant or within 42 days of termination of pregnancy, irrespective of the duration and site of the pregnancy, from any cause related to or aggravated by the pregnancy or its management but not from accidental or incidental causes.’
(WHO, 2010, p. 10). The dominant direct causes of maternal mortality are severe bleeding, hy- pertensive diseases, and infections, while indirect causes include anemia, HIV/AIDS and malaria (Ronsmans and Graham, 2006). Many direct causes, like severe bleeding, are themselves symptoms of underlying indirect causes such as anemia (Center for Reproductive Rights, 2008). Kahn et al.
(2006) conduct a systematic review of the geographical variation in the distribution of the causes of maternal deaths. They find that anemia is the second most common cause after hemorrhage in Asia (causing 12 and 30 percent of maternal deaths, respectively).
7,8Unsafe abortion is another direct cause, probably resulting in a significant number of deaths, although precise estimates do not exist due to underreporting and misclassification. Despite abortion having been legalized with the 1971 Medical Termination of Pregnancy Act, many Indian women continue to have illegal abortions performed by unqualified practitioners often in unsanitary conditions. Arnold, Kishor, and Roy (2002) argue that there are several reasons why women do not seek safe and legal abortions. These include that they might want to abort for reasons not allowed by the Act (i.e., abortion for sex selection or due to contraceptive failure); they cannot afford the cost of an abortion performed by a registered medical practitioner at a government-approved facility; or because of the unavailability of such facilities. Even though estimates are likely to be imprecise, Kahn et al. (2006) estimate that abortion contributes to about 6 percent of maternal deaths in Asia.
Although not accounted for in standard estimates, maternal mortality ‘implies not only death
6The other main cause of excess mortality in the reproductive years (between the ages of 15–44) is death due to injuries, while cardiovascular disease is the most common cause among older women (Anderson and Ray, 2010).
7While hemorrhage is found to be the most important cause overall in developing countries, other causes are region-specific, such as sepsis and HIV in Africa, anemia in Asia, and abortion in Latin America.
8Other studies provide higher estimates. For example, Gragnolati et al. (2005) and Kalaivani (2009) state that anemia is responsible for almost one quarter and 40 percent of maternal deaths, respectively.
during childbirth but also concurrent morbidities brought on by the experience of pregnancy and childbirth.’ (World Bank, 2011, p. 128). The global estimate of maternal deaths is considered to be the ‘tip of the iceberg’ since an estimated 10 to 20 million women suffer pregnancy-related physical or mental disabilities every year (Filippi et al., 2006, p.2).
9Maternal morbidities can have long- lasting consequences –potentially affecting women’s survival– that can also lead to impoverishment, violence, stigmatization, and marital instability (Koblinsky et al., 2012). Also not encompassed in the standard definition, other causes of maternal deaths include injuries, accidents, suicide, murder, and domestic violence while women are pregnant (AbouZahr, 2003; Ronsmans and Graham, 2006).
Iron-deficiency anemia is the most common nutritional deficiency worldwide (Mukuria, Aboulafia, and Themme, 2005). It is pervasive in India where it affects 56 percent of ever-married women aged 15–49 (using NFHS-III data). It commonly results from a nutritional deficiency of iron, fo- late, or vitamin B12. It is more prevalent during adolescence, pregnancy and among breastfeeding mothers when nutritional requirements increase substantially (Sharman, 2000; Kalaivani, 2009).
10In addition to indirectly causing maternal mortality, anemia is an important risk factor for other adverse health outcomes including impaired cognitive performance, higher incidence of infection, prenatal and perinatal infant loss, and reduced work capacity (World Bank, 1996; Sharman, 2000;
Gragnolati et al., 2005; Ackerson, and Subramanian, 2008).
Progress has been made in improving maternal health in India (Bhat 2002a; 2002b).
11The maternal mortality ratio declined from 570 in 1990 to 230 in 2008 (WHO, 2010).
12World Bank (2011) states that ‘maternal mortality is fundamentally different from excess female mortality at other ages in that, to reduce it, societies must focus on an intrinsically female condition and specifically on improving the maternal health care system.’ (p. 128). Notwithstanding better health conditions in recent times, many women are still not receiving adequate maternal health care in India.
13The decrease in maternal mortality has not been paralleled by improvements in anemia prevalence. Instead, the incidence of anemia among ever-married women has worsened over time: from 52 percent in 1998 to 56 percent in 2005. Given its magnitude, anemia is an extremely
9Permanent and chronic conditions include obstetric fistula, urinary or faecal incontinence, scarred uterus, pelvic inflammatory disease, palsy. Other main sequelae are severe anemia, eclampsia, and infertility. Psychological obstetric morbidity includes puerperal psychoses, post-partum depression, suicide, and strong fear of pregnancy and childbirth (AbouZahr, 2003).
10Iron needs increase during the second and especially the third trimester of pregnancy. During pregnancy, the required amount of iron is higher than what can be absorbed from the diet, therefore iron supplementation is necessary (Sharman, 2000).
11Safe motherhood is one of the objectives of the 1996 Reproductive and Child Health Programme and the National Population Policy adopted by the Government of India in 2000.
12The maternal mortality ratio is the number of maternal deaths during a given time period per 100,000 live births during the same time-period (WHO, 2010).
13For instance, NFHS-III data indicate that only 39 percent of births take place in health facilities and 58 percent of women did not receive any postnatal check-up after their most recent birth (IIPS and Macro International, 2007).
serious public health issue in India (Gragnolati et al., 2005).
2.2 Fertility behavior and maternal health outcomes
It has been argued that in contexts where the preference for male children is pervasive, parents alter their fertility choices and can exhibit overt discrimination against their unborn and living female children (Das Gupta, 1987; Das, 1987; Clark, 2000; Arnold, Kishor, and Roy, 2002; Jha et al., 2006). Parents can ensure the desired number of sons in two main ways. First, they can avoid the birth of unwanted daughters by eliminating female fetuses through sex-selective abortion.
Several studies have noted that increasing sex ratios at birth in India match the timing of the diffusion of prenatal sex determination technologies in the late 1980s (Arnold, Kishor, and Roy, 2002; Bhalotra and Cochrane, 2010). These and other studies (Das Gupta, 1987, and Jha et al., 2011) have also documented that sex selection is more common among educated women and richer families. Another key finding of this literature is that there is no evidence of sex selection at first birth (Das Gupta, 1987; Bhat and Zavier, 2007; Jha et al., 2011). Second, women can continue childbearing until the desired sex composition of children is reached, commonly known as son-preferring stopping behavior (as women with daughters only are more likely to keep having children) (Chowdhury and Bairagi, 1990; Clark, 2000; Dreze and Murthi, 2001; Arnold, Kishor, and Roy, 2002; Filmer, Friedman and Schady, 2009). Other authors have also shown that a female birth is associated with shorter birth intervals (Trussel et al., 1995; Arnold, Choe, and Roy, 1998), and shorter breastfeeding (Jayachandran and Kuziemko, 2011). In this paper, I use ‘son-preferring fertility behavior’ to refer to both stopping as well as reduced birth interval.
The adverse health consequences of a high number of births and short spacing between births are well documented in the medical literature. A high number of pregnancies is associated with higher lifetime risk of death due to pregnancy.
14Medical research has shown that birth intervals shorter than 24 months are associated with poor child and maternal health outcomes (Setty-Venugopal and Upadhyay, 2002; King, 2003).
15Closely spaced pregnancies increase the risk of maternal nutrient depletion as the mother is not allowed sufficient time to restore the adequate supply of nutrients needed to have a successive successful pregnancy (Sharman, 2000; King, 2003). Conde-Agudelo, and Belizan (2000) use a large cross-sectional dataset covering 456,889 women from 18 Latin American countries and find that, compared to women giving birth at 27 to 32-month intervals, women
14The adult lifetime risk of maternal mortality is defined as “the probability that a 15-year-old female will die eventually from a maternal cause if she experiences throughout her lifetime the risks of maternal death and the overall levels of fertility and mortality that are observed for a given population” (WHO, 2010, pp. 14). It is related to both the mortality associated with a single pregnancy and the number of pregnancies a woman has in her reproductive years (UNICEF, 2008).
15Birth interval (or birth spacing) refers to the time interval (number of months) between births (i.e., the length of time from birth to next conception plus nine months).
with intervals shorter than 15 months (i.e., less than six months from birth to conception of the next child) are: 1.3 times less likely to avoid anemia; 1.7 times less likely to avoid third-trimester bleeding; and 2.5 times less likely to survive childbirth.
16Therefore, short spacing is found to affect maternal mortality both directly and indirectly through increased risk of anemia.
3 Data
The data used in this paper are from the India National Family Health Survey (NFHS) which contains detailed information on women’s entire birth histories, birth intervals (at the child level), health indicators (for children and their mothers), domestic violence, and other demographic and socioeconomic characteristics of women and the households they live in. The NFHSs are repeated cross-sectional surveys for a representative sample of women in India.
17The women sampled for individual interviews in the NFHS are aged 15–49, and I consider the sample of all those who had at least one child ever born. Moreover, I exclude women with 9 or more children ever born to reduce heterogeneity due to women with extraordinarily high fertility (the 98
thpercentile of the pooled sample of women).
18I pool the three available surveys, conducted in 1992/93 (NFHS-I), 1998/99 (NFHS-II), and 2005/06 (NFHS-III).
Using the pooled NFHS birth history data, the sex ratio at birth (here defined as the fraction of male births) is 0.519 for first births and 0.521 for all births. Among women who had their first birth during the ten years before the survey the sex ratios for first and all births are 0.513 and 0.518, respectively.
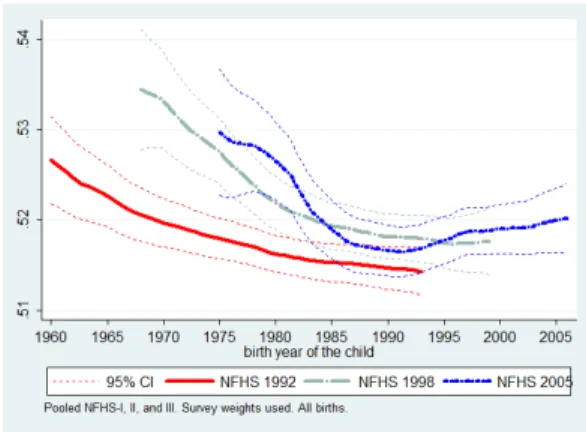
19,20Figures 1 and 2 show the sex ratio at birth (for
allbirths) by birth year in the pooled dataset and separately by survey year, respectively. Pooling different survey rounds allows me to distinguish between age and cohort-specific effects. The figures show a decreasing trend of
16see Conde-Agudelo, Rosas-Bermdez, and Kafury-Goeta (2007) for a review of medical studies on the relationship between birth spacing and maternal health.
17While NFHS-I and II only interviewed ever-married women, NFHS-III includes those never married. To ensure comparability, I exclude never married women from the analysis. Since I only consider women with at least one child ever born (the vast majority of whom are or have been married), the fraction of excluded women is quite small: 72 women, equivalent to 0.02% of all women interviewed in NFHS-III.
18Total fertility rate (TFR) in the NFHS-III is 2.7, down from 3.4 in NFHS-I. Therefore, on average, an Indian woman in NFHS-III will give birth to 2.7 children by the end of her childbearing years. The TFR is based on age-specific fertility rates during the three years preceding the survey (IIPS and Macro International, 2007).
19The biologically “normal” sex ratio at birth ranges from 1.03 to 1.06 (male to female births), corresponding to a fraction of male births approximately in the range of 0.507 – 0.515 (Arnold, Kishor, and Roy, 2002).
20Sex ratios have been found to be affected by several biological, environmental, and genetic factors (other than behavioral factors). These include improvements in maternal health status (Bhat 2002a), mother’s malnutrition (Mathews, Johnson, and Neil, 2008; Almond and Mazumder, 2011; Andersson and Bergstrom, 1998), prevalence of Hepatitis B (Oster, 2005), birth order, timing of conception, hormonal conditions (James, 1987). Some of these biological factors and how they might affect the findings of this paper are discussed in more detail in section 6.1.
the sex ratio which is common to all the survey rounds, independently of the cohort of birth of the child, and not specific to a particular period.
21The most recent survey (NFHS-III) also shows an increasing sex ratio at birth starting from the end of the 1980s onward, which corresponds to the timing of the diffusion of ultrasound technologies (also consistent with the sex ratio in the Indian Census). Figure 3 shows that the decreasing trend is specific to first births, while the sex ratio for higher-order births is somewhat stable throughout the whole survey period and significantly higher than that for first births in 1980 and after. This is further indicative of the use of sex selective abortion, known to be much more common among higher order births. Indeed, pooled NFHS data on parental gender preferences indicate that, albeit more than one third of ever-married women want to have more sons than daughters (compared to only 2.5 percent who want more daughters than sons), more than 80 percent of them want
at leastone daughter and about 86 percent want
at leastone son.
22Moreover, 42 (14.5) percent desire at least two sons (daughters).
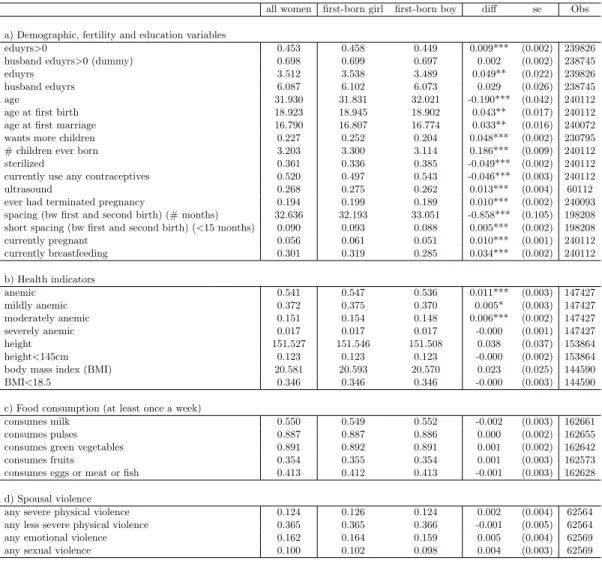
Table 1 reports summary statistics for the pooled sample of ever-married women aged 15–49 by the sex of their first-born (refer to the data appendix for a description and availability of these variables in the NFHSs).
23Panel (a) reports socio-demographic and fertility-related variables.
Most characteristics differ significantly between the sample of women with a first-born girl and a first-born boy. In particular, the table shows that women with first-born girls are significantly more likely to be educated, to have married and had their first child later in life, to have (and desire to have) more children, to use contraception (and have undergone permanent sterilization)
24, to have performed a prenatal ultrasound test, and to have had a shorter spacing between the first
21Rosenblum (2013) uses the 2002-2004 Reproductive and Child Health Survey (RCH-II) and finds a similar pattern:
higher sex ratios for births occurred in the past, especially for lower birth orders. He tests for the exogeneity of the sex of the first born, discusses potential recall or survival bias in the data (without attempting to test or disentangle the two), and argues that the extent of the bias is small.
22These figures are based on the NFHS question about the number of children women would like to have if they could go back to the time before they started childbearing. NFHS-III indicates that average ideal family size among ever-married women is 2.5 children (down from 2.9 in NFHS-I). Interviewed women were also asked the ideal sex composition for these children: in NFHS-I they indicated 1.6 sons, 1.1 daughters, and 0.2 of either sex, while in NFHS-III 1.2 sons, 0.9 daughters, and 0.4 of either sex.
23All the estimates shown in this paper have been computed using sample weights provided by the NFHS. Given that three surveys were conducted in different years, the sample weights used in the pooled sample have been multiplied by the fraction of the total female population aged 15–49 in India (obtained from the United Nations Population Division World Population Prospects: 2012 Revision,http://esa.un.org/wpp/Excel−Data/population.htm) and the number of women aged 15-49 interviewed in each survey round.
24Knowledge of contraception is nearly universal among ever-married Indian women in NFHS-III: 99.2% of women know one or more methods of contraception and current use is 55% (up from 98.9% and 45.3% in NFHS-II, respec- tively). Female sterilization, with a prevalence of 37%, is a permanent contraception method (tolimit the number of births) that accounts for 67.4% of all contraceptives used. The highest adoption rate of female sterilization, is among women with three children who have two sons. The most common spacing methods are condoms and the rhythm method, each used by 5% of women (NFHS-III data).
and second birth. The differences found in the variables related to fertility behavior are a direct consequence of pervasive son preference in India, while those in the education and demographic variables (arguably predetermined to first birth) are indicative of selection among women with a first-born girl. Panel (b) of table 1 reports summary statistics for health indicators and shows that, compared to women with a first-born boy, those with a first-born girl are more likely to be anemic.
Panels (c) and (d) show that there are no significant differences between women by the sex of their first-born child in terms of food consumption or violence perpetrated by husbands against them.
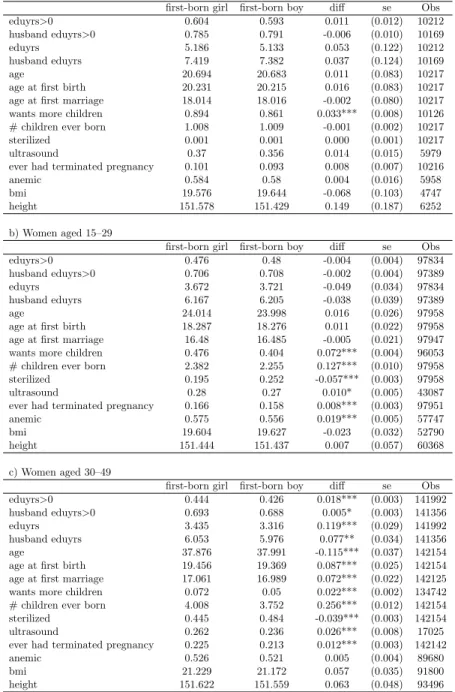
Table 2 reports selected summary statistics for three subsamples of women (by the sex of their first-born child): those who had their first birth less than a year before the time of the survey, and the 15–29, 30–49 age groups. The idea is to understand the timing of the emergence of the differences highlighted in table 1. If the sex of the first-born is random at birth but subsequently affects women’s fertility behavior (as has been documented in places with son preference), there should be no observed differences among women with first-born girls and boys close to the time of their first birth. Differences should instead emerge and widen over time as women engage in son-preferring fertility behavior.
25As conjectured, panel (a) shows that, except for the desire to have more children (expected to be immediately affected by the sex of the first-born), all the other variables are balanced between the two samples. Panel (b) considers women aged 15–29 (who are in their most active reproductive years) and shows that, while there are no significant differences in terms of predetermined variables (education, age at first birth and marriage), fertility behavior and anemia status are significantly affected by the gender of the first-born. Panel (c) shows that most of the observed differences in table 1 emerge among women aged 30–49. Women with a first-born girl in this age group also have better educated husbands and show no differential incidence of anemia.
This evidence confirms that women are similar at the time of first birth and develop differences over time as a likely result of son-preferring fertility behavior. In fact, they appear to respond to a first female birth by having substantially more children and shorter spacing, using contra- ceptives less often, and exhibiting a higher probability of having had an ultrasound test and a terminated pregnancy. This behavior increases their risk of mortality and morbidity (especially after repeated pregnancies and unsafe abortions). It is therefore likely that women who engage most in son-preferring fertility behavior and have lower access to safe abortion –typically women of lower socioeconomic status– are more likely to die. This selection effect might explain the observed differences (especially in the predetermined variables) among living women by the sex of their first child as well as the decreasing sex ratio for first births. More evidence in support of this channel will be shown in the next sections.
25This approach is conceptually similar to Barcellos, Carvalho, and Lleras-Muney (2014) who study gender differ- ences in parental inputs in India by restricting the analysis to families with children who are still young to account for the effect of child gender on family size.
4 Nonparametric evidence
This section examines the age structure and health status of women by the sex of the first-born by using kernel-weighted local polynomial regressions. The resulting smoothed values are displayed in graphs with 95% confidence intervals. The age range of women considered in this section is 20–49.
264.1 Share of women with a first-born girl
The nonparametric graphs in this section plot the share of women with a first-born girl by their age at the time of the survey. This share is simply the inverse of the sex ratio for first births. Therefore, rather than plotting the sex ratio by birth year of the child (done in section 3), the following graphs show the age distribution of women with a first-born girl (due to pooling, these are independent of cohort effects, except for non-overlapping years of the NFHSs).
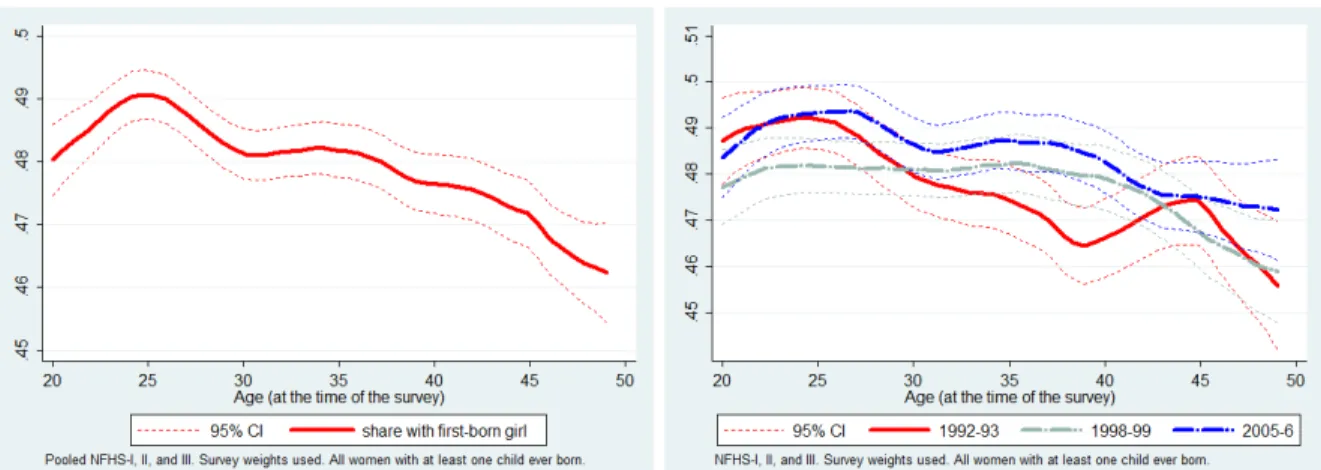
The left panel of figure 4 shows that the sex ratio for first births is in the biological range for women below the age of 30 (including the confidence bands). However, the share of women with first-born girls decreases almost monotonically for women older than 30, where it is below the biological range. This is equivalent to saying that, among women with at least one child ever born, the share of those who had a first-born girl is lower among older women, particularly among those older than 30. The right panel shows that the same pattern is found in each round of the NFHSs (though with larger confidence bands and more fluctuation likely due to smaller sample sizes when using each survey separately). Interestingly, the upper graph in figure 5 shows that the decreasing pattern is found only among women who did not complete any years of schooling, while the share is rather stable for women with at least one year of education at all ages.
27Similar patterns are found when using each NFHS round separately (see bottom two graphs in figure 5).
28Considering education as a plausible proxy for socioeconomic status, this suggests that poorer women suffer higher maternal and adult mortality. Having lower access to health services (and in particular to prenatal sex diagnostic techniques in more recent decades), uneducated women may rely more heavily on son-preferring fertility behavior to achieve the desired sex composition of children and thus suffer the adverse consequences on their health and survival.
State-wise variation.
There is substantial state-wise variation in sex ratios at birth and excess mortality in adulthood within India. Anderson and Ray (2012) find a distinctive pattern: gender
26Women aged 15–19 are dropped because of very large confidence bands due to a small fraction of them who already has had a birth –these represent 4.5% of the entire pooled sample.
27In Milazzo (2012), I find similar patterns when using DHS data for Nigeria. Compared to India, this is a context in which women are also found to engage in son-preferring fertility behavior (though not as strongly), and where the lifetime risk of maternal mortality is higher.
28Appendix figure A.1 also shows a decreasing pattern for women in rural areas (not found in urban areas).
bias at birth is highest in the North-West where excess female mortality among adult women is in turn relatively low (the “Group 1” states), while North-Eastern states have low gender bias at birth together with the highest excess female mortality in adulthood (the “Group 2” states). Southern states, like Kerala, exhibit the lowest excess female mortality in India (for this reason, Kerala was used as an alternative benchmark in their analysis). This evidence is confirmed by official statistics on sex ratios (2011 Indian Census) and maternal mortality (Office of the Registrar General India, 2011).
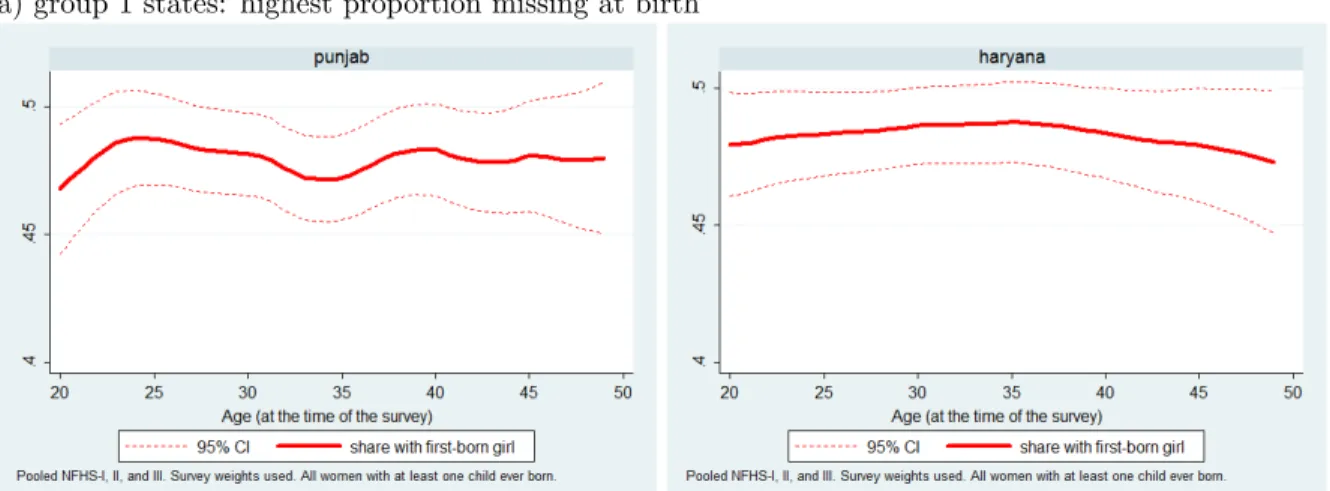
29Two North-Western states, Punjab and Haryana, have the most male-biased sex ratio at birth of all Indian states. At the same time, they have below-national-average maternal mortality ratios. On the other hand, Assam and Bihar in the North-East have below-national-average (i.e., less male-biased) sex ratios at birth and are among the states with the highest maternal mortality ratios in India.
Figure 6 shows the share of women with first-born girls by age in Punjab, Haryana, Assam, Bihar, and Kerala. Panel (a) shows that Punjab and Haryana exhibit a steady share of women with first-born girls at all ages. Assam and Bihar, shown in panel (b), exhibit a strikingly different pattern: the share of living women with a first-born girl is steeply decreasing with women’s age.
This is consistent with high prevalence of sex-selective abortions in the North-West (reflected in skewed sex ratios at birth) and higher maternal mortality in the North-East. Finally, as expected, Kerala shows a rather flat pattern, consistent with low excess female mortality across all age groups.
While more research is warranted, this paper offers a possible explanation for the apparent puzzle singled out in Anderson and Ray (2012). This is based on differential prevalence of sex selective abortion and son-preferring fertility behavior (as the two main ways through which parents can achieve the desired sex composition of children) across the states of India.
4.2 Health indicators
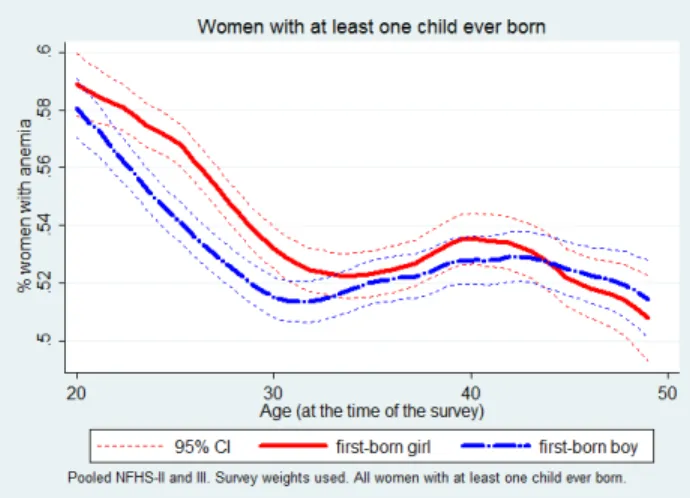
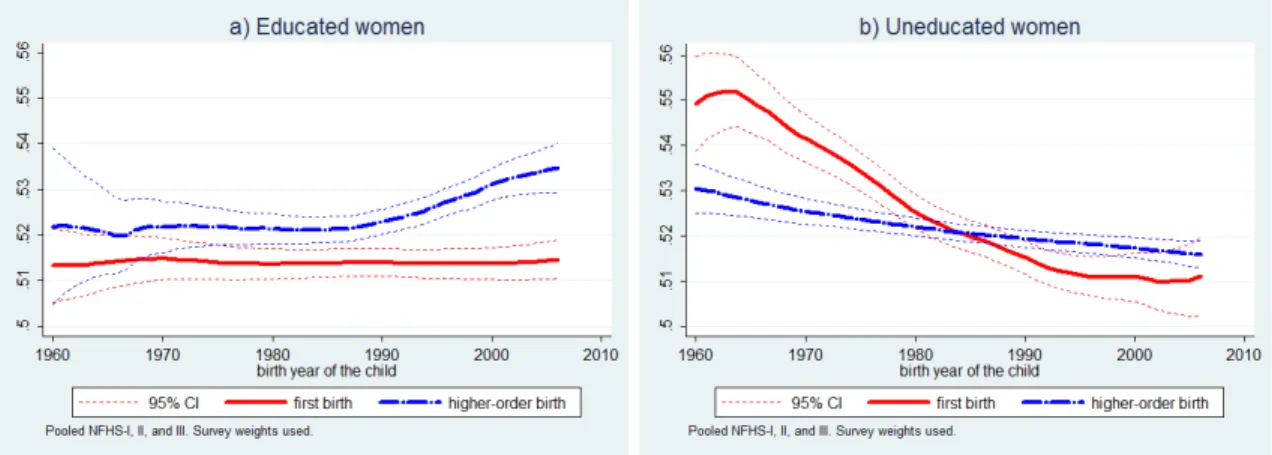
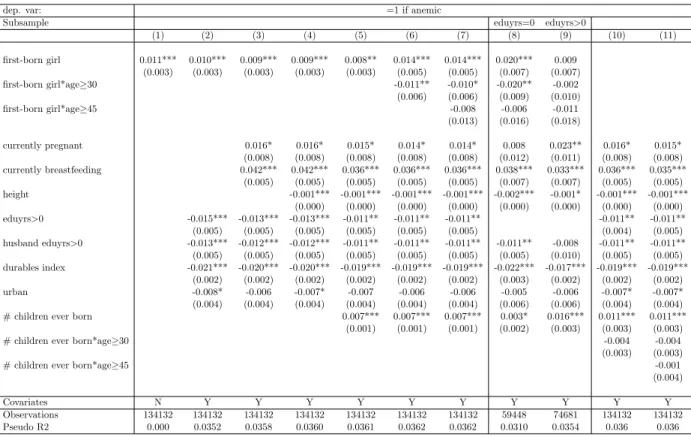
Turning to health indicators (available only in NFHS-II and III), figure 7 shows the incidence of anemia by the sex of the first-born and women’s age at the time of the survey.
30The general age pattern reflects the fact that anemia is typically higher during adolescence and the reproductive years due to higher physiological demand for iron while pregnant and lactating (Sharman, 2000;
Mukuria, Aboulafia, and Themme, 2005). Notably, the figure shows that the incidence of anemia is significantly higher among women with a first-born girl (compared to women with a first-born boy) approximately up to age 30, while there is no differential incidence for older women.
Intuitively, this result might be the consequence of son preference: women with first-born girls tend to be pregnant (or breastfeeding) more often during their reproductive years than women who have first-born boys. Although higher iron needs during pregnancy are accounted for in the NFHS
29The sex ratio from Census data refers to all children aged 0 to 6.
30For a description of how hemoglobin testing is conducted in the NFHS and DHS surveys refer to Sharman (2000).
definition of the hemoglobin cut-off value for anemic women
31, I replicate the same graph using the subsamples of women who are not currently pregnant or breastfeeding (cut-off values are not different for lactating women). Appendix figure A.2 shows that the patterns are found also in these subsamples. This suggests that differential incidence of anemia between women with a first-born girl or boy may be driven by short birth spacing (or past pregnancies).
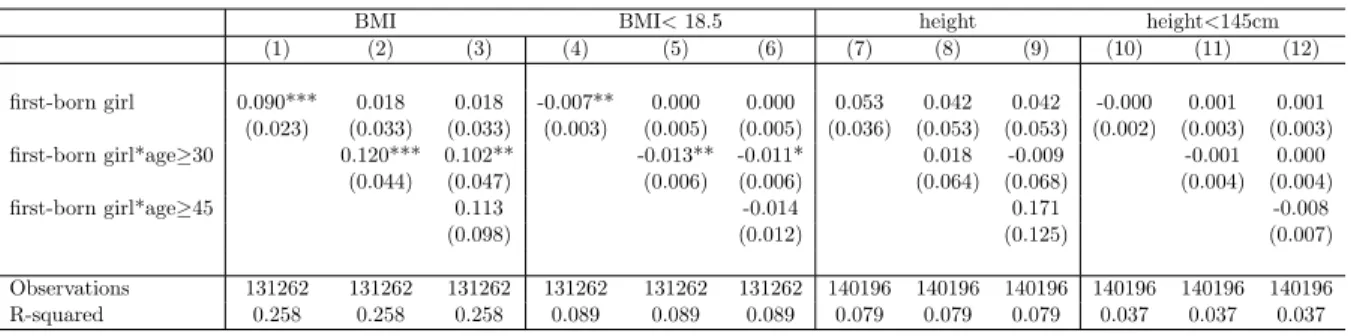
Figure 8 shows a graph for BMI. Overall, BMI increases with women’s age (within the range of 19 to 22).
32There are no apparent differences in BMI by the sex of the first-born for women below age 40. It is also worth noting that the BMI index excludes women who are pregnant at the time of the survey and who gave birth less than three months before the survey (IIPS and Macro International, 2007). Among older women, those with a girl as first-born child show a slightly higher nutritional status.
33Lastly, figure 9 reports a graph for height. Height reflects nutritional status in childhood and adolescence and therefore should be affected by fertility behavior to a lower extent than other nutritional indicators that are not predetermined to first birth. Yet, mortality selection might also entail higher survival possibilities for taller women who have been better nourished during childhood (similarly to Bozzoli, Deaton, and Quintana-Domeque, 2009). Moreover, taller women are more likely to be from a higher socioeconomic status and thus enjoy better access to prenatal diagnostics. The figure shows that, as expected, there are no height differences among younger women with a first-born girl or boy, while there is some weak evidence that older women with first-born girls are taller (especially above age 45).
5 Empirical strategy and results
This section first discusses the identification assumption, then explores how the sex of the first-born affects fertility behavior, and lastly examines the age structure and anemia status of women using parametric analysis.
5.1 Identification assumption
As shown in table 2, women with a first-born girl or boy do not exhibit significant differences in terms of observable predetermined characteristics close to the time of first birth or when they are
31A woman is defined as being anemic if the measured hemoglobin count is of less than 12 grams per deciliter (cut-off for all women) and less than 11 grams for pregnant women.
32The BMI is defined as weight (kg) divided by height (m2). A cut-off point of 18.5 is used to define chronic energy deficiency and a BMI of 25 or above indicates overweight (IIPS and Macro International, 2007).
33While the association between fertility behavior and anemia status is widely documented in the medical literature, BMI is not among the outcomes mentioned in a review of the literature on the effects of short spacing (Conde-Agudelo, Rosas-Bermdez, and Kafury-Goeta, 2007). Evidence that mother’s malnutrition at conception might affect the sex ratio is discussed in Section 6.1.
relatively young. The randomness of the sex of the first-born is in fact widely supported. First, as previously noted, several studies document that sex-selective abortion is much more common among higher-order births. Second, the vast majority of Indian parents want at least one daughter.
Third, data from the NFHS indicate that the sex ratio for first births during ten years before the time of each survey is in the normal range. The sex ratio for
firstbirths after 1990 (timing of the diffusion of ultrasound testing) is 0.514, which is in the biological range.
34It is in the normal range even for educated women (known to practice more sex-selection): among educated (uneducated) women the sex ratio for first births is 0.515 (0.513). Section 6.3 provides additional evidence that sex-selection is not practiced at first-birth.
Given possible selective mortality (most visible in the subsample of older women in panel (c) of table 2), the empirical strategy relies on the assumption of
conditionalexogeneity of the sex of the first-born child. All the regressions for women’s fertility behavior control for a vast set of observable characteristics. The analysis of women’s health status additionally focuses on women who recently had their first birth and are therefore not yet selected.
It is important to note that selective mortality would lead to underestimate the effect of a first-born girl on fertility. This is because women who did not survive (and therefore do not appear in the data) are probably the ones who suffered the most the consequences of an ‘extreme’ fertility behavior due to son preference (both because of poorer health and access to maternal care).
5.2 Mechanism: Fertility behavior and sex of the first-born child
5.2.1 Fertility regressionsAlthough most Indian women want more than two children, the sex of the first-born still affects the fraction of male children they can have through their lifetime. In fact, as previously noted, more than a third of women want more sons than daughters and more than 40 percent want at least two sons. To examine desired and realized fertility as well as other outcomes that are likely to be affected in contexts with son preference, I estimate the following regression under the assumption of conditional exogeneity of the sex of the first-born.
yi,s,b,r
=
β1 f gi+
β2 f gi ∗edui
+
β3 edui+
γXi,s,b,r+
αs+
µb+
δr+
i,s,b,r(1) with woman
i, resident in state s, born in year b, surveyed in round r. yi,s,b,ris the dependent variable, alternatively a dummy for whether the woman currently reports the desire to have more children, a dummy for whether she has been sterilized, whether she has undergone ultrasound
34The sex ratio forall births occurred after 1990, including those of higher-order is 0.519.
testing, whether she has ever had an abortion, and the number of children ever born.
35 f giindicates whether the first child ever born is a girl,
eduiis a dummy variable equal to one if the woman completed at least one year of education, zero if she has completed none,
f gi∗eduitests whether the effect is heterogeneous between educated and uneducated women,
Xi,s,b,ris the set of covariates including: age of the woman and her partner (and age squared), seven five-year age groups, age at first marriage, age at first birth, whether the woman’s partner completed one or more years of education, woman’s religion and caste, a wealth index, and a urban dummy.
36,37 αs,
γb,
δrare state, birth year, and survey round fixed effects, respectively. All the regressions (except that for the number of children ever born) also include the number of live births. Since most of the younger women in the sample have not completed their fertility, I restrict the sample to women who have been sterilized or who report they do not want more children when estimating the regression for the number of children ever born. Regression 1 is estimated using a probit model for binary outcomes, and a linear model for the other dependent variable.
If women’s fertility behavior is affected by the sex of the first-born and this is due to son preference,
β1is expected to be positive in the regressions for desired (and realized) fertility, ultra- sound testing, and abortion, while
β1should be negative for the use of sterilization. In terms of heterogeneous effects, predictions are as follows.
38Women’s desire for having more children after the birth of a first girl should not differ much between educated or not as they both have strong incentives to try to conceive again for a boy. All women are expected to seek sterilization when the desired sex composition of children is reached. The use of sterilization is in fact widespread among all women irrespective of their education (often women in rural areas have access to ‘sterilization camps’). The use of ultrasound testing is instead part of the routine antenatal care for most edu- cated women (especially those with high education: 74 percent of women with more than 10 years of education in NFHS-III performed the test), but is only rarely undergone among the uneducated.
Given their high access to prenatal maternal care, educated women are not expected to resort more to ultrasound testing in response to a first-born girl than the uneducated (since most educated do
35The number of children ever born includes all live births to each woman, including dead children and children living elsewhere. Compared to the number of surviving children, this is a more pertinent measure of fertility as it is not affected by differential mortality potentially affected by son preference.
36The caste and religion variables are from the woman dataset. Caste includes Scheduled Caste, and Scheduled Tribe (other backward classes (OBC) and other castes are the omitted category). Religion includes Hindu, Sikh, Muslims, Christian (Buddhist, Jain, and other religions are the omitted category).
37The wealth index is a principal component index of services and durable goods owned by the household, including electricity, radio, television, refrigerator, bicycle, motorcycle, and car.
38Average values of the independent variables for educated and uneducated women are as follows: 21 and 24 percent for the desire to want more children, 38 and 35 percent for female sterilization, 40 and 10 percent for ultrasound testing, 21 and 18 percent for terminated pregnancy, and 2.9 and 4.2 children ever born (the latter calculated on the sample of women who have been sterilized or do not want to have more children), respectively.
it irrespective of the sex of the child).
39In turn, the educated are expected to be more likely to selectively abort after a first-born girl, consistent with existing evidence. The uneducated may still practice abortion but, being generally poorer, it is plausible to think that they might seek illegal abortion, probably underreported. The sign of the differential effect on the number of children is a priori ambiguous. The uneducated have higher ideal and realized family size so, given the number of children, they have higher chances to have a son, and the educated will have more children too if they do not practice sex selection at low birth-order. At the same time, the uneducated can keep having children if they have no sons, or have an abortion performed.
Table 3 reports the results. The first column shows the unconditional estimates for each of the outcomes studied. Column (1) shows that, compared to women with a first-born boy, women with a first-born girl are 4.9 percentage points more likely to desire more children (the effect is significant at 1% level). Column (2) shows that the effect is slightly higher at 5.1 percentage points (equivalent to a 25 percent effect relative to the average for women with a first-born boy) after conditioning for all the observables and fixed effects. Column (3) explores heterogeneous effects: women with at least one year of education are on average less likely to say they want more children, but the effect of a first-born girl is not statistically different than for uneducated women (who have a higher desired number of children to start with). A first-born girl substantially decreases the probability that a woman is sterilized (columns 4–6). The effect is of 6.8 percentage points (column (5), equivalent to a 18 percent effect). The effect on sterilization does not appear to differ significantly for women with education. Column (8) shows that women with a first-born girl are 2.5 percentage points more likely to have had an ultrasound test for their most recent births. This effect is significant at 1%
level and equivalent to a 9.5 percent effect. Educated women are more likely to have undergone ultrasound testing as part of their antenatal care. This reflects their higher access to health care relative to poorer uneducated women. As expected, the increase in the probability of an ultrasound test after a first-born girl does not differ between educated and uneducated women. As can be seen in column (11), an abortion is 1.1 percentage points (significant at 1% level) more likely for women with first-born girls (equivalent to a 5.8% percent effect). Column (12) shows that education is positively associated with the probability of having ever had a terminated pregnancy, and that this effect is stronger for women with a girl as first-born child (the estimate for the interaction term is 1.4 percentage points, significant at 1% level). Although uneducated women are also more likely –thought to a smaller extent– to have had an abortion after a first-born girl, this result confirms findings from the existing literature documenting that sex-selective abortion is more common among the educated. A nonparametric plot of the likelihood to have ever had a terminated pregnancy by sex of the first-born and age reveals that, among the uneducated, a first-born girl has an effect only
39The use of ultrasound testing seems to be motivated by the early detection of abnormalities for first-born children, and by sex-selection for higher-order births (Bath and Zavier, 2007).
after age 30 (while among the educated an effect is visible also among younger women) (appendix figure A.3). This is consistent with poorer women selectively aborting a female fetus later in life, probably when the costs of having an additional daughter become unsustainable (i.e., dowry costs).
40However, as the variable for terminated pregnancy does not distinguish among the reasons for termination (e.g., miscarriage, abortion, or stillbirth), it is important to consider this evidence as only indicative of higher recourse to induced abortion for sex selection.
41Column (13) shows that women with first-born girls unconditionally have 0.301 more children ever born, 0.295 after including all the controls (both significant at 1% level). The latter estimate implies a 8.7 percent effect. As expected, the effect is statistically different for educated women for whom the effect of a first-born girl on fertility is attenuated. Appendix table A.1 additionally estimates the effect of the sex of the first two or three children on fertility outcomes of women who had at least two or three live births. Consistent with increasing pressure for giving birth to a male child, additional daughters after the first substantially increase the effects on all the examined outcomes.
Altogether, these results suggest that the sex of the first-born strongly affects women’s fertility behavior, and that educated women tend to rely more on sex-selective abortion, while uneducated women rely on son-preferring fertility behavior.
5.2.2 Birth spacing regressions
The NFHS reports the entire fertility history of each woman. I exploit information on the length of the interval between successive births. The idea is to test whether women with a first-born girl try to conceive the following child sooner than women with a first-born boy.
In a first step, I estimate whether the spacing between first and second child is affected by the sex of the first child, as well as whether the interval between second and third child is affected by the sex of the second child (conditional on the first child being a girl). To do this, I use a regression similar to equation 1, in which the dependent variable is either the number of months or the probability of an interval shorter than 15 months. To evaluate the effect of the sex of the first-born, I first restrict the sample to women with at least two children ever born (who report at least one birth interval), and then to the sample of women with at least three children ever born for the effect of the sex of the second child.
The availability of birth histories allows a second empirical strategy that exploits the variation in the length of the interval and the sex of the child
withinthe reported history of each woman.
This is done with mother fixed effects. However, this methodology does not allow the estimation
40It is also consistent with a higher probability of miscarriage for women engaging in son-preferring behavior.
41Only NFHS-II provides some more details on whether the abortion was spontaneous or induced. Evidence suggests that at least some of the abortions reported as spontaneous are instead induced (due to misreporting) (Arnold, Kishor and Roy, 2002).
of the effect of the sex of a child at a specific birth order and identification requires restricting the sample to all women with at least three children ever born. I estimate the following regression:
yi,j,(k−1,k)
=
β1 girli,j,k−1+
Xk
γk bi,j,k
+
χj+
i,j,k−1(2)
with child
i, motherj, birth orderk. yi,j,(k−1,k)is the time interval (between birth of child
k−1 and
k), expressed in number of months or as a dummy variable equal to one if the interval is shorterthan 15 months.
girli,j,k−1is a dummy equal to one if the sex of the child
k−1 is female.
bi,j,kare
kdummies for each birth order.
χjdenote mother fixed effects. I exclude births of birth order four and higher to evaluate the effect of the sex of earlier-born girls on spacing. This regression is estimated using the entire sample, and the subsamples of uneducated and educated women. If there is son preference, the birth interval is expected to be shorter (β
1 <0) after a girl is born compared to a boy. This regression is estimated using a linear model for the number of months, and a probit model for the probability of having an interval shorter than 15 months.
A potential source of bias in the regressions for birth spacing is represented by the practice of sex-selective abortion. This is because female fetuses are especially likely to be selectively aborted after a first-born girl. It is important to note that this would generate downward biased estimates of the (negative) effect of a first-born girl on the length of the birth interval since more time will be needed to have a completed pregnancy following an abortion. This is especially the case for educated women who are much more likely to have had a terminated pregnancy after a first-born girl than the uneducated.
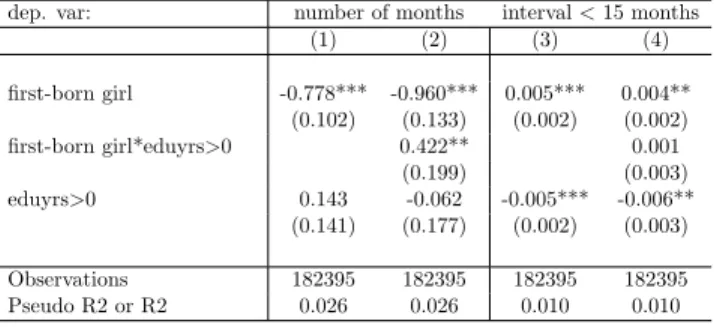
42Table 4 shows the results of the regression without mother fixed effects (number of months in columns (1)–(2), and probability of a short interval in columns (3)–(4)). Panel (a) shows the effect of a first-born girl on the time to the next birth. Conditional on the covariates, women with a first-born girl wait 0.8 months less compared to women with a first-born boy (significant at 1% level, and equivalent to a 2.4 percent effect). Column (2) explores heterogeneous effects. A first-born girl reduces the interval particularly for uneducated women, while among the educated the effect is significantly attenuated. This is consistent with educated women with a first-born girl aborting if the next fetus is detected to be a female. Columns (3)–(4) show that, while education is on average significantly and negatively associated with the probability of a short birth intervals, a first girl increases the probability of a short interval by 0.5 percentage points (significant at 1%
level, and equal to a large 5.7 percent effect), and this effect is not different between educated and
42As a check, I added the variable for having ever had a terminated pregnancy as a control in the regressions (without mother fixed effects) and the results for birth spacing are consistently stronger. However, as previously noted, this variable probably underestimates the prevalence of induced abortions, due to under-reporting especially if performed illegally.
uneducated women. The effect of a second-born girl on the birth interval conditional on having a first-born girl is shown in panel (b). Again, the time interval is significantly reduced after the birth of a second girl (column (1)), and now the effect is only found among uneducated women (column (2)). Moreover, the birth of two consecutive girls increases the probability of a short interval by 0.8 percentage points (significant at 1% level) (column (3)). This effect implies a 8.7 percent effect.
Similar to the result in column (2), the effect on short spacing is almost doubled in magnitude (1.5 percentage points and significant at 1% level) for uneducated women (column (4)). The net effect is instead negative for women with at least one year of education.
Table 5 shows the estimates including fixed effects at the mother-level. The first column shows the estimated effect of having a girl at first or second order on the length of the interval to next birth. The coefficient is -0.60 months (significant at 1% level) for all women, -0.63 and -0.50 for uneducated and educated women, respectively (columns (2) and (3)). Columns (4)–(6) show that the birth of a girl increases the likelihood of a short interval by 0.5 percentage points (significant at 1% level), which is equal to the estimate obtained without mother fixed effects (column (3) of table 4). As expected and consistent with estimates in table 4, an effect (equal to 0.6 percentage points) is found only in the subsample of uneducated women.
This evidence is again consistent with educated women being more likely to turn to sex-selective abortion while uneducated ones to son-preferring fertility behavior with associated health risks.
5.3 Outcomes: Age structure and women’s health outcomes
5.3.1 Age structureTo confirm the nonparametric evidence shown in figure 4, I estimate an ordered logit model in which the dependent variable is a categorical variable with seven five-year age groups (from 15–19 to 45–49). The controls are the same as in regression 1. After estimating the ordered logit model, I compute changes in the predicted outcome probabilities when the independent variable ‘first-born girl’ changes from 0 to 1, with all the other independent variables set at their mean value. Changes are reported with 95% confidence intervals computed with the delta method. Column (1) and (2) in table 6 show the changes in the predicted probabilities and the 95% confidence bands, respectively.
The results confirm that the age distribution for women who had a first-born girl lies to the left of the distribution for women with a first-born boy, conditional on the number of children and all other covariates (set at their mean).
5.3.2 Health outcomes