Age at First Birth, Fertility, and Contraception in Tanzania
PDF-Version der Dissertation Dissertation
zur Erlangung des akademischen Grades doctor philosophiae
(Dr. phil.)
eingereicht an
der Philosophischen Fakultät III der Humboldt-Universität zu Berlin von:
Innocent Ngalinda
Masters of Arts in Population Studies geboren am 5.7. 1962
in Tansania
Präsident der Humboldt-Universität zu Berlin Prof. Dr. Hans Meyer
Dekan der Philosophischen Fakultät III Prof. Dr. Hartmut Häussermann
Gutachter: 1. Prof. Dr. Rainer Münz 2. Prof. Dr. Heinz Fassmann
Tag der mündlichen Prüfung: 8.12.98
HUMBOLDT UNIVERSITY OF BERLIN DEPARTMENT OF DEMOGRAPHY
PHILOSOPHICAL FACULTY III Doctor of Philosophy
ABSTRACT
AGE AT FIRST BIRTH, FERTILITY, AND CONTRACEPTION IN TANZANIA by Innocent Ngalinda
The first visible outcome of the fertility process is the birth of the first child. The first birth marks a woman’s transition into motherhood. It plays a significant role in the future life of each individual woman and has a direct relationship with fertility. The age at which child bearing begins influences the number of children a woman bears throughout her reproductive period in the absence of any active fertility control. For countries in sub-Saharan Africa, where contraceptive use is relatively low, younger ages at first birth tend to boost the number of children a woman will have. However, even when family planning is widespread, the timing of first births can affect completed family size if contraception is used for spacing but not for limiting fertility.
The birth of a child is an event of great social and individual significance and its importance is recognised in all human societies. It signifies the transition of a couple into a new social status, i.e. parenthood with its related expectations and responsibilities. It marks the sexual and social maturity of the mother and the visible consummation of sexual intercourse .
The relationship between age at first birth and overall fertility in developing countries is generally an underdeveloped area as far as demographic research is concerned. Fertility analysts generally assume that child bearing only occurs within marriage. Then they treat age at first marriage to be a major proximate determinant of fertility. This assumption might have been true in most traditional societies, where births out of wedlock were not accepted and virginity was a prerequisite for marriage. This assumption, however, does not hold true in modern times, where a large number of children is born outside marriage. These facts have been the major motive of conducting the current research.
This study examines the reproductive behaviour of Tanzanian women. The study found the average age at first sexual intercourse to be 16 years; age at first marriage to be 17 years, while average age at first child bearing was estimated to be 18 years. By age 15, almost 10 percent of juvenile women have given birth. This study furthermore found that 41 percent of all first live births resulted from premarital conceptions. Out-of-wedlock births account for 24 percent of all first births in Tanzania according to the 1996 TDHS.
The education of a woman, place of residence, and religion play the greatest roles in influencing age at first birth in Tanzania. The striking results were place of residence as it was found that rural residents have a higher mean age at first birth than women living in Dar es Salaam. Dar es Salaam women has the lowest mean age at first birth. Moslems
have lower age at first birth than Catholics. There is also a strong relationship between age at first birth and age at first intercourse also with infant and child mortality. The results indicate that the younger the age of the mother at the birth of the first child, the higher the chances that the child dies.
The study of current levels and trends of fertility showed that, on the average, a Tanzanian woman bears 6 children. Between the 1960s and early 1980s, an average of 7 births per woman prevailed in Tanzania. The declining fertility in Tanzania was confirmed by the analysis of the decomposition of the change of the total fertility rate (TFR) between two TDHSs. It found that natural fertility control is being gradually replaced by contraceptive use although the percentage of women using contraception is still very low. The reduction in infant and child mortality, rising numbers of women attending schools, and a rise in age at first birth are among the factors responsible for the decline in fertility in Tanzania.
Education on the other hand has played a major role in raising age at first birth. Education either delays first intercourse and subsequently birth as pregnant schoolgirls are prohibited to attend formal schools or it effects the acceptance of contraception to delay first conception. Specifically, this study establish that there is an inverse relationship between age at first birth and fertility. Marriage is a weak factor in explaining fertility in Tanzania. Women in polygamous unions had fewer number of children ever born than those in monogamous unions in Tanzania. Moslems have a lower fertility than Catholics. Women residing in urban areas have fewer children than those in the rural areas.
Women's education is the strongest predictor of the use of contraceptives in Tanzania.
Catholic women are less likely to use contraceptives than Moslems. Tanzanian women residing in rural areas are less likely to use contraception than their counterparts residing in urban areas. Although age at first birth did not show any significance, age at first intercourse, age at first marriage and current age are highly related to contraceptive use.
Variation in age at first sexual intercourse; marriage; and birth, and the extent of practising contraception are found to depend mainly on religion, place of residence, and the age of a woman. It is important therefore to design separate programmes to raise age at first birth and to lower fertility according to the findings related to religion, place of residence, and target juvenile women separately.
Table of Contents
1. INTRODUCTION... 13
1.1. BACKGROUND TO THE STUDY... 13
1.2. RESEARCH PROBLEM... 21
1.3. RATIONALE... 24
1.4. OBJECTIVES... 27
1.5. ORGANISATION OF THE THESIS... 28
2. ANALYTICAL FRAMEWORK AND LITERATURE REVIEW ... 30
2.1. INTRODUCTION... 30
2.2. CONCEPTUAL FRAMEWORK... 30
2.3. LITERATURE REVIEW... 35
2.3.1. Age at first motherhood ... 35
2.3.2. Fertility Transition in Sub-Saharan Africa ... 41
2.3.3. Proximate Determinants of Fertility... 46
2.3.4. Socio-economic and Demographic Determinants of Fertility ... 53
3. DATA AND METHODOLOGY... 56
3.1. INTRODUCTION... 56
3.2. SOURCE OF DATA... 56
3.3. DATA QUALITY... 59
3.4. METHODOLOGY... 68
3.4.1. Bongaarts' Model for Estimating the Proximate Determinants of Fertility ... 69
3.4.2. Logistic Regression ... 73
3.4.3. Multiple Classification Analysis (MCA) Predictions ... 74
3.5. BACKGROUND CHARACTERISTICS OF THE RESPONDENTS FOR 1991/92 AND 1996 TDHS ... 76
4. AGE AT FIRST BIRTH ... 81
4.1. INTRODUCTION... 81
4.2. AGE AT FIRST BIRTH IN TANZANIA... 82
4.3. PROXIMATE DETERMINANTS OF AGE AT FIRST BIRTH... 90
4.3.1. Age at menarche... 91
4.3.2. Age at First Sexual Intercourse... 92
4.3.3. Age at First Marriage... 98
4.3.4. Primary Sterility... 106
4.3.5. Contraceptive Use ... 111
4.3.6. Induced Abortion and Early Pregnancy Wastage ... 113
4.4. INTERVAL BETWEEN FIRST MARRIAGE AND FIRST BIRTH (PREMARITAL FIRST BIRTHS)... 117
4.4.1. Covariates of Age at First Birth ... 122
4.4.2. Place of Residence... 122
4.4.3. Religion... 124
4.5. DEMOGRAPHIC IMPLICATIONS OF AGE AT FIRST BIRTH... 127
4.5.1. Age at First Birth and Fertility... 127
4.5.2. Age at First Birth and Infant and Child Mortality... 128
4.5.3. Age at First Birth and Maternal Mortality and Morbidity ... 130
4.5.4. Age at First Birth and Natural Increase ... 131
4.6. REGRESSION ANALYSIS... 132
4.7. CONCLUDING REMARKS... 135
5. FERTILITY ... 139
5.1. INTRODUCTION... 139
5.2. POPULATION CENSUS ESTIMATES... 141
5.2.1. Crude Birth Rate ... 142
5.2.2. The Completed Family Size... 145
5.2.3. Fertility Patterns ... 147
5.2.4. Level of Fertility ... 154
5.2.5. Summary of Census Fertility level Estimates ... 158
5.3. TDHS ESTIMATES OF FERTILITY... 161
5.3.1. Fertility Patterns ... 162
5.3.2. Summary of TDHS Fertility level Estimates... 163
5.4. FERTILITY TRENDS... 164
5.5. PROXIMATE DETERMINANTS OF FERTILITY... 166
5.6. DECOMPOSITION OF CHANGE IN FERTILITY... 170
5.7. SOCIO-DEMOGRAPHIC DETERMINANTS OF FERTILITY... 174
5.8. REGRESSION ANALYSIS... 178
5.9. CONCLUDING REMARK... 185
6. CONTRACEPTION IN TANZANIA ... 187
6.1. INTRODUCTION... 187
6.2. LEVELS AND DETERMINANTS OF CONTRACEPTIVE KNOWLEDGE AND USE... 189
6.2.1. Knowledge of Contraception ... 190
6.2.2. Current Use of Contraception ... 192
6.2.3. Contraceptive Method Mix ... 200
6.2.4. Multivariate Analysis of the Determinants of Current Contraceptive Use... 203
6.3. UNMET NEED FOR CONTRACEPTION... 209
6.3.1. Estimates of Unmet Need and Demand for Contraception ... 212
6.3.2. Socio-demographic Differentials in Unmet Need for Family Planning ... 213
6.3.3. Multivariate Analysis of the Determinants of Unmet Need ... 216
6.3.4. Total Demand for Family Planning ... 221
6.4. CONCLUDING REMARKS... 224
7. EARLY MOTHERHOOD, CONTRACEPTIVE AWARENESS AND USE AMONG
ADOLESCENTS ... 226
7.1. INTRODUCTION... 226
7.2. ADOLESCENTS CHILD BEARING... 228
7.3. SOCIO-ECONOMIC FACTORS ASSOCIATED WITH ADOLESCENTS’ AGE AT FIRST MOTHERHOOD. 231 7.4. ADOLESCENT PREMARITAL CHILD BEARING... 237
7.5. AWARENESS AND USE OF CONTRACEPTIVES... 247
7.6. UNMET NEED AND DEMAND FOR FAMILY PLANNING AMONG ADOLESCENTS... 253
7.7. CONCLUDING REMARK... 259
8. SUMMARY AND CONCLUSIONS... 262
8.1. SUMMARY OF FINDINGS... 263
8.2. POLICY IMPLICATIONS... 274
8.3. FURTHER WORK... 278
9. REFERENCES... 280
10. APPENDIX... 293
List of Figures
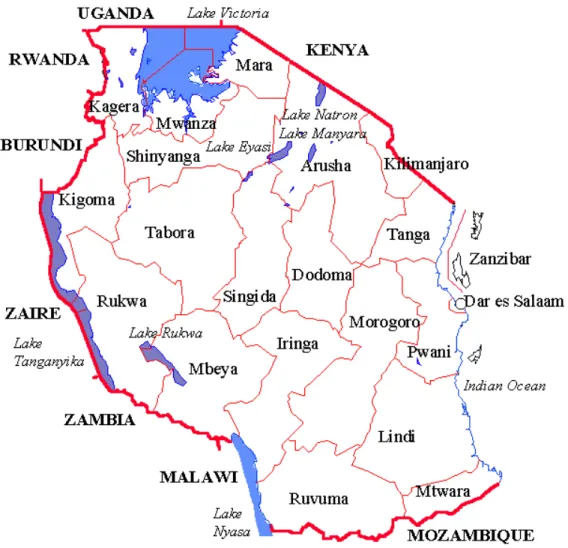
Figure 1: Map of the United Republic of Tanzania showing administrative regions... 14
Figure 2: A simple framework for the study of fertility in Tanzania ... 34
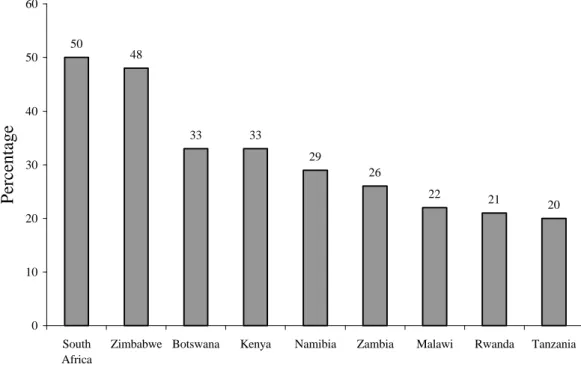
Figure 3: Percentage of currently married women (15-49 years) using a contraceptive method in Eastern and Southern African ... 50
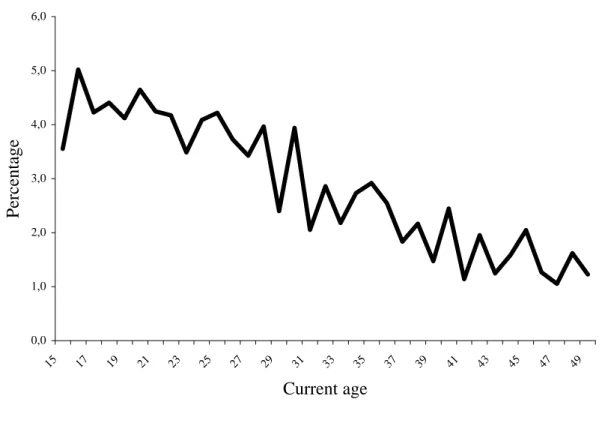
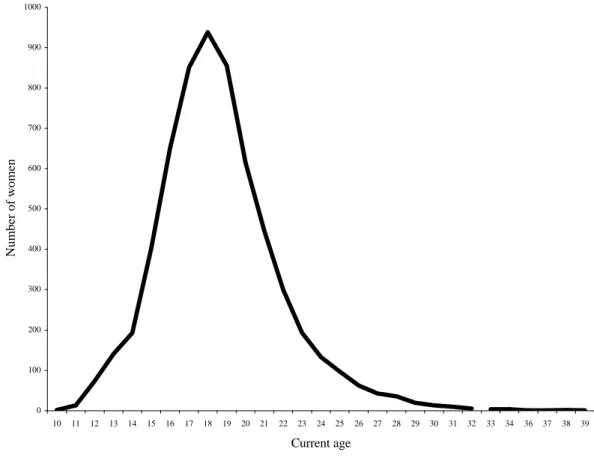
Figure 4: Percentage distribution of women by current age in single years ... 60
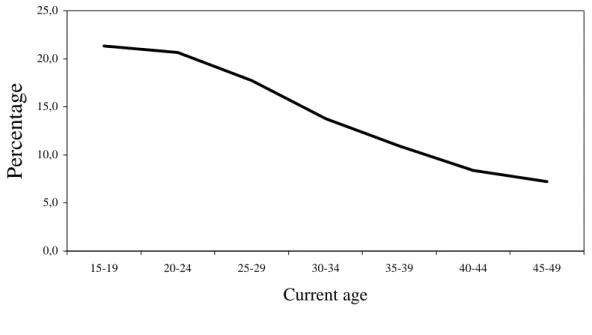
Figure 5: Percentage distribution of women by five-year age groups... 61
Figure 6: Distribution of births in calendar year ... 62
Figure 7: Distribution of mean number of children ever born by age ... 64
Figure 8: Mean age at first intercourse, first marriage, and first birth by current age.... 67
Figure 9: Percentage distribution of respondents by current age ... 77
Figure 10: Frequency distribution of age at first birth in single years... 84
Figure 11: Trend in age at first birth in Tanzania 1991/92-1996 ... 90
Figure 12: Age at first intercourse by single years ... 94
Figure 13: Age at first marriage in single years ... 100
Figure 14: Socio-economic variables associated with age at first marriage ... 103
Figure 15: Mean number of children ever born to ever-married women according to interval between age at birth and marriage... 120
Figure 16: Completed family size in Tanzania ... 146
Figure 17: Patterns of fertility in Tanzania ... 150
Figure 18: Mean age at fertility schedule... 152
Figure 19: Trends in age pattern of fertility for all censuses and TDHSs ... 163
Figure 20: Fertility trends in Tanzania 1967-1996... 165
Figure 21: Percentage distribution of currently married women using contraception by current age ... 198
Figure 22: Estimates of unmet need for family planning... 213
Figure 23: Adolescents’ age at first sexual intercourse, marriage and birth in single years ... 229
Figure 24: Estimates of Unmet Need for family planning... 258
List of Tables
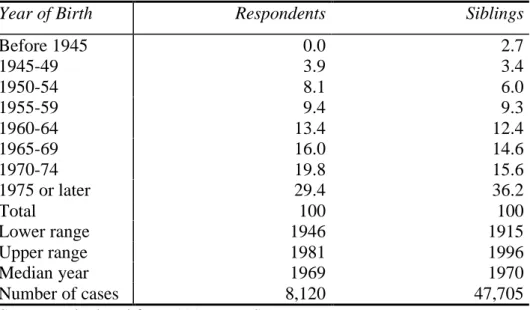
Table 1: Percentage distribution of respondents and siblings by years of birth... 62 Table 2: Percentage distribution of birth with reported year and month of birth by
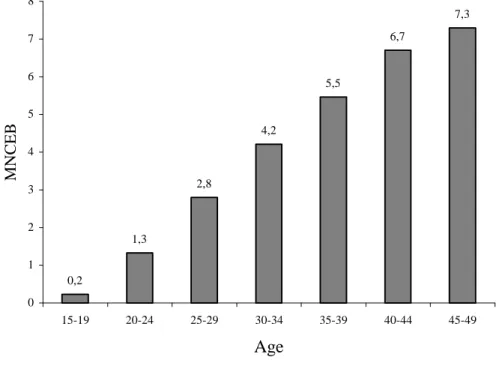
calendar years for surviving, dead and all children ... 63 Table 3: Mean number of children ever born (MNCEB) by age group of women ... 63 Table 4: Percentage distribution of mothers by completeness of information on date of
first birth by age group... 65 Table 5: Percentage of women who had their first birth at ages 15-19 and 20-24 for
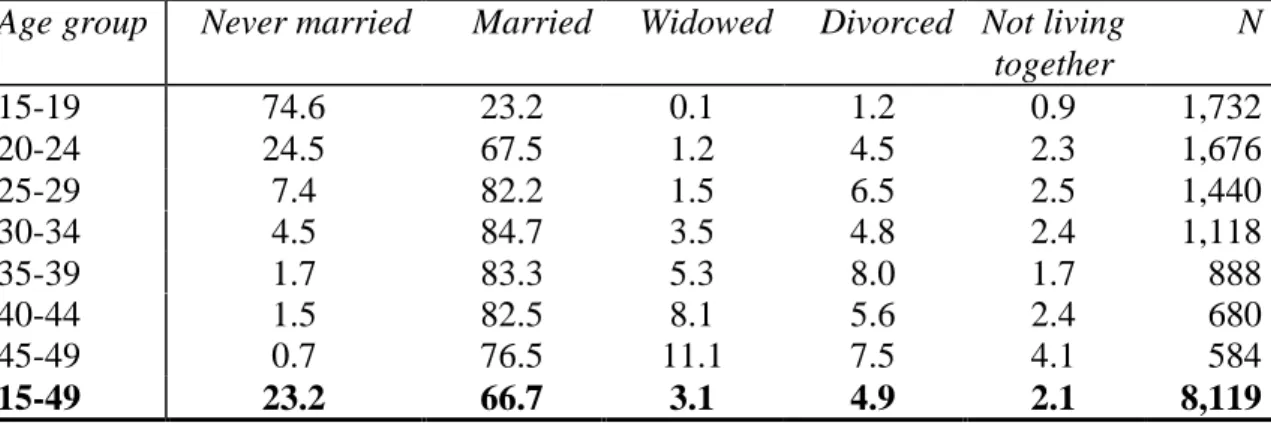
selected years prior to the 1996 TDHS ... 66 Table 6: Distribution of respondents by background characteristics, in percent ... 78 Table 7: Percentage distribution of women by current marital status and current age .. 79 Table 8: Percentage distribution of adolescent women by current marital status ... 80 Table 9: Percentage distribution of women by age at first birth according to current age
in Tanzania ... 83 Table 10: Percentage distribution of women, who ever gave birth, by age at first birth
according to current age, 1991/92 TDHS... 83 Table 11: Mean age at first birth by current age ... 85 Table 12: Proportions of women, who ever gave birth, by current age... 86 Table 13: Logistic regression odds ratio predicting the relative risk that a woman had a
live birth before age 15 ... 87 Table 14: Mean age at first birth by current age in sub-Saharan countries and selected
developing countries ... 88 Table 15: Trends in age at first child bearing in sub-Saharan Africa, and selected
developing countries ... 89 Table 16: Percentage distribution of respondents’ age at first sexual intercourse by
current age ... 95 Table 17: Mean age of respondents at first sexual intercourse by current age ... 96 Table 18: Odds ratio predicting that a woman had sexual intercourse before age 15.... 97 Table 19: Mean age at first sexual intercourse for sub-Saharan countries including
selected developing countries ... 98 Table 20: Percentage distribution of women age at first marriage by current age... 101 Table 21: Mean age at first marriage by current age ... 101
Table 22: Logistic regression coefficients predicting the relative odds that a woman
marries before exact age 15... 105
Table 23: Mean age at first marriage for sub-Saharan countries and other selected countries ... 106
Table 24: Percentage of women, who remain childless by marriage duration and current age ... 108
Table 25: Percentage of childless currently married women in the first union... 110
Table 26: Percentage distribution of non-pregnant unmarried sexually active women who use contraceptive to delay first birth by current age ... 112
Table 27: Percentage distribution of specific method used by current Age ... 113
Table 28: Percentage of ever married women who had ever given birth by current age ... 118
Table 29: First marriage to first birth interval (in months) by current age ... 119
Table 30: Percentage of women who had ever given birth by current age... 121
Table 31: Mean age at first birth by type of place of residence ... 123
Table 32: Mean age at first birth by type of place of residence ... 124
Table 33: Mean age at first birth by Religion ... 125
Table 34: Mean age at first birth by level of education ... 126
Table 35: Mean number of children ever born by age at first birth... 128
Table 36: Childhood mortality rates (first born) by mother’s age at birth; mortality rates (deaths per 1,000) ... 129
Table 37: Maternal mortality by age at death ... 131
Table 38: Regression results (unstandardised coefficients) of the relationship between age at first birth and selected variables ... 133
Table 39: Input and estimated crude birth rate by using formulae 5.3 ... 144
Table 40: Mean number of children ever born (MNCEB) Pi ... 146
Table 41: Reported ASFR Tanzania... 148
Table 42: Mean Age of Distribution of Fertility ... 153
Table 43: Summary of fertility estimates by using various methods ... 159
Table 44: Summary of fertility estimates by using various methods ... 164
Table 45: Observed TFR in sub-Saharan African countries and other selected developing countries ... 166
Table 46: Data used to determine proximate determinants for the 1996 TDHS... 167
Table 47: Data used to determine proximate determinants for the 1991/92 TDHS... 170
Table 48: Summary measure of the proximate determinants of fertility for 1991/92 TDHS ... 168 Table 49: Summary measure of the proximate determinants of fertility for the 1991/92
TDHS ... 171 Table 50: Decomposition of the change in the TFR between 1991/92 and 1996 ... 172 Table 51: Decomposition of the change in the CBR between 1991/92 and 1996... 173 Table 52: Mean number of childrean ever born by selected socio-demographic
characteristics and current age... 176 Table 53: The variables used in the second regression analysis ... 178 Table 54: The OLS Regression Coefficients for the Determinants of Children
Ever Born ... 180 Table 55: Regression results of the relationship between fertility and some selected
variables... 181 Table 56: Percentage distribution of women by knowledge of contraception by selected
background characteristics ... 191 Table 57: Percentage distribution of women currently using contraceptive methods by
selected background variables ... 194 Table 58: Contraceptive prevalence in sub-Saharan Africa (currently married women
15-49 who know and use any modern method in percentage) and other selected developing countries ... 199 Table 59: Percentage distribution of women currently using a contraceptive method
according to the methods used and marital status ... 201 Table 60: Odds ratio associated with the determinants of current contraceptive use for
currently married women ... 205 Table 61: Odds ratio associated with the retrospective determinants of current
contraceptive use for never married and currently married women ... 207 Table 62: Odds ratio associated with the determinants of current contraceptive use for
never married women... 208 Table 63: Percentage of currently married women with unmet need for family planning
... 214 Table 64: The coefficients of logistic regression models for the determinants of unmet
need ... 217 Table 65: Multiple classification analysis (MCA) for the estimated percentages having
unmet need... 220
Table 66: Percentage of currently married women according to demand for family planning and background characteristics ... 222 Table 67: Adolescents’ age at first sexual intercourse, marriage and birth ... 230 Table 68: Mean age at first birth by current age in sub-Saharan countries (including
selected developing countries)... 230 Table 69: Socio-economic factors associated with adolescents’ age at first child bearing
in Tanzania ... 233 Table 70: Regression results (unstandardised coefficients) of the relationship between
adolescent’s age at first birth and some selected socio-economic variables ... 235 Table 71: Logistic regression odds ratio predicting the relative risk that a woman had a
live birth before age 15 ... 236 Table 72: Percentage distribution of adolescents by birth status ... 238 Table 73: Odds ratio predicting the relative risk that an ever-married woman had
premarital sexual intercourse... 239 Table 74: Odds ratio predicting the relative risk that a never married woman is sexually
experienced ... 240 Table 75: Odds ratio predicting that a woman had her first child before first marriage
... 241 Table 76: Odds ratio predicting that a woman did not like the timing of her first
pregnancy... 242 Table 77: Percentage of adolescents in sub-Saharan countries by birth status and
selected developing countries ... 244 Table 78: Percentage distribution of first births by adolescent marital status at the time
of the birth in sub-Saharan countries (including Egypt, Brazil, Bangladesh and Dominican Republic) ... 246 Table 79: Percentage distribution of adolescents’ contraceptive awareness and use... 250 Table 80: Adolescent modern contraceptive use in sub-Saharan Africa countries and
selected developing countries ... 252
List of Abbreviations
AGI Alan Guttmacher Institute
AFB Age at First Birth
AFM Age at First Marriage
AFSI Age at First Sexual Intercourse
AIDS Acquired Immune Deficiency Syndrome
AMREF African Medical Research Foundation ASFR Age Specific Fertility Rate
CBR Crude Birth Rate
CEB Children Ever Born
CIS Commonwealth of Independent States
CMBT Christian Medical Board of Tanzania
CPS Contraceptive Prevalence Survey
DHS Demographic and Health Survey
EA Enumeration Area
ECA Economic Commission for Africa
EMAU Elimu na Malezi ya Ujana
(Responsible Parenthood Education Project for Youth)
GDP Gross Domestic Product
GFR General Fertility Rate
GRR Gross Reproduction Rate
GTZ Gesellschaft für Technische Zusammenarbeit (German Agency for Technical Co-operation)
HED Health Education Division
HIV Human Immunodeficiency Virus
IEC Information, Education, and Communication programme
IUD Intrauterine Device
IUSSP International Union for the Scientific Study of Population MCA Multiple Classification Analysis
MCH Maternal and Child Health
MMR Maternal Mortality Ratio
MNCEB Mean Number of Children Ever Born NFPP National Family Planning Programme
NRC National Research Council
ODA Overseas Development Administration
OLS Ordinary Least Square
OTTU Organisation of Tanzanian Trade Unions
POFLEP Population and Family Life Education Programme
PRB Population Research Bureau
PSU Primary Sampling Unit
RC Reference Category
SDA Seventh Day Adventists
STD Sexually Transmitted Disease
STI Sexually Transmitted Infection
TDHS Tanzania Demographic and Health Survey
TF Total Fecundity
TFR Total Fertility Rate
TM Total Marital Fertility Rate
TN Total Natural Marital Fertility Rate TNPP Tanzanian National Population Policy UMATI Uzazi na Malezi bora Tanzania
(Family Planning Association of Tanzania)
UN United Nations
UNFPA United Nations Population Fund UNICEF United Nations Children’s Fund
UPE Universal Primary Education
WAZAZI Tanzanian Parents Association
WB World Bank
WFS World Fertility Survey
WHO World Health Organisation
Chapter 1 1. Introduction
1.1. Background Information
The United Republic of Tanzania is located in the Eastern part of Africa and consists of the mainland of Tanganyika and the islands of Zanzibar, altogether covering 945,234 km2, whereas 62,0500 km2 constitute inland water.1 Initially, Tanganyika and Zanzibar were two different countries. Tanganyika achieved independence from the British rule on December 9, 1961 and Zanzibar became independent from the rule of the Sultanate of Oman on January 12, 1964. On April 26, 1964, Tanganyika2 and Zanzibar were amalgamated to form the United Republic of Tanzania.3
Administratively, Tanzania is divided into 25 regions. Tanganyika has 20 regions.
These regions include Arusha, Kilimanjaro, Dar es Salaam, Pwani, Tanga, Dodoma, Shinyanga, Singida, Lindi, Morogoro, Mtwara, Ruvuma, Kagera, Mwanza, Mara, Iringa, Kigoma, Mbeya, Rukwa, and Tabora. Zanzibar constitute mainly two islands Unguja and Pemba; has 5 regions (Figure 1). Dodoma is the constitutional capital of Tanzania but Dar es Salaam actually remains the commanding post of the policy makers.
Tanzania is a poor country with a mixed economy in which agriculture plays a major role. The economy expanded after independence until the mid-1970s when various factors including droughts, oil price increases, the Tanzania-Uganda war, and the break up of the East African Community cumulatively had a devastating effect. Recently, however, steady growth has resumed. For instance during the period 1985-1990, the annual growth in the gross domestic product (GDP) measured in constant 1976 prices was 3.9 percent (United Republic of Tanzania/UNICEF, 1990). This growth followed
1Tanzania has borders with Kenya and Uganda to the North, Rwanda, Burundi, and the Democratic Republic of Congo (former Zaire) to the West, and Mozambique, Malawi, and Zambia to the South. To the East of the Country is the Indian Ocean (see Figure 1.1).
2 In this study Tanganyika stands for the Tanzanian mainland.
3
the implementation of structural adjustment policies introduced since in the 1980s.
However, Tanzania’s economy is highly dependent on imports and the availability of foreign exchange. A shortage of foreign exchange has resulted in a reduction in government budgets, particularly for the education and health sectors.
Figure 1: Map of the United Republic of Tanzania showing administrative regions
Source: http://www.reliefweb.int/mapc/afr_east/cnt/tza/ of October 29, 1998
The population density is 26 persons per km2 (according to 1988 census), a figure that gives the impression that Tanzania is a sparsely populated country in comparison for instance with Germany. According to the 1998 Population Data Sheet produced by the Population Reference Bureau, Tanzania has a population density of 35 persons per km2 in 883,589 km2 while Germany’s population density stood at 236 persons per km2 of 349,269 km2. However, Tanzanians are unevenly distributed, and some areas are experiencing serious population pressure. This encouraged the government to formulate a population distribution policy which was enforced as long ago as 1969-74, in the second five-year plan (United Republic of Tanzania, 1969). The villagisation programme of the 1970s,4 the plan to develop Dodoma in order to reduce the importance of Dar es Salaam, and the control of rural-urban migration are among the efforts made by the government towards a more even distribution of the population (United Nations, 1989). However, currently over 80 percent of the population reside in rural areas (Bureau of Statistics, 1994).
The education system of Tanzania has different levels of which some are compulsory.
The first level is primary education, locally referred to as foundation education. Almost all primary schools are owned by the state. Primary education is compulsory and the minimum entry age is seven years. Children are supposed to spend seven years in primary school, standard one to standard seven. Enrolment in primary schools rose dramatically after the establishment of the policy of Universal Primary Education (UPE) in 1974 accompanied by the villagisation programme.5
The second level in the Tanzanian education system is secondary education comprising two parts: the first four years is called ordinary level and the next two years advanced level. A small number of primary school leavers are selected to join ordinary-level secondary schools (they compete it by doing a standard seven examination), as the
4In the 1970s the government moved over 90 percent of the Tanganyika's rural population into villages to make it easier to provide basic social services, e.g. health services, primary schools and clean water supply (United Republic of Tanzania/UNICEF, 1990). This was one of the government’s policies based on socialism, equity and self-reliance as stipulated in the Arusha declaration (Nyerere, 1967).
5 In order to fulfil the target of the government in giving basic education to all, Universal Primary Education was introduced in 1974. It was a reaction to the low school enrolment rate, which was 48.6 percent in 1973. The target of this policy was to gain 100 percent enrolment for all children at school age by
number of secondary schools is very small compared with primary schools. The government owns most of the secondary schools. Recently, many private secondary schools have been established.
Few students, who succeed at the ordinary-level final examination, are chosen to join advanced-level secondary schools. The number of students joining university and higher educational institutions is a very small proportion of those who started at the foundation level. Despite the commitment of the government, the 1988 Population Census showed that almost 40 percent of the population (10 years and above) are illiterate (Kapinga and Ruyobya, 1994).
There are many religious groups in Tanzania. However, data on their membership representation are not available as questions on ethnicity and religion are considered sensitive and are not allowed to be asked for census purposes although permitted in surveys. In many regions, Christians (Catholics and Protestants) and Moslems co-exist beside traditional believers. Most of the traditional faiths are tribal religions, such as animism, i.e. the belief that objects and natural phenomena possess souls. In Tanzania there are also people without any faith.
General observation shows that in areas where missionaries settled and Christianity is a dominant religion (for instance in the Kilimanjaro region), there are relatively many primary and secondary schools. The literacy rate is higher. According to the 1988 census, regions with more than average percentage of literate population (aged 10 years and above) include Kilimanjaro (81 percent), Dar es Salaam (81 percent), Ruvuma (71 percent), Iringa (68 percent), Tanga (66 percent), Mara (64 percent), Morogoro (63 percent), and Mbeya (62 percent). Shinyanga has the lowest percentage of literate population (48 percent).
Since the independence, Tanzania has conducted three population censuses and three demographic surveys. The censuses were taken in 1967, 1978 and 1988; the first national demographic survey was conducted in 1973 (Henin et al., 1973), and the other two Tanzanian Demographic and Health Surveys were carried out in 1991/92 and 1996.
Censuses and demographic surveys are the major sources of demographic statistics in this country, since the registration of vital events is still very incomplete.
From these censuses, the Tanzanian population was found to be 12.3 million, 17.5 million, and 23.1 million in 1967, 1978 and 1988 respectively (Bureau of Statistics, 1994). Tanzanians are now estimated to be 30 million according to the 1998 World Population Data Sheet of the Population Reference Bureau. The intercensal population growth rate between 1967 and 1978 was estimated to be 3.2 percent. With an increase of the population to 23 million by the time of the 1988 census, for the period 1978-88 the annual growth rate was estimated to be 2.8 percent. These figures suggest that the population growth rate has been declining in Tanzania (Bureau of Statistics, 1989;
Barke and Sowden, 1992). This decline has been questioned, particularly for the major city of Dar es Salaam. For instance, Briggs (1993) has discussed factors that might have caused the population of Dar es Salaam to be under-counted in the 1988 census. The World Bank puts Tanzania’s annual growth rate at 3.1 percent for that period.
These population parameters show that the population of Tanzania grew by about 88 percent in a period of 21 years and population density increased from 14 to 26 persons per km2 in the same period. If this natural rate of increase is maintained, the population of Tanzania will double to about 60 million in 25 years. Consequently, there might be a great need of reducing this burden of population growth.
In order to tackle the population problems, the government of the United Republic of Tanzania has formulated the National Population Policy. The broad objective of this policy is to reinforce national development by developing available resources in order to improve the quality of the life of the people: ‘Special emphasis shall be laid on regulating the population growth rate, enhancing population quality, and improving the health and welfare of women and children. The mutual interplay between population and development shall constantly be borne in mind. Thus, the population policy shall always be the main guide of national development planning’ (Planning Commission, 1992:10). The goal of the Tanzania National Population Policy is to reduce the annual growth rate through a reduction in the numbers of births and an increase in voluntary fertility regulation. Therefore, special emphasis is given to the National Family Planning Programme.
Family planning services in Tanzania have a long history. Back in 1959 the Family Planning Association of Tanzania (UMATI) was founded in order to promote child
spacing as a way of enhancing maternal and child health in Tanganyika at that time.
During the early day’s program services were concentrated in urban areas. However in 1967 the program was extended nation-wide. In 1974 the government became actively involved in providing family planning services by launching the integrated Maternal and Child Health (MCH) programme. This led to family planning services being made available and facilitated by the Ministry of Health. Currently both the government and several non-governmental organisations like UMATI, the Marie Stopes Organisation and many other mushrooming NGOs provide family planning services.
The National Family Planning Program (NFPP) was formulated in 1988 and in 1989 the National Family Planning Unit was established to co-ordinate all family planning activities in Tanganyika. Although the NFPP is under the Ministry of Health administratively, its activities and other population activities are co-ordinated by the Population Planning Unit of the Planning Commission as the overall co-ordinator of population activities in Tanzania.
The major responsibility of the NFPP is the management and distribution of contraceptives to all service delivery points. The initial broad objective of the NFPP was to raise the contraceptive acceptance rate from about 7 percent in 1989 to 25 percent by 1993 (Ministry of Health, 1989).
The plan was that contraceptive acceptance would be achieved through improving the accessibility and quality of Tanzanian family planning services by consolidating past strengths and rectifying weaknesses. The specific objectives of the NFPP were:
• to improve the quality of family planning services through the training of service providers,
• to improve supervision and upgrade the logistics system,
• to improve the accessibility of family planning services by increasing the proportion of health units providing family planning services,
• to improve the general health of mothers and children,
• to raise the awareness of and demand for family planning services.
UMATI continued to work closely with the Ministry of Health (through the NFPP) even after handing over the co-ordination of family planning activities. However, UMATI's
major role (excluding the co-ordination) remained the same: to motivate, educate and inform the general public on the need for child spacing; to train both governmental and NGO service providers; and to procure and distribute contraceptives.
The NFPP operates through different institutions and agencies including the government, parastatal organisations,6 the private sector, and NGOs (Ministry of Health, 1989). The Population and Family Life Education Programme (POFLEP) under the Ministry of Community Development, Women Affairs, and Children, is a population Information, Education, and Communication programme (IEC) responsible for creating awareness among the people about the relationship between population factors and development. POFLEP also aims at helping people to take action immediately on family planning activities. Another project designed to provide IEC support to the NFPP is the Health Education Division (HED) of the Ministry of Health.
The HED helps printing IEC materials for clients in dispensaries, health centres and hospitals. Also, the HED is involved in research in family planning-related problems.
Other implementing agencies of the family planning policy include:
• the Responsible Parenthood Education Project for Youth (EMAU), which is designed to bring about desirable changes in attitudes, behaviour and knowledge compatible with parental aspirations and in conformity with accepted Tanzanian cultural norms and values;
• the Family Health Programme of the German Agency for Technical Co-operation
‘Gesellschaft für Technische Zusammenarbeit’ (GTZ), which involves the production of IEC materials, and research in and provision of family planning services;
• the Seventh Day Adventists (SDA) church health service, which offers family planning services in its dispensaries;
• the Department of Community Health at Muhimbili University, College of Health Sciences, which is a resource unit for in-service training;
• the Demographic Training Unit of the University of Dar es Salaam, which deals with training, research and consultancy activities in the areas of population, family planning and demography;
6
• the Organisation of Tanzanian Trade Unions (OTTU), which provides family planning services in its clinics;
• the Marie Stopes Organisation, which provides private family planning services in its clinics;
• the Tanzanian Parents Association (WAZAZI), which trains its regional and district secretaries to educate parents about family welfare, produces educational materials about responsible parenthood, and also conducts research.
• The Christian Medical Board of Tanzania (CMBT) functions as a link between the health care systems of the Dioceses and Churches, and liases with the government.
• Finally, the British Overseas Development Administration (ODA) Family Health Project, which works through the Tanzanian government, aims at expanding family planning services in the Mbeya region.
Tanzania has a network of health facilities including a total of 152 hospitals in 106 districts. At the divisional level, there are about 273 rural health centres. At the ward level, there are about 3,000 dispensaries. At the village level, there are village health posts, estimated to be 5,550 throughout the country. In total, the government provides about 60 percent of health services and the remaining 40 percent are provided by non- governmental organisations. Family planning is included in each of these health institutions mentioned, according to the results of the 1996 Tanzania service availability survey. Despite the efforts by the government and non-governmental organisations to make family planning services available and accessible, contraceptive prevalence among women (15-49 years) is still low. It was found to be 16.1 percent for all women, and 18.4 for currently married women (Bureau of Statistics, 1997).
Out of three processes by which population in Tanzania is changing, fertility and mortality are the most important ones. International migration is negligible except refugees from politically unstable neighbouring countries like Burundi, Rwanda, and the Democratic Republic of Congo. The 1988 population census estimated death rate to be 15 per 1,000, which shows that mortality is slightly reaching a stabilisation stage due
to a fact that Tanzanian is a young population.7 Therefore, fertility is the major population component that will determine Tanzania’s future population growth rate since mortality is declining. This statement might be true if the mortality decline reaches a stage where it cannot decline further than to a level of 10 per 1,000 per annum. In lieu of this fact, fertility decline will reduce population growth rate.
The decline in fertility in every society often proceeds in two stages. The first stage is the decline in fertility due to an increase of age at first birth (natural fertility control).
The second stage involves the adoption of contraception and a change in the fertility behaviour. Much attention on stimulating fertility decline has been devoted to the provision of family planning. Thus the first stage of the transition has received less policy attention.
1.2. Research Problem
The first visible outcome of the fertility process is the birth of the first child. The timing of this event measured by the mother’s age has strong effects on both individual and aggregate levels of fertility, as well as broader implications for women’s roles and social changes in general. Social background characteristics such as religion, place of residence, and the educational attainment are some of the factors that may biologically postpone the onset of the child bearing process.
The first birth marks a woman’s transition into motherhood. It has a significant role in the future life of each individual woman and a direct relationship with fertility. It is believed that the age at which child bearing begins influences the number of children a woman bears throughout her reproductive period in the absence of any active fertility control. Therefore the timing of the first birth has important demographic implications, as both the timing of subsequent births and completed family size are related to the age at first birth. For a country like Tanzania, where contraceptive use is relatively low,
7 Tanzania is termed as a young population country because its population less than 15 years of age accounted for 33 percent of total population in 1988 in comparison with an old population country like West Germany. Before the unification 16 percent of West Germany population under the age of 15 in 1986, while the age group 65 and above were 27 percent. In Tanzania, the population 65 and over were 5
younger ages at first birth tend to boost the number of children a woman will have.
However, even when family planning is widespread, the timing of first births can affect completed family size if contraception is used for spacing but not for limiting fertility.
Several studies have found evidence of faster subsequent child bearing and an increased chance of unwanted births if the first child is born at an early age (Casterline and Trussell, 1980; Finnas and Hoem, 1980; Ford, 1984; Rao and Balakrishnan, 1988). On the other hand, delaying the first birth tends to reduce completed family size. But Turner (1992) in a similar study in Russia found fertility to be low despite early age at first birth and a lack of efficient contraceptive methods. The explanation for this situation may be attributed to abortion. Where contraceptives are expensive and access to abortion is easy fertility might be low. This is based on the assumption that in Eastern Europe couples have an interest in small families, yet women have had little access to or confidence in modern contraceptives. By default, abortion has become the primary means of limiting fertility in many Eastern European countries and the Commonwealth of Independent States (CIS), formerly the Soviet Union (Blum, 1991; Dennehy et al., 1995; Desantis and Thomas, 1987).
The birth of a child is an event of great social and individual significance and its importance is recognised in all human societies. It is of special importance as it signifies the transition of a couple into a new social status i.e. parenthood with its related expectations and responsibilities. It marks the sexual and social maturity of the mother and the visible consummation of sexual intercourse.
Traditionally, procreation was ensured through the institution of marriage. Marriage was geared towards the achievement of large family sizes necessary for meeting its economic, social, and psychological needs. Girls received parental coaching on motherhood and household roles from both their immediate family and the society, popularly known in Tanzania as Unyago.8 As a result, sexual intercourse started after
8 Unyago means female initiation. Unyago might be equated with the traditional education system which all young girls attend. During this period a young woman is taught how to take care of herself after menstruation, to avoid sexual intercourse before marriage, and how to practise birth control (here the only contraceptive is abstinence as they are taught not to resume to sexual intercourse until a child is more than two years old). Traditionally a girl was allowed to get married after her parents were convinced that she was old enough (i.e. she had started to menstruate, which was the only measure of maturity).
marriage and eventually high age at first birth were achieved and premarital births was avoided. However, many traditional values and social practices have undergone changes during the course of modernisation, and it is likely that the traditional premarital sexual abstinence is on the decrease.
On average, Tanzanian woman marry at the age of 18 (Bureau of Statistics, 1997) although this varies with the level of education, the area of residence, and religion. For example, Reining (1972) in a study of the Haya in Northwestern Tanzania found the average age at first marriage to be between 14-16 years. In most cases fecund Haya women was found to start child bearing immediately after they got married.
It is a fact that girls in Tanzania engage in early sexuality and subsequent early child bearing according to studies undertaken by Uzazi na Malezi bora Tanzania-UMATI (Mpangile et al., 1993). Statistics from the Ministry of Education also show that a large proportion of school girls in primary and secondary schools drop out from school due to pregnancies and early births (Sawaya, 1995). Furthermore, a large proportion of women chooses to remain single nowadays in Tanzania but continue to bear children.
Therefore, the concept of the universality of marriage, and births within marriage seems to be a misleading concept in modern times. In Demographic and Health Surveys Comparative Studies it was found that in sub-Saharan African countries 12-67 percent of women experienced intercourse one or more years prior to their first union (Arnold and Blanc, 1990). This suggests that age at first union is insufficient to capture all sexual exposure that leads to births prior to marriage. Moreover, marriage undergoes a shift from arranged marriages to romantic marriages of which sexual intercourse before marriage is a prerequisite. Sometimes these premarital sexual activities result in premarital pregnancies (Gage-Brandon and Meekers, 1992).
The data show a slight rise of median age at first marriage in Tanzania from 17.2 years among women age 45-49 to 19.0 years among women age 20-24 (Bureau of Statistics, 1993). The proportion of women married by the age of 15 declined from 22 percent among those at the time of the survey aged 45-49 years to only 4 percent among women at the age of 15-19 years at the time of the survey. This rise in age at first marriage had only a partial impact on fertility. This is due to the fact that a decline of the total fertility rate (TFR) by one child in 30 years, as discussed above, is negligible. Moreover, it
seems that in Tanzania marriages are not stable now since data from the 1996 TDHS indicates that out of the 25 percent of ever married women between the age of 15 and 19 years, 10 percent are already divorced at this tender age.
The vast majority of Tanzanian women bear children at an early age (Bureau of Statistics, 1993). According to the 1991/92 TDHS data, women who had their first birth below age 15 range between 1 percent for women 15-19 years to 10 percent for women 45-49 years. Furthermore, it was found in the same data that 23 percent of the women age 15-19 were already mothers and 6 percent were pregnant with their first child at the time of the interview (Ngallaba et al., 1993).
Factors influencing age at first birth in Tanzania were classified into biological, social, cultural and behavioural factors (Ngallaba et al., 1993). With modernisation, we expect the age at menarche in Tanzania to decline due to better nutrition and household health.
This is likely to initiate early child bearing depending of course on the exposure to sexual relationships and the availability and use of contraception. If deliberate measures to change the current situation are not taken, the prevailing fertility level will persist for many years to come.
1.3. Rationale
Fertility in sub-Saharan Africa is higher than in other regions of the world, with an average total fertility rate (TFR) in excess of six children per woman. Moreover, until the late 1970s, the analyses of the World Fertility Survey (WFS) and other data showed a rising trend in fertility in most countries in sub-Saharan Africa (see for example Cochrane and Farid, 1989). It was believed that these persistently high fertility rates are related to strong pronatalist forces inherent in the kinship system in Africa (Caldwell and Caldwell, 1987; Frank and McNicoll, 1987).
However, analyses based on the Demographic and Health Surveys (DHS) data in the late 1980s, show a declining trend of fertility in several African countries. The most obvious countries where fertility has started to decline include Kenya, Zimbabwe, and Botswana (Arnold and Blanc, 1990; van de Walle and Foster, 1990; Robinson, 1992;
Cohen, 1993; Rutenberg and Diamond, 1993). The onset of fertility decline in sub-
Saharan Africa has engendered much interest since it has been suggested that sub- Saharan Africa’s fertility transition is different in certain important aspects from that experienced in the past elsewhere in the world (Robinson, 1992; Caldwell et al., 1992b).
However, relatively little information is yet available with which to examine this hypothesis.
This study is meant to contribute to understanding African fertility by examining the situation prevailing in one particular country, Tanzania. The government of the United Republic of Tanzania considers the population growth rate (caused mainly by high fertility levels) to be very high. It has been demonstrated also that the rapid population growth in Tanzania has negative effects on the economy, health, education, employment, agriculture, environment and urbanisation (Mturi and Hinde, 1995). It is against this background that the Government of the United Republic of Tanzania formulated the National Population Policy, announced in July 1992, which, among other things, encourages a reduction of fertility (Planning Commission, 1992).
The success of the population policies particularly in Africa however has been doubted.
For instance, Kenya recognised the implications of population growth on overall development long before most other African countries started to worry. As a consequence, the Kenyan family planning programme was established in 1967 (Frank and McNicoll, 1987). It was 20 years later that fertility started to decline in Kenya. This implies that more effort needs to be made towards an understanding of the determinants of fertility in African societies so that proper strategies can be formulated. To identify the sub-groups of the population where fertility is relatively high or resistant to decline is a step forward in any programme meant to reduce fertility.
In Tanzania the study of age at first child bearing, fertility and contraception is therefore very timely because of various reasons. It is important to understand when child bearing begins, and what current fertility levels, and factors associated with high fertility levels are in Tanzania so that the impact of the National Population Policy can be assessed.
Also, the analysis of new data could be used to give a better understanding of fertility trends in Tanzania in the recent past. In other words, it is important to find out if Tanzania has joined the wave of fertility decline experienced in various African countries and to identify the factors associated with the observed trends.
The Tanzanian National Population Policy (TNPP) document (Planning Commission, 1992) states that the major causes of the high fertility levels in Tanzania are early child bearing and the absence of effective fertility regulation within marriage. Other determinants of high fertility outlined in the same document include: a preference for male children, low levels of education, the low status of women, the large age difference between spouses, and a positive attitude towards large families. All these factors have been found to have a significant effect on fertility in different parts of the world. However, specific studies for Tanzania are rare.
The relationship between age at first birth and overall fertility is generally an underdeveloped area as far as demographic research is concerned, especially in developing countries. In Tanzania for example, most research has concentrated on other determinants of fertility and has ignored age at first birth. Most researchers have assumed that child bearing only occurs within marriage. This assumption might have been true in most traditional societies where births out of wedlock were not accepted and virginity was a prerequisite for marriage. This assumption however does not hold true in modern times, where a large number of children are born outside marriage.
Many scholars have tried to argue that direct effects of early child bearing are seen in the high total fertility and generally young population, the short biographical distance between generations, and a short doubling time of the population. If that is true, there is a need to avoid early child bearing by shortening the reproductive period in delaying age at first birth. The main problem, however, is related to the fact that most Tanzanian women are not using contraception as the 1996 TDHS data suggest. Although 84 percent of all women know of at least one modern contraceptive method, only 12 percent of all women surveyed actually use any of modern methods (1996 TDHS).
Therefore, one does not expect 12 percent of the total women population to exert an impact on the whole women population for further fertility decline. This is an indication that the impact of family planning programmes on fertility has been very minimal so far. This is unlikely to change within the next decade unless extraordinary measures will be taken.
Premarital and adolescent fertility have not been adequately distinguished because there is a tendency for them to occur concurrently. A premarital birth or conception can occur at any age within the reproductive period provided the woman has not been married.
The feasibility and the nature of public policy that would affect the marital status at child bearing are different from those that would affect age at child bearing. There is a need to identify the magnitude and direction of the relationship between age at first birth and fertility. The high level of fertility in Tanzania can be attributed to both marital and premarital fertility. However, most of the studies done so far overlooked the contribution of premarital fertility. In these studies, based on age at first marriage, births that occur outside marriage were always ignored.
Age at first marriage is often used as a proxy for the onset of women’s exposure to the risk of pregnancy, but many women are sexually active before marriage. Therefore the age at which women initiate sexual intercourse marks the beginning of their exposure to reproductive risk more precisely. The median age at first intercourse of Tanzanian women according to the 1996 TDHS is 16.8, that is about one and half years lower than the median age at first marriage of 18.3 years. More data indicate that by the age of 15, 23 percent of the women have had sexual intercourse and by age 18, 65 percent have had sexual intercourse whereas only half had married by this age (Bureau of Statistics, 1997). Therefore, studying the factors associated with age at first birth, its consequences and its contribution to the over-all fertility of the country will help policy makers to formulate better policies in order to fight the current situation. Furthermore, this study will help to expand knowledge about the relationship between age at first birth and fertility in the Tanzanian context. The question as to whether there is a relationship between age at first marriage and age at first birth is an empirical one, which the TDHS data can answer. For these reasons, this study takes a close look at the dynamics of reproductive histories, and especially at the sequencing of events within them.
1.4. Objectives
The ultimate objective of this study is to provide policy makers with useful information for formulating policies on age at first motherhood with the aim to improve the status of women in order to lower fertility. The study also intends to examine the reproductive behaviour of Tanzanian women and to suggest possible measures that can be taken in
order to reduce fertility. Initially, the trend in fertility for the period 1967-1996 is investigated, after which an examination of the contribution of each of the proximate determinants of fertility is carried out. In order to identify the sub-groups of the population with especially high fertility, the social, behavioural, biological and demographic determinants of fertility are analysed.
On the other hand, the length of the interval between the entry into a sexual union and the first birth has important implications for fertility. Since the child bearing process is confined to a period of about 35 years, it may be assumed that early entrance into child bearing will lead to higher fertility in a low contracepting society. Therefore, this study is trying to describe the way in which age at first birth influences fertility, the magnitude of its effects, and its demographic, social, economic and cultural determinants. The study will examine the proximate determinants of age at first birth and its socio-economic and cultural variations as well as the differentials, and consequences of age at first birth in the Tanzanian context.
Due to the importance of contraceptive use in the second stage of fertility decline, as explained previously, it is important to examine the knowledge, needs and use of contraception in Tanzania. The sub-groups of the population with a low acceptance rate are identified along with the related factors. The study also investigates the levels of unmet need and the demand for family planning. Ultimately the major is to find out the proportion of women exposed to the risk of pregnancy, who want to limit or space their births but are not using contraception, and to investigate the characteristics of these women.
Finally, this study describes the larger structure of factors affecting fertility as they operate through age at first birth, and ultimately influence fertility through the intervening variables of reproductive intentions and contraception practices.
1.5. Organisation of the Thesis
Chapter 2 consists of the analytical framework and a literature review. The chapter tries to cover the state of knowledge on the subjects included in the analysis. Chapter 3 describes the sources of the data used along with an assessment of the data quality, and
a brief discussion of the major statistical techniques used in the analysis. In this chapter, the social economic characteristics of respondents are examined. Chapter 4 is the first analytical chapter in which proximate determinants of age at first birth are examined.
Differentials in age at first birth are also investigated with respect to background variables. The major goal is to provide policy makers with useful information for improving the status of women and formulating a policy on age at first birth in Tanzania with the aim of lowering fertility. Chapter 5 contains a general overview of fertility levels and trends in Tanzania as computed by using census data of 1967, 1978, and 1988. The second part of this chapter is on analysis of the fertility levels and trends by using the two TDHSs of 1991/92 and 1996. The third part deals with proximate determinants of fertility. The fourth part is about fertility differentials. Differentials of fertility have been mainly examined by using the 1996 TDHS. The reason is that these two TDHSs are nearly 4 years apart and the changes one expects will be minimal.
Chapter 6 is on family planning issues. This chapter is divided into three main sections.
The first section deals with levels and patterns of contraceptive awareness, and the second section is about contraception. The last section is on unmet need and the total demand for family planning in Tanzania. In this chapter we look at a way of raising age at first birth in order to limit fertility. An important section deals with unmet need and the demand for family planning. Chapter 7 provides a discussion based on factors and consequences of adolescence child bearing in Tanzania. This chapter examines premarital births among adolescents in Tanzania in comparison with other sub-Sahara African countries that conducted the DHS III. We further chose a country in each of the other continents as controls. The last chapter constitutes summary and conclusions.
Chapter 2
2. Analytical Framework and Literature Review
2.1. Introduction
The aim of this chapter is to give an introduction of other scholars’ work on the subject matter. The discussion will concentrate on findings based on sub-Saharan Africa. The main focus of this chapter will be the current state of knowledge on age at first motherhood and the fertility change in sub-Saharan Africa. The debate in the literature regarding the onset of the fertility transition in this region is the central issue addressed.
The determinants of African fertility are outlined. The discussion focuses on the proximate determinants of fertility putting more emphasis on age at first birth and contraception. This is followed by a review of socio-economic and demographic determinants of fertility and their applicability in sub-Saharan Africa.
2.2. Conceptual Framework
As Davis and Blake (1956) pointed out that cultural, social, and economic settings impinge on fertility through the intermediate fertility variables. There could be biological or behavioural factors that determine exposure to sexual intercourse and hence to child bearing. The relative importance of each variable may differ from one society to another. In particular, fertility is directly determined by intermediate variables. The intermediate fertility variables that will be examined in this study are duration variables measured in terms of the time elapsed before a particular event occurred. The beginning of child bearing which is measured by the age of a woman at the birth of her first child is the dependent variable.
Although age at first sexual intercourse is the first step in the child bearing process, it is closely associated with age at marriage in most traditional set-ups. Hence age at first marriage is always considered to represent the beginning of the exposure to the risk of child bearing. However, in recent days child bearing is not just confined within marriage but is also taking place outside marriage due to prolonged delay in the entry
into unions. In addition, child bearing is now a common phenomenon among adolescents as a result of adolescent promiscuity.
In the past most African societies considered virginity to be essential for the first marriage and premarital pregnancy was a social embarrassment among most ethnic groups in Africa. Today however, this is being accepted as an inevitable consequence of the modernisation process even among the conservative nomadic communities. In the past for example, among the Wanyambo of Tanzania, a girl who became pregnant before marriage was required to confess, and the man responsible was forced to marry her. Today the man responsible is only required to pay a bride price to her parents and to accept supporting the child financially.
However many societies that traditionally condemned premarital sexual intercourse have become much more tolerant nowadays. For example the Baganda in Uganda changed their attitude towards premarital sexual activities. Whereas parents used to control the sexual behaviour of their adolescent children by having them living in the parental home, nowadays they indirectly encourage premarital sexuality by building separate houses for the sexually active adolescents (Ntozi and Lubega, 1990).
The rise of age at first marriage in Tanzania in the recent past as seen in the first chapter can be attributed to several factors, among them are the changing educational policies which are now geared towards boosting women’s education. Economic changes reflected by rising standards of living and stimulation of women’s employment are beginning to change people’s attitude towards early marriage.
As contraception is not widespread in Tanzania, fertility could, among other factors, be mostly determined by age at sexual intercourse as well as the duration of exposure to the risk of pregnancy, age at first marriage, frequency of intercourse, and age at first birth. Behavioural factors that may be modified by the level of education, religion, place of residence may also play a key role in determining fertility. Studies have hypothesised that women who start child bearing at an early age especially in the non-contraception societies are likely to end up with higher completed family size than their counterparts who start at later age provided other fertility depressing factors do not intervene.