1
Department of Physics, University of Regensburg, Regensburg, Germany.
2Department of Physics, Chalmers University of Technology, Gothenburg, Sweden.
3Present address: Department of Physics, University of Rostock, Rostock, Germany. *e-mail: ermin.malic@chalmers.se; rupert.huber@ur.de Heterostructures of atomically thin van der Waals bonded
monolayers have opened a unique platform to engineer Coulomb correlations, shaping excitonic
1–3, Mott insulating
4or superconducting phases
5,6. In transition metal dichalco- genide heterostructures
7, electrons and holes residing in different monolayers can bind into spatially indirect exci- tons
1,3,8–11with a strong potential for optoelectronics
11,12, val- leytronics
1,3,13, Bose condensation
14, superfluidity
14,15and moiré-induced nanodot lattices
16. Yet these ideas require a microscopic understanding of the formation, dissociation and thermalization dynamics of correlations including ultra- fast phase transitions. Here we introduce a direct ultrafast access to Coulomb correlations between monolayers, where phase-locked mid-infrared pulses allow us to measure the binding energy of interlayer excitons in WSe
2/WS
2hetero- bilayers by revealing a novel 1s–2p resonance, explained by a fully quantum mechanical model. Furthermore, we trace, with subcycle time resolution, the transformation of an exci- ton gas photogenerated in the WSe
2layer directly into inter- layer excitons. Depending on the stacking angle, intra- and interlayer species coexist on picosecond scales and the 1s–2p resonance becomes renormalized. Our work provides a direct measurement of the binding energy of interlayer excitons and opens the possibility to trace and control correlations in novel artificial materials.
In monolayers of transition metal dichalcogenides (TMDs), the confinement of electronic motion into two dimensions and the suppression of dielectric screening facilitate an unusually strong Coulomb interaction
17–20. This gives rise to excitons with giant bind- ing energies of several hundred meV (ref.
17), small Bohr radii
18and ultrashort radiative lifetimes
19. When two monolayers are brought into contact with type-II band alignment, the conduction band minimum and the valence band maximum are located in two dif- ferent layers
7. Owing to their proximity, electron–hole (e–h) pairs in adjacent monolayers are still subject to strong mutual Coulomb attraction. Interband photoluminescence combined with theory has, indeed, provided evidence of interlayer excitons
8,21–23. Because the composite electron and hole wavefunctions overlap only weakly in space, these excitons are long-lived—a key asset for future appli- cations
1,3,14–16,24. However, the weak coupling to light renders these quasiparticles inaccessible to interband absorption spectroscopy.
The binding energies of interlayer excitons, which depend sensi- tively on the delocalization of the electronic wavefunctions over the heterostructure
23, have thus not been measured. Signatures of the ultrafast interlayer charge transfer have been studied by interband spectroscopy
8,21, but these techniques cannot measure Coulomb
correlations or the formation of interlayer excitons on the intrinsic ultrashort timescales.
Meanwhile, phase-locked electromagnetic pulses in the tera- hertz (THz) and mid-infrared (MIR) range have directly accessed ultrafast low-energy excitations such as plasmons, phonons or correlation-induced energy gaps
25–28. By probing the internal 1s–2p resonance, pre-existing exciton populations have been studied, even if interband selection rules render them optically dark
19,20,26,27. Whereas THz and MIR pulses have unveiled excitonic correlations in quantum wells
26, perovskites
27and monolayer TMDs
19,20, excitons in TMD hetero-bilayers have not been resolved. As the library of two-dimensional van der Waals materials is rapidly growing
24, and exciting new phases may be tailored artificially
1–5, a precise quanti- tative understanding of Coulomb correlations between monolayers is vital.
Here we exploit near-infrared pump–MIR probe spectroscopy to measure the binding energy of spatially indirect excitons and the ultrafast transition of intralayer excitons into an interlayer insulat- ing phase in WSe
2/WS
2bilayers (Fig. 1a), depending on the stacking angle. The samples are manufactured by mechanical exfoliation of individual monolayers and subsequent deterministic transfer onto a diamond substrate (see Methods). In a first sample, monolayers of WSe
2and WS
2overlap in a large patch (Fig. 1b) with a diameter of ~80 µm with a stacking angle of θ = 5° ± 3° (see Methods). In the overlap area, the photoluminescence at the 1s A exciton lines of the bare monolayers is quenched (Fig. 1c), attesting to good contact between the monolayers. We also prepared a reference monolayer of WSe
2on a diamond substrate, covered with hexagonal boron nitride (hBN) (Supplementary Fig. 1a). This structure features a spatially uniform photoluminescence of the WSe
21s A exciton (Supplementary Fig. 1b).
We first prove that MIR probing can unequivocally distin- guish between spatially direct and indirect excitons. A 100 fs near-infrared (NIR) pump pulse, centred at a photon energy of 1.67 eV (Supplementary Fig. 2a) resonantly injects 1s A excitons into the WSe
2monolayer (Fig. 1d). Because this energy lies well below the lowest interband resonance of WS
2and hBN, we do not directly excite these materials. After a variable delay time t
pp, a phase-locked few-cycle MIR pulse (Fig. 1d, red waveform; centre frequency, 22 THz; spectral width, 19 THz; see also Supplementary Fig. 2b,c) is transmitted through the sample. The interaction with the photoinjected e–h pairs imparts a characteristic change on the amplitude and phase of the MIR waveform, which we directly record by electro-optic sampling
19,20,25–28. A Fourier transform and a Fresnel analysis allow us to extract the full dielectric response of the non-equilibrium system
25,26(see Methods). The pump-induced
Ultrafast transition between exciton phases in van der Waals heterostructures
P. Merkl
1, F. Mooshammer
1, P. Steinleitner
1, A. Girnghuber
1, K.-Q. Lin
1, P. Nagler
1, J. Holler
1,
C. Schüller
1, J. M. Lupton
1, T. Korn
1,3, S. Ovesen
2, S. Brem
2, E. Malic
2* and R. Huber
1*
changes of the real parts of the optical conductivity Δσ
1and of the dielectric function Δε
1describe the absorptive and inductive responses, respectively.
Coulomb correlations leave characteristic fingerprints in the dielectric response. At t
pp= 175 fs, the response in the reference sam- ple is dominated by a maximum in Δσ
1(Fig. 2a) and a correspond- ing zero crossing in Δε
1(Fig. 2b) at a photon energy of 144 ± 6 meV.
This resonance marks the recently discovered 1s–2p transition of excitons within the WSe
2monolayer
19. The energy is slightly red- shifted with respect to the value of a bare WSe
2monolayer
19due to dielectric screening by the hBN cover layer
20. Most remarkably, an analogous experiment with the WSe
2/WS
2heterostructure yields a dramatically different result (Fig. 2c,d). At a delay time of 5.1 ps after photoinjection of excitons in the WSe
2monolayer, the strong resonance at an energy of 144 meV is absent. Instead, a maximum in Δσ
1(Fig. 2c) and a dispersive feature in Δε
1(Fig. 2d) at an energy of 67 ± 6 meV dominate the response. This signature, which is spec- trally far below the known internal 1s–2p resonances of intralayer excitons (see Methods) and far above the phonon frequencies of the TMD materials used here (Supplementary Fig. 2d), is characteristic of interlayer excitons, as shown next.
Owing to the type-I band alignment between WSe
2and hBN (Fig. 2b, inset), excitons photoinjected in the reference sample remain within WSe
2(ref.
20). The staggered band alignment in the WSe
2/WS
2bilayer (Fig. 2d, inset), in contrast, should enable inter- layer electron tunnelling
29. This process competes with the radiative recombination of the intralayer excitons
19, quenching the photolumi- nescence of the WSe
2monolayer
8(Fig. 1c). The Coulomb attraction
between electrons and holes remains strong even if they are spatially separated in neighbouring monolayers. The eigenenergies E
band wavefunctions φ
qof the bound states are obtained by solving the Wannier equation
μ φ ∑ φ φ
ℏ q − V
−= E
2
q b(1)
k k q k q
2 2
Here, μ is the reduced mass, and the effective 2D Coulomb poten- tial V
kis derived by generalizing the Keldysh potential of the mono- layer case to heterostructures and solving the Poisson equation self consistently. With literature values for the interlayer distance and the relevant dielectric constants, we compute a 1s–2p energy sepa- ration of 147 ± 3 meV and 69 ± 5 meV (Fig. 2e,f) for the reference sample and the WSe
2/WS
2bilayer (see Methods), respectively, which coincide very well with the measured resonances of Fig. 2a–d. The 1s and 2p wavefunctions are qualitatively similar for intra- (Fig. 2e) and interlayer (Fig. 2f) species, and the dipolar nature of the 2p wavefunctions warrants an in-plane orientation of the 1s–2p tran- sition dipole for both cases. Because these resonances carry by far the largest oscillator strength of all intra-excitonic transitions they are expected to dominate the MIR spectra, as indeed is observed experimentally. The excellent agreement between experiment and theory allows us to quantify the corresponding binding energy of the interlayer excitons in the WSe
2/WS
2bilayer under these condi- tions as 126 ± 7 meV (see Methods and Supplementary Section 3), substantially exceeding the thermal energy at room temperature.
a
WS2 WSe2
NIR
teos MIR
tpp c
50 µm WSe2
WS2 HS
Diamond
PL intensity (a.u.)
0 1
WS2 WSe2
d b
Xintra
Xinter WS2
WSe2 e– tunnelling
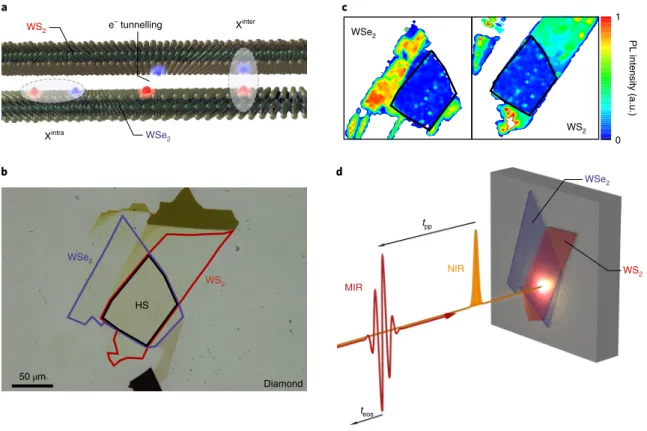
Fig. 1 | NiR pump–MiR probe spectroscopy of a WSe
2/WS
2hetero-bilayer. a, Artistic illustration of the electron tunnelling process and interlayer exciton
formation out of intralayer excitons in a WSe
2/WS
2heterostructure. b, Optical microscope image of the heterostructure. The purple frame indicates the
WSe
2monolayer, which is covered by a WS
2monolayer (red frame). The heterostructure (HS) is formed in the overlap region (black frame). c, Micro-
photoluminescence intensity map at the photon energy of the interband resonance of the 1s A exciton of WSe
2(left) and WS
2(right) when excited by a
continuous-wave (c.w.) laser at a wavelength of 532 nm. All experiments were performed at room temperature. d, Time-resolved NIR pump–MIR probe
spectroscopy of the heterostructure, which is van der Waals bonded on a diamond substrate. The 100 fs NIR pump pulse (orange) resonantly injects 1s A
excitons into the WSe
2monolayer. The ultrabroadband MIR probe pulse (red waveform) samples the dielectric response of the heterostructure.
Next, we utilize the hallmark MIR resonances to track the dynamics of Coulomb correlations. By repeating the NIR pump–
MIR probe experiment for variable delay times t
pp, we map out the time evolution of Δσ
1of the WSe
2/WS
2heterostructure (Fig. 3a; see Supplementary Fig. 4e for Δε
1). Δσ
1sets on sharply at t
pp= 0 ps. Only 100 fs later, a broad maximum at an energy of ~150 meV indicates the presence of intralayer excitons in WSe
2. Already at this time, a broad shoulder at ~67 meV attests to the formation of interlayer excitons. Within the subsequent 100 fs, the spectral weight shifts from the intra- to the interlayer resonance, as seen at t
pp= 0.2 ps.
Subsequently, the intralayer resonance disappears completely while the spectral weight of the interlayer exciton resonance continues to grow until t
pp= 5.1 ps. This dynamics is faithfully reproduced by a microscopic model (Fig. 3c) based on the density matrix formalism discussed in more detail below (see also Methods). Our experimen- tal data thus directly resolve the transformation of intralayer exci- tons into interlayer bound states in the time domain. For t
pp> 5.1 ps, Δσ
1decreases as the interlayer exciton population decays (Fig. 3a).
Intriguingly, the exciton resonance is blueshifted by ~20 meV at t
pp= 50 ps.
To test the influence of the stacking angle, we repeated the pump–probe experiment under identical conditions with a compa- rable WSe
2/WS
2bilayer featuring θ = 27° ± 3° (Supplementary Fig.
1c,d). The dynamics of Δσ
1(Fig. 3b; see Supplementary Fig. 4f for Δε
1) is similar to that in Fig. 3a, with two exceptions: (1) the spectral weight in the vicinity of the intralayer exciton resonance remains observable at t
pp= 5.1 ps; (2) the peculiar blueshift of the interlayer exciton resonance at t
pp= 50 ps does not occur for θ = 27°.
For a quantitative discussion, we fit the MIR response with a phenomenological three-fluid model, which accounts for the two Lorentzian resonances of inter- and intralayer 1s–2p transitions and includes a contribution of excited interlayer exciton states as discussed below (see also Methods). The energies and dipole moments of the exciton resonances are adopted from the above theory whereas the inter- and intralayer exciton densities, n
interand n
intra, as well as the spectral weight of the excited interlayer exciton states, are freely varied. The requirement to simultaneously repro- duce the spectra of both Δσ
1and Δε
1(Fig. 3a,b and Supplementary Fig. 4b,c,e,f) sets narrow boundaries for acceptable exciton densi- ties (Fig. 4a,b). We observe that n
intra(Fig. 4a) peaks immediately after the pump pulse, at t
pp= 100 fs, for both heterostructures. The subsequent decay, however, is significantly slower in the strongly twisted bilayer (θ = 27°) than for θ = 5°, where a notable decay occurs within less than 0.2 ps. Furthermore, the maximum of n
intrais larger for θ = 27°, even though the pump fluence is identical in both structures. This confirms that, for θ = 5°, tunnelling into the WS
2layer occurs on the same timescale as the photogenera- tion of intralayer excitons. Accordingly, n
inter(Fig. 4b) rises quickly within the initial few hundred femtoseconds after optical excitation and levels off at t
pp= 5.1 ps. The maximum observed for θ = 5° is approximately twice as large as in the more twisted bilayer, again attesting to a strongly enhanced tunnelling rate at θ = 5°. The MIR response of both hetero-bilayers can only be fitted satisfactorily if additional spectral weight below the observed frequency window is included. Such a response can be caused by unbound e–h pairs or excited-state absorption of bound states
30, both of which we
∆ε1∆ε1
a b
Photon energy (meV)
Photon energy (meV) Photon energy (meV)
Photon energy (meV) WSe2/WS2
WSe2/hBN
e
f
50 100 150
0 50 100 150 200
50 100 150
–20 –10 0 10
50 100 150
–10 –5 0 5
50 100 150
0 50 100 150
c
200d
∆σ1 (Ω–1
cm
–1)∆σ1 (Ω–1
cm
–1)
e–
h+ WSe2 hBN
Xintra
e–
h+ WSe2 WS2
Xinter
2p 1s
ψ2p
69 meV
Intralayer excitons
2p
–30
Interlayer excitons
147 meV
1s
ψ1s
V r
V r
ψ1s
ψ2p
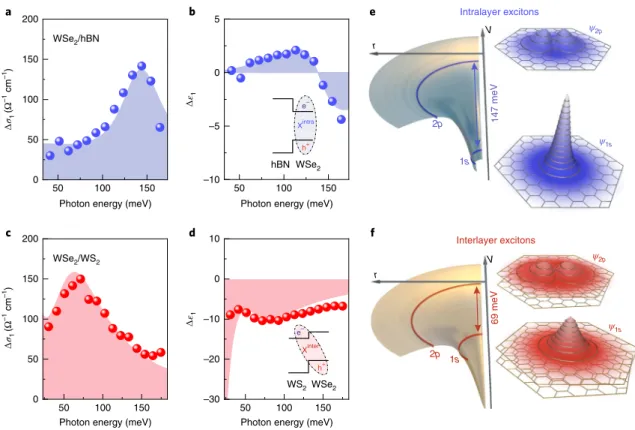
Fig. 2 | Dielectric response of intra- and interlayer excitons and excitonic wavefunctions. a–d, Pump-induced changes of the real parts of the optical
conductivity Δσ
1(a,c), and the dielectric function Δε
1(b,d), as a function of the photon energy. The pump-induced dielectric response of the reference
WSe
2/hBN structure is shown for t
pp= 175 fs (a,b). For the θ = 5° WSe
2/WS
2heterostructure (c,d), the response is depicted at t
pp= 5.1 ps. The blue and
red spheres denote the experimental data of the photoexcited heterostructures at a pump fluence of Φ = 27 μ J cm
−2. Shaded areas represent the three-
fluid model fitting the experimental data, as discussed in the main text. Inset in b, schematic band alignment for the WSe
2/hBN heterostructure hosting
intralayer excitons X
intrain the WSe
2monolayer. Inset in d, band alignment for the WSe
2/WS
2heterostructure supporting the formation of interlayer
excitons X
inter. e, Intralayer Coulomb potential and wavefunctions of the 1s and 2p intralayer excitons in real space. f, Interlayer Coulomb potential and
wavefunctions of the 1s and 2p interlayer excitons in real space.
phenomenologically account for in the form of a low-frequency Lorentz oscillator. From the temporal evolution of this component (Supplementary Fig. 5b,d,f) we estimate the density of unbound charge carriers to always remain at least a factor of 7 below the total density of e–h pairs, suggesting no dominant intermediate plasma phase during the formation of interlayer excitons.
The observed dynamics is well described by a microscopic model as illustrated in Fig. 4c. Because electrons and holes in interlayer excitons reside in different layers, the lattice mismatch between WSe
2and WS
2leads to a momentum displacement between the intra- and interlayer exciton dispersion (grey shaded parabolas). After photoinjection at a vanishing centre-of-mass momentum (Q = 0), 1s intralayer excitons spread out in recip- rocal space via phonon scattering (Fig. 4c, orange arrow), while the entire ensemble is traced by its 1s–2p transition (Fig. 4c, blue arrows). The electrons can tunnel into the WS
2layer under con- servation of energy, which is most efficient at the intersection points of the inter- and intralayer dispersion relations, where also the in-plane momentum Q is conserved. Intralayer excitons may be transformed into interlayer unbound or bound states with a broad range of possible orbital quantum numbers. These quasiparticles subsequently relax towards the 1s interlayer state (Fig. 4c, green arrows), leading to the characteristic 1s–2p absorp- tion (Fig. 4c, red arrows).
To model this scenario, we compute the temporal evolution of inco- herent exciton densities for intra- and interlayer populations, includ- ing tunnelling, phonon scattering, radiative decay, non-radiative decay and intra-excitonic relaxation (see Methods). These simulations
reproduce the spectral shape and the temporal evolution of Δσ
1(Fig. 3c) as well as the dynamics of the intra- and interlayer exciton den- sity, for θ = 5° and 27°, at all t
pp< 50 ps (Fig. 4a,b, solid/dashed curves).
Interestingly, direct tunnelling into the 1s interlayer state is the most efficient quantum channel with a branching ratio of 54%
(see Methods). Moreover, our model shows that the measurable dif- ference of interlayer tunnelling rates of Γ = (200 fs)
−1at θ = 5° and Γ = (1.2 ps)
−1at θ = 27° is primarily caused by the momentum offset of inter- and intralayer exciton dispersions (see Methods).
Apart from the ultrafast formation of interlayer excitons, θ also strongly influences their long-term dynamics, where a blueshift of the 1s–2p resonance occurs in the nearly aligned hetero-bilayer (Fig. 3a, for t
pp= 50 ps). We suggest that this phenomenon could be caused by lateral quantum confinement of excitons
16(Supplementary Section 6). The slight lattice mismatch between WSe
2and WS
2entails a moiré pattern of alternating AA and AB stacking (Fig. 4d), which induces a periodic modulation of the potential energy experienced by interlayer excitons
16(Fig. 4e). Owing to their small Bohr radii, the interlayer excitons may be captured in areas with AB stacking as they cool down. The additional quantum confinement could explain the blueshift of the 1s–2p resonance for t
pp= 50 ps (Fig. 3a; see Methods).
This effect is even more pronounced in a third, precisely aligned hetero-bilayer with θ = 0 ± 2° (Supplementary Fig. 1e,f), where the moiré period reaches its largest value of 9 nm, the potential energy modulation is maximal and interlayer excitons should be created with particularly small centre-of-mass momenta owing to the mini- mum momentum mismatch between intra- and interlayer excitons.
50 100 150
∆σ1 (Ω–1cm–1)
Photon energy (meV)
θ = 5°
0 75 150
–0.5 0.0
0.1 0.2
5.1 10
50
1.1
tpp (ps) tpp (ps)
tpp (ps)
50 100 150
Photon energy (meV)
50 100 150
Photon energy (meV) 0
0.5 1 θ = 27°
Xinter
Xintra
Xinter Xintra
a b c
Model
–0.5 0.0
0.1 0.2
5.1 10
50
1.1
–0.5 0.0
0.1 0.2
5.1 10
50
1.1
0 75 150
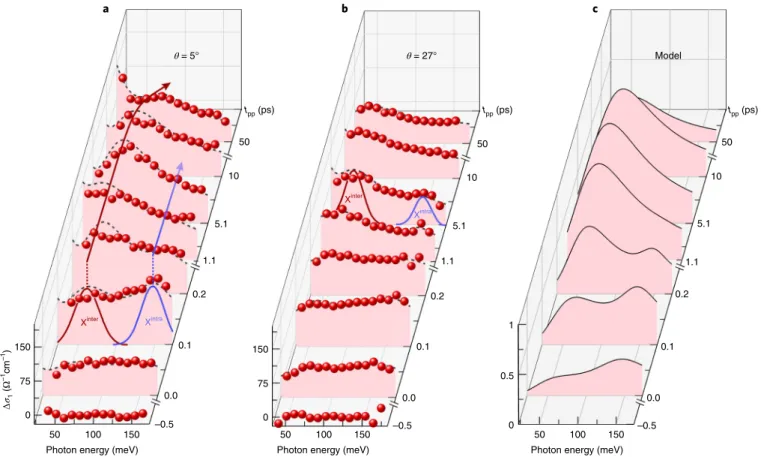
Fig. 3 | Temporal evolution of the dielectric response in experiment and theory. a,b, Pump-induced change of the optical conductivity Δσ
1of the
photoexcited heterostructures as a function of the photon energy at selected delay times t
pp(pump fluence, Φ = 27 µJ cm
−2), for almost aligned (θ = 5°) (a)
and misaligned ( θ = 27°) (b) heterostructures. Red spheres indicate experimental data. Dashed curves present phenomenological three-fluid model fitting
of the data, as discussed in the main text. The red and blue Gaussian curves in a and b indicate the spectral positions of the inter- and intralayer exciton
absorption, respectively. c, Normalized pump-induced change of the optical conductivity Δσ
1modelled by the microscopic theory discussed in the main
text, for θ = 5° and the delay times interrogated in the experiment.
Indeed for this structure, the interlayer exciton resonance starts out at a relatively high photon energy of 83 ± 6 meV and does not shift any further for later delay times (Supplementary Fig. 4a,d), suggest- ing that interlayer excitons may be efficiently captured in confined states already at early delay times t
pp. In contrast, the moiré period of 0.6 nm for θ = 27° (Supplementary Fig. 1g), which is substan- tially smaller than the exciton Bohr radius (Supplementary Fig. 1h), will not allow excitons to be efficiently captured, as is seen by the absence of a transient blueshift in Fig. 3b.
In conclusion, the direct study of interlayer Coulomb correla- tions allows us to measure the large binding energies of spatially indirect excitons. By probing all excitons, independently of their centre-of-mass momenta, spin orientation or interband selection rules, we discover an unexpectedly efficient ultrafast transition of spatially direct into indirect excitons without a pronounced inter- mediate plasma phase of unbound e–h pairs. The twist angle θ has a strong influence on the formation and cooling dynamics of inter- layer excitons. While we extract a binding energy of 126 ± 7 meV for itinerant interlayer excitons, blueshifted 1s–2p resonances may be caused by quantum confinement within the moiré pattern. In the same spirit, observing Coulomb correlations and their ultrafast dynamics in the extensive library of van der Waals heterostructures opens a versatile playground for fundamental materials sciences and may become an invaluable help in searching for novel man- made equilibrium and hidden phases.
Online content
Any methods, additional references, Nature Research reporting summaries, source data, statements of data availability and asso- ciated accession codes are available at https://doi.org/10.1038/
s41563-019-0337-0.
Received: 12 October 2018; Accepted: 7 March 2019;
Published: xx xx xxxx
References
1. Rivera, P. et al. Valley-polarized exciton dynamics in a 2D semiconductor heterostructure. Science 351, 688–691 (2016).
2. Ju, L. et al. Tunable excitons in bilayer graphene. Science 358, 907–910 (2017).
3. Jin, C. et al. Imaging of pure spin-valley diffusion current in WS
2–WSe
2heterostructures. Science 360, 893–896 (2018).
4. Cao, Y. et al. Correlated insulator behaviour at half-filling in magic-angle graphene superlattices. Nature 556, 80–84 (2018).
5. Cao, Y. et al. Unconventional superconductivity in magic-angle graphene superlattices. Nature 556, 43–50 (2018).
6. Lee, J. J. et al. Interfacial mode coupling as the origin of the enhancement of T
cin FeSe films on SrTiO
3. Nature 515, 245–248 (2014).
7. Gong, Y. et al. Vertical and in-plane heterostructures from WS
2/MoS
2monolayers. Nat. Mater. 13, 1135–1142 (2014).
8. Hong, X. et al. Ultrafast charge transfer in atomically thin MoS
2/WS
2heterostructures. Nat. Nanotechnol. 9, 682–686 (2014).
9. Rivera, P. et al. Observation of long-lived interlayer excitons in monolayer MoSe
2–WSe
2heterostructures. Nat. Commun. 6, 6242 (2015).
–1,700 –200 –100 0 100 200 300
V kx ky
d a
b
Pump delay time, tpp (ps)e
–0.5 0 0.5 5 10
0 Q (1/aWSe
2)
Energy (meV)
0.3 –0.3
c
intra
En,l
inter
En,l
Eground
0 0.5 1 1.5 2
Pump delay time, tpp (ps)
–0.5 0 0.5 5 10
ninter (1012 cm–2)nintra (1012 cm–2) 0 0.5 1 1.5
2 θ = 5° θ = 5°
θ = 5°
θ = 27°
+ -
+ -
AA AB
+
+ –
–
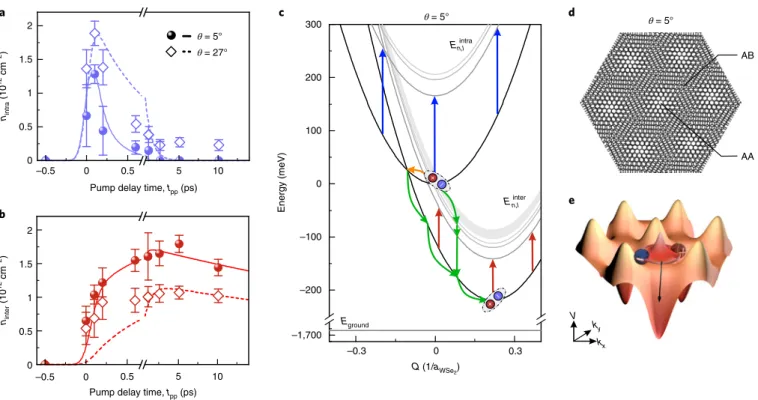
Fig. 4 | Ultrafast evolution of intra- and interlayer exciton densities and microscopic model. a,b, Intralayer (a) and interlayer (b) exciton density extracted by the fitting procedure of the data in Fig. 3a,b and Supplementary Fig. 4b,c,e,f as a function of the pump–probe delay time t
ppfor the WSe
2/ WS
2heterostructures with θ = 5° (spheres) and θ = 27° (diamonds). The solid and dashed curves in a and b represent the result of the microscopic model discussed in the text, for θ = 5° and 27°, respectively. Error bars represent the 95% confidence interval of the fitting procedure. c, Dispersion E
n,lof intra- and interlayer excitons in the two-particle picture, for θ = 5° and a number of quantum states characterized by the principle quantum number n
and the orbital quantum number l. Black parabolas: 1s excitons; grey parabolas: excitons with n > 1. The blue (red) arrows represent the 1s–2p transition
of intralayer (interlayer) excitons. Phonon scattering can spread the intralayer exciton population in momentum space (orange arrow). The cascades
of green arrows indicate possible decay channels for intralayer excitons to form interlayer states. The origin of the energy scale is shifted to the 1s
intralayer exciton state with vanishing centre-of-mass momentum Q in units of the reciprocal lattice constant of WSe
2, a
WSe2. d, Superposition of the two
monolayer lattices for a twist angle of θ = 5°, forming a moiré pattern in real space. Bright regions correspond to AA stacking, whereas darker regions
correspond to AB stacking. e, The real-space moiré pattern induces a local variation of the potential energy V, whose period and amplitude strongly
depend on the stacking angle. Small twist angles facilitate the localization of 1s interlayer excitons, giving rise to a blueshift of the 1s–2p resonance due to
increased quantum confinement.
10. Arora, A. et al. Interlayer excitons in a bulk van der Waals semiconductor.
Nat. Commun. 8, 639 (2017).
11. Ross, J. S. et al. Interlayer exciton optoelectronics in a 2D heterostructure p–n junction. Nano Lett. 17, 638–643 (2017).
12. Unuchek, D. et al. Room-temperature electrical control of exciton flux in a van der Waals heterostructure. Nature 560, 340–344 (2018).
13. Baranowski, M. et al. Probing the interlayer exciton physics in a MoS
2/MoSe
2/ MoS
2van der Waals heterostructure. Nano Lett. 17, 6360–6366 (2017).
14. Su, J.-J. & MacDonald, A. H. How to make a bilayer exciton condensate flow.
Nat. Phys. 4, 799–802 (2008).
15. Fogler, M. M., Butov, L. V. & Novoselov, K. S. High-temperature superfluidity with indirect excitons in van der Waals heterostructures. Nat. Commun. 5, 4555 (2014).
16. Yu, H., Liu, G.-B., Tang, J., Xu, X. & Yao, W. Moiré excitons: from
programmable quantum emitter arrays to spin–orbit-coupled artificial lattices.
Sci. Adv. 3, e1701696 (2017).
17. Ugeda, M. M. et al. Giant band gap renormalization and excitonic effects in a monolayer transition metal dichalcogenide semiconductor. Nat. Mater. 13, 1091–1095 (2014).
18. Chernikov, A. et al. Exciton binding energy and nonhydrogenic Rydberg series in monolayer WS
2. Phys. Rev. Lett. 113, 076802 (2014).
19. Poellmann, C. et al. Resonant internal quantum transitions and
femtosecond radiative decay of excitons in monolayer WSe
2. Nat. Mater. 14, 889–893 (2015).
20. Steinleitner, P. et al. Dielectric engineering of electronic correlations in a van der Waals heterostructure. Nano Lett. 18, 1402–1409 (2018).
21. Chen, H. et al. Ultrafast formation of interlayer hot excitons in atomically thin MoS
2/WS
2heterostructures. Nat. Commun. 7, 12512 (2016).
22. Miller, B. et al. Long-lived direct and indirect interlayer excitons in van der Waals heterostructures. Nano Lett. 17, 5229–5237 (2017).
23. Kunstmann, J. et al. Momentum-space indirect interlayer excitons in transition-metal dichalcogenide van der Waals heterostructures. Nat. Phys.
14, 801–805 (2018).
24. Mounet, N. et al. Two-dimensional materials from high-throughput computational exfoliation of experimentally known compounds.
Nat. Nanotechnol. 13, 246–252 (2018).
25. Huber, R. et al. How many-particle interactions develop after ultrafast excitation of an electron-hole plasma. Nature 414, 286–289 (2001).
26. Kaindl, R. A., Carnahan, M. A., Hägele, D., Lövenich, R. & Chemla, D. S.
Ultrafast terahertz probes of transient conducting and insulating phases in an electron–hole gas. Nature 423, 734–738 (2003).
27. Luo, L. et al. Ultrafast terahertz snapshots of excitonic Rydberg states and electronic coherence in an organometal halide perovskite. Nat. Commun. 8, 15565 (2017).
28. Ulbricht, R., Hendry, E., Shan, J., Heinz, T. F. & Bonn, M. Carrier dynamics in semiconductors studied with time-resolved terahertz spectroscopy.
Rev. Mod. Phys. 83, 543 (2011).
29. Wang, K. et al. Interlayer coupling in twisted WSe
2/WS
2bilayer heterostructures revealed by optical spectroscopy. ACS Nano 10, 6612–6622 (2016).
30. Brem, S., Selig, M., Berghaeuser, G. & Malic, E. Exciton relaxation cascade in two-dimensional transition metal dichalcogenides. Sci. Rep. 8, 8238 (2018).
Acknowledgements
The authors thank M. Furthmeier for technical assistance. This work was supported by the Deutsche Forschungsgemeinschaft (DFG) through research training group GRK 1570, Collaborative Research Center SFB 1277 (projects A05 and B03) and project grant KO3612/3-1. The Chalmers group acknowledges funding from the European Union’s Horizon 2020 research and innovation programme under grant agreement no. 696656 (Graphene Flagship) and the Swedish Research Council (VR).
Author contributions
R.H. and E.M. supervised the study. P.M., F.M., P.S., A.G. and R.H. carried out the experiments. P.S., P.M., F.M., A.G., K.-Q.L., P.N., J.H., C.S., J.M.L. and T.K. prepared and pre-characterized the large-area heterostructures. S.O., S.B. and E.M. carried out the theoretical modelling. All authors analysed the data, discussed the results and contributed to the writing of the manuscript.
Competing interests
The authors declare no competing interests.
Additional information
Supplementary information is available for this paper at https://doi.org/10.1038/
s41563-019-0337-0.
Reprints and permissions information is available at www.nature.com/reprints.
Correspondence and requests for materials should be addressed to E.M. or R.H.
Publisher’s note: Springer Nature remains neutral with regard to jurisdictional claims in published maps and institutional affiliations.
© The Author(s), under exclusive licence to Springer Nature Limited 2019
Methods
Sample fabrication and characterization. The TMD monolayers were fabricated via mechanical exfoliation
31. Starting from the bulk single crystal, a thin flake of the material was exfoliated with Nitto-tape and placed on a viscoelastic poly- dimethyl-siloxane (PDMS) substrate. By gently lifting the tape, a single monolayer of the TMD was left on the substrate. The monolayer was pre-characterized under an optical microscope before being stamped onto a diamond substrate using a micro-positioning stage. This procedure could be repeated to stack multiple monolayers on top of each other while accurately aligning their position and twist angle θ with the translation stage. To confirm the structural integrity and contact of the heterostructure sample we recorded room-temperature micro-photoluminescence intensity maps of the individual monolayers after the fabrication of the heterostructure, excited by a c.w. laser at a wavelength of 532 nm. The angle θ was identified by tracing the characteristic cleavage edges along the armchair and zigzag directions of the monolayers spanning a 120° angle.
Additionally, θ was confirmed for each heterostructure by polarization-resolved second harmonic generation
23,32. For this, a linearly polarized Ti:sapphire laser was used to excite the monolayers, and the polarization component of the second harmonic, parallel to the polarization of the fundamental, was analysed. This gave direct access to the armchair directions of the monolayers and therefore the twist angle of the hetero-bilayer.
Ultrafast NIR pump–MIR probe spectroscopy. Figure 1d presents a schematic of the experimental set-up. A 100 fs pump pulse centred at an energy of 1.67 eV (Supplementary Fig. 2a) from a home-built Ti:sapphire laser amplifier resonantly injects 1s A excitons into the WSe
2monolayer at a repetition rate of 400 kHz.
Another part of the laser output generates phase-locked MIR probe pulses by optical rectification in a 10-µm-thick GaSe crystal. This probe pulse propagates through the photoexcited sample after a variable delay time t
pp. The MIR waveform and any changes induced by the sample are fully resolved by electro-optic sampling in a second GaSe crystal, as a function of the electro-optic sampling time t
eos(Supplementary Fig. 2b). The MIR probe pulse is centred at a frequency of 22 THz with a full-width at half-maximum (FWHM) of 19 THz (Supplementary Fig. 2c, black curve) and a spectral phase that is flat between 15 and 45 THz (Supplementary Fig. 2c, blue curve). Using serial lock-in detection, we recorded the electric field of the MIR probe pulse propagating through the unexcited and the photoexcited sample. This allowed us to determine the pump-induced change
ΔE(teos) of the MIR electric field as function of the detection time t
eos. Applying a transfer matrix formalism, we thus had access to the full complex-valued dielectric response function, characterized by Δσ
1and Δε
1. This technique is sensitive to bound and unbound e–h pair populations, irrespective of interband selection rules, and may thus interrogate optically dark and bright excitons
33.
Solution of the Wannier equation and effective 2D Coulomb potential. The excitonic binding energies and wavefunctions were obtained by finding the eigenenergies E
b, and eigenfunctions φ
qof the Wannier equation (see equation (1) in the main text). Here q = (q,ϕ
q) is the electron–hole relative momentum in polar coordinates. The eigenfunctions can be expressed as φ φ
q= qeimϕq, where m is the azimuthal quantum number. The effective Coulomb potential V
q(z) is obtained by solving the Poisson equation for a point charge placed at z
= 0 inthedielectric environment:
ε ε ε ε ε ε ε ε ε ε ε
=
> + +
+ < < + +
< < +
− < <
< −
z
z d d d
d d z d d d
d z d d
d z d
z d
( )
1 1 2
2 1
2
for 12 1
1 2
2 1
1 2 2
0 air WSe gap WS
0 WS WSe gap WSe gap WS
0 gap WSe WSe gap
0 WSe WSe WSe
0 diamond WSe
2 2
2 2 2 2
2 2
2 2 2
2
We set the effective layer thicknesses d
WS2=d
WSe2= 0.57 nm and
d
gap= 0.1 ± 0.03 nm. For the relative permittivities we used εWSe2⊥ = 7.5, εWS2⊥= 6.3,
εWSe2∣∣ = 13.36, εWS2∣∣ = 11.75, εdiamond= 5, ε =1airand ε =
gap 1(refs.
34,35), where we account for the strong anisotropy of the dielectric tensor regarding the in- and out-of-plane direction of the adjacent TMD monolayers (see Supplementary Section 3 for details). The resulting potentials V
q(z) for a test charge at z = 0 and z
=12 WSed
2+d
gap+12 WSd
2were used as the intra- and interlayer potentials, respectively. These, as well as the resulting 1s and 2p binding energies and wavefunctions, can be seen in Fig. 2e,f. Although the interlayer exciton 1s–2p transition energy clearly differs from the intralayer resonance, the latter is very similar for the hBN (147 ± 3 meV; ref.
20) and the WS
2(142 ± 9 meV) cover layer (Supplementary Section 3).
From here, we can calculate the oscillator strengths of the intra- and interlayer excitons as
μ φ φ
=ℏ ∣ ∣ ⋅ ∣∣∣ ∣
f
2E r e
s p s p s p
1 ,2 2 1 ,2 1 2 2
where E
1 ,2s pis the 1s–2p transition energy and e is the polarization of the MIR
∣∣probe pulse. The oscillator strengths are 0.27 for intralayer excitons and 0.44 for interlayer excitons.
Three-fluid model. To analyse the measured MIR spectra more quantitatively, we apply a phenomenological three-fluid model. This approach describes the pump- induced change of the dielectric response function Δε(ω) =
Δε1(ω) + Δσ
1(ω)/(ε
0ω)as follows:
ε ε μ ω ωΔ ε μ ω ωΔ
ε μ ω ωΓ
Δ ω =
− − +
− −
+ − −
ℏ ℏ
ℏ
n e d
f n e
d
f
e d
A
( ) i i
i
(2)
s p E
s p E
E inter 2
0 inter
1 ,2inter
2 inter
intra2 0 intra
1 ,2intra
2 intra
2
0 inter 2
higher inter2
2 intra2
2
higher2 2
where e is the electron charge, ε
0denotes the vacuum permittivity, and f
1 ,2inters pand f
1 ,2intras pare the oscillator strengths of the 1s–2p transition in inter- and intralayer excitons calculated above. The first and second terms are Lorentzian resonances representing the 1s–2p line of the inter- and intralayer excitons, respectively. They include the interlayer (intralayer) exciton density n
inter(n
intra), their resonance energy E
inter(E
intra) and their linewidth Δ
inter(Δ
intra). The reduced mass of the interlayer excitons μ
inter=m
eWS2m
hWSe2∕(m
eWS2+m
hWSe2) 0 15= .m
0is determined with the effective electron mass in the conduction band of WS
2, m
eWS2= .0 27m
0, and the effective hole mass in the valence band of WSe
2, m
hWSe2= 0.36m
0(ref.
36).
Here, m
0is the free electron mass. The effective mass of the intralayer excitons
μintra= .0 16m
0is determined with the electron and hole effective masses within the WSe
2monolayer only
36. The thickness of the sample (treated as a thin slab in this model) is set to d = 0.7 nm (ref.
19). The third term in equation (2) phenomenologically models all transitions between higher excited e–h pair states with an effective Lorentzian featuring a resonance energy of E
higher= 4 meV, and aneffective scattering rate Γ
higher. The parameter A n
= higher higherf may be interpreted as an average density n
higherof excited-state bound and unbound e–h pairs weighted by a mean oscillator strength f
higher. As shown in ref.
30, excited-state transitions in excitons and unbound e–h pairs are indeed expected to occur below the photon energy of our MIR probe pulses. To restrict the number of adjustable parameters, we include all information known a priori: the 1s–2p transition energies of the intra- and interlayer excitons are kept at the values found in Fig. 2 (with a maximum allowable variation of 15%), conforming to theory. Similarly, the inter- and intraexcitonic linewidths are kept between 40 and 120 meV (refs.
19,20) and the excited-state scattering time is set below 200 fs. Strict limits on the possible values of n
inter, n
intraand A are set by the fact that both independently retrieved spectra Δσ
1and Δε
1have to be reproduced simultaneously. Without any further restrictions, the numerical adaptation of the measured spectra yields an overall good fit quality (Supplementary Fig. 4, black dashed curves). The temporal evolution of the fitting parameters is given in Fig. 4a,b and Supplementary Fig. 5.
Microscopic tunnelling model. The model presented here is an extension of the one detailed in ref.
37, in which equations of motion for exciton densities are derived microscopically using density matrix theory
38and the Heisenberg equation of motion in a second quantization formalism. It contains three main quantities:
the intralayer microscopic polarization P, the intralayer exciton density n
Qintraand the interlayer exciton density n
Qinter. Here Q is the electron–hole centre-of-mass momentum. These quantities only describe the 1s K–K states, where the Coulomb- bound electron and hole are both located at the K valley in the Brillouin zone. The higher excitonic states (2s, 3s, 4s and so on) are treated as a single quantity, n
higher. The exciton dynamics is described by the equations
Ω γ γ
∂ =t
P
( ) (t
− radintra+ )P
(3)pintra
γ γ δ
∂t
n
Qintra=2 | | −P
2 Q Qn
+ ∂tn
Q | + ∂tn
Q |T (4)pintra 2
radintra intra intra
p intra
0
γ δ γ
∂t
n
Qinter= −(2 Q+ )n
Q + ∂tn
Q | + ∂tn
Q | + ∂T tn
Q | (5)radinter
nonradinter inter inter
p inter inter
higher 0
∂t
n
higher= ∂tn
higher∣ + ∂T tn
higher∣ (6)higher
In equation (3), P is treated in its rotating frame, while Ω
( ) is the Rabit
frequency and describes the exciting optical pulse, which is modelled as a
Gaussian with a FWHM of 100 fs. γ
radintra= 2.59 ps−1and γ
pintra= 26.6 ps
−1are the
radiative and phonon-induced decay rates, respectively
37. The first describes
the radiative decay of excitons within the light cone. The latter leads to the formation of intralayer excitons as seen in the first term of equation (4). The second term in equation (4) describes the radiative decay of excitons within the light cone. The phonon scattering term
∂ | = ∑ Γ −Γ′ ′ ′ ′
n
(n n
)t Q
Q Q Q Q QQ Q intra
p p,intra intra
p,intra intra
couples intralayer exciton states with different momenta. The two terms in the sum describe in- and out-scattering, respectively, mediated by the intralayer phonon scattering rate Γ
p,intraQQ′which thermalizes the exciton distribution.
Because Γ
p,intraQQ′is a matrix there is no single way to quantify it as a number. It can, however, be instructive to examine the angle-averaged out-scattering rate
Γ
∑Q′ p,intraQQ′
, which lies between 40 and 140 ps
−1. The last term in equation (4) is the tunnelling term
∂tn
Qintra∣ = ∑T Q′ΓTintra inter,QQ−′ (n
Qinter′ − +(1 α)n
Qintra), coupling inter- and intralayer states with different momenta. The angle-averaged out- tunnelling rate
∑Q T QQ′Γintra inter, −′lies between 1.4 and 6.8 ps
−1. Finally, the factor
α=∑∑′ ≠μΓΓ −μ′ − = .′ −′ − 0 84
Q s T Qs Q T Qs s , 1 1,0 ,intra inter
1 1 ,intra inter,0
represents the excitons that tunnel into higher excitonic states.
Equation (5) describes the dynamics of interlayer excitons. The two decay rates in the first term are given by γ
radinter= 1.02 × 10⁻⁶ps
−1(ref.
37) and
γnonradinter = 0.03 ps−1, where the latter is of phenomenological character. The phonon scattering term ∂
tn
Qinter|phas the same form as for the intralayer exciton, with
∑Q′Γp,interQQ′lying between 6 and 40 ps
−1. Tunnelling is described by
Γ
∂t
n
Qinter∣ = ∑T Q′ Tintra inter,QQ−′ (n
Qintra′ −n
Qinter)where Γ
Tinter intra,QQ−′ =ΓTQ Q′−intra inter,
which makes the 1s tunnelling symmetric.
The final term
∂tn
Qinter∣higher=τ1(βn
higherδ − −Q0 (1 )βn
Qinter)describes the interaction with the higher excitonic states. It relies on the assumption that the higher states scatter down to the 1s light cone with zero momentum on a timescale
βτ, where τ
= 250 fs. It also includes backscattering into the higher states on a timescale
1−τβ. Here, we choose
β =Z1{exp[−Einter1 ,K Ks − ∕(k T)] exp[+ −Es − ′∕(k T)] exp[+ −Es −Λ∕(k T)]} 0 57= .B inter1 ,K K
B inter1 ,K
B
where T is the temperature, k
Bis the Boltzmann constant and Z is the canonical partition function. By doing this, it is ensured that the system will enter a Boltzmann distribution at equilibrium. Here, the K–K′ and K–Λ states have been taken into account as well. This is motivated by our calculations of the binding energies revealing that the 1s–2p transition energy differs by less than 1 meV from that of the K–K state.
Finally, equation (6) describes the dynamics of higher excitonic states. The first term
∂tn
higher∣ = ∑T α QQ′ΓTinter intra intra,QQ−′n
Q′describes tunnelling from the intralayer into interlayer excitons. The second term
β β
∂t
n
higher∣higher=1τ(
(1 )− ∑Q′n
Qinter′ −n
higher) handles the interaction with the 1s interlayer state.
To reproduce the densities shown in Fig. 4a,b we integrate over all momenta.
Hence we find n
inter= . ∑0 90 Q Qn
inter, where the factor 0.90 compensates for bleaching from the 2p states assuming a Boltzmann distribution. The corresponding factor for the intralayer excitons is considerably closer to 1.
In this model, only the tunnelling rate is affected by twisting
37. In the case of a twist angle of 27°, the energy-allowed momentum transfers for the K–K transition lie close to those for the K–K′ and K–Λ transitions. As a result the
∑Q T QQ′Γinter intra, −′rate for 27° ends up between 0.2 and 0.9 ps
−1.
Estimate of moiré confinement. Here we introduce a perturbative treatment to approximate the influence of the periodic modulation of the potential landscape
induced by the moiré pattern. Therefore, we solve the Schrödinger equation in polar coordinates r and φ assuming a circular finite potential well, meaning that
= ≤
V r r r
>V r r
( ) 0,
, 0
0 0
For V(r) we have chosen V
0= 0.1 eV and r0= 0.33am, where a
m= 3.4 nm is themoiré period for a stacking angle of θ
= 5° (ref. 39). Assuming the wavefunctions ψ to be separable in r and φ, we find the (unnormalized) bound-state solutions
ψ φ = ≤
>
φ φ +
+
− −
r
J k r e r r
J k r
K k r K k r e r r
( , ) ( ) ,
( )
( ) ( ) ,
nm
m m
m
m m m
i 0
0 0
i 0
where k
+= ℏ2μ2E
noutside and k
−= ℏ2μ2(V E
0− n)inside the potential well. The azimuthal quantum number is given by m, and J
mand K
mare the normal and modified Bessel functions of the first and second kinds. In the interval 0 ≤ E
n≤V
0, n denotes the nth solution to the equation:
− + − =
− − + − + +
+ − − + −
( )
E V
1 0
n K k r J k r J k r
J k r K k r K k r 0
( )( ( ) ( ))
( )( ( ) ( ))
m m m
m m m
0 1 0 1 0
0 1 0 1 0