The crop model included in Daisy Sören Hansen, Copenhagen, Denmark
Abstract
A brief description of the soil plant System Simulation model Daisy is given. The model includes a number of main modules viz. a hydrological model including a submodel for soil water dynamics, a soil temperature model, a soil nitrogen model including a submodel for soil organic matter dynamics, and a crop model including a submodel for water and nitrogen uptake. Special emphasis is given on the description of the crop growth part of the model and on related submodels. The soil part of the model has a one dimensional vertical structure. The soil profile is divided into layers on the basis of physical and Chemical soil characteristics. Examples of simulated results are given. The simulated results were compared to experimental data including concentration of inorganic nitrogen in soil, crop yield, and nitrogen accumulated in the shoot part of the crop.
1. Introduction
Due to the fact that losses of nitrogen from agricultural arable land to the aquatic environ- ment have increased in many areas, in particular during the recent four decades, great concern has arisen äs to how an economically and environmentally sustained agricultural crop production can be developed. This has called for development tools for general resources and land planning äs well äs for agro-ecosystem management. Comprehensive Simulation models of the soil plant atmosphere System constitute such a tool.
The present Danish Simulation model Daisy which is described in details elsewhere (Hansen et al., 1990) was developed to enable Simulation of crop production, soil water dynamics and nitrogen dynamics in crop production at various agricultural management practices and strategies. The Daisy Model has been applied at field level äs a manage- ment tool äs well äs at higher level, e.g. regionally, äs part of a model System for admini- strative purpose (Storm etal., 1990; Nielsen etal., 1991; Jensen etal., 1992; Hansen et al., 1992).
The present paper offers a brief description of the Daisy model with special emphasis on crop module and related submodels, viz. uptake of water and nitrogen by plant roots.
2. Model description
The model comprises a number of main modules viz. a hydrological model including a submodel for soil water dynamics, a soil temperature model, a soil nitrogen model including a submodel for soil organic matter dynamics, and a crop model including a submodel for nitrogen uptake. The soil part of the model has a one dimensional verticai structure. The soil profile is divided into layers on the basis of physical and chemical soil characteristics.
2.1 Hydrological processes
The hydrological processes considered in the model include snow accumulation and mel- ting, interception of precipitation by the crop canopy, evaporation from crop and soil sur- faces, Infiltration, water uptake by plant roots, transpiration, and verticai movement of water in the soil profile. In the model snow melting is influenced by incident radiation, and soil and air temperatures. Interception is determined either by precipitation or by the crop canopy. Description of evapotranspiration is based on a climatical determined potential evapotranspiration and the availability of water.
Modelling of water uptake by plant roots is based on a quasi steady state solution of the differential equation for radial water flow to the root surfaces, and the plant root density in the soil profile:
S = 271L-11
08 -1/2 In (r'rcL)
where L is root density, 9r is soil water content at the root surface, 08 is soil water content at Saturation, \j/8 and \j/r is soil water pressure potential of the bulk soil and at the root surface, respectively, ^ is hydraulic conductivity, and rr is root radius. The ratio 0/03 is assumed to represent a sort of contact resistance to water uptake by roots (Herkelrath et a/., 1977; Jensen et a/., 1988). The verticai movement of water in the soil profile is model- led by means of a numerical solution of the Richards equation.
Soil temperature is modelled by solving the heat flow equation taking into account heat transfer by conduction and convection, and changes in heat content by freezing and melting processes. The freezing process induces water flow in the soil äs ice formation is assumed to take place in the large soil pores extracting water from small soil pores resulting in water flow towards the freezing zone.
2.2 Soil biological processes
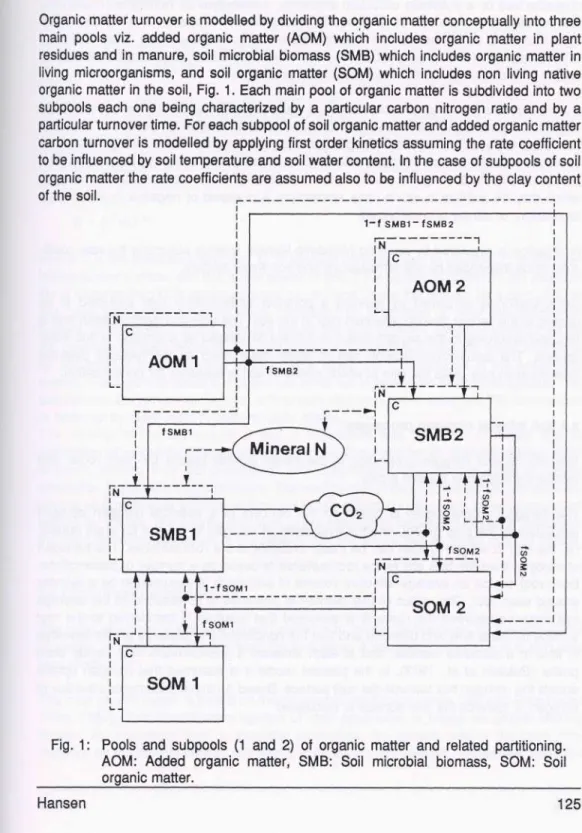
Organic matter turnover is modelled by dividing the organic matter conceptually into three main pools viz. added organic matter (AOM) which includes organic matter in plant residues and in manure, soil microbial biomass (SMB) which includes organic matter in living microorganisms, and soil organic matter (SOM) which includes non living native organic matter in the soil, Fig. 1. Each main pool of organic matter is subdivided into two subpools each one being characterized by a particular carbon nitrogen ratio and by a particular turnover time. For each subpool of soil organic matter and added organic matter carbon turnover is modelled by applying first order kinetics assuming the rate coefficient to be influenced by soil temperature and soil water content. In the case of subpools of soil organic matter the rate coefficients are assumed also to be influenced by the clay content of the soil.
Fig. 1: Pools and subpools (1 and 2) of organic matter and related partitioning.
AOM: Added organic matter, SMB: Soil microbial biomass, SOM: Soil
The biomass utilizes organic matter äs Substrate, Fig. 1. Each subpool of biomass is characterized by a Substrate utilization efficiency, a maintenance respiration coefficient, and an apparent death rate coefficient. The maintenance respiration and the death rate are assumed to be influenced by soil temperature and soil water content, and in the case of the resistant biomass subpool also by the clay content of the soil. Carbon is lost äs carbon dioxide due to the biomass respiration processes.
During biomass growth and decay carbon is translocated between the various subpools of organic matter, Fig. 1, during which processes mineral nitrogen is released or immobili- zed depending on the carbon nitrogen ratio of the organic matter being utilized äs Substrate and the carbon nitrogen ratio in the microorganisms being synthesized. The overall result of all the organic matter turnover processes is net mineralization of nitrogen which may be positive in which case ammonium is released or negative in which case ammonium or nitrate is immobilized.
Nitrification is simulated by applying Michaelis-Menten kinetics assuming the rate coeffi- cient to be influenced by soil temperature and soil water content.
Denitrification is simulated by defining a potential denitrification rate assumed to be related to the carbon dioxide evolution rate in the soil. The potential denitrification rate is reduced according to the oxygen Status of the soil expressed äs a function of soil water content. The actual denitrification rate is either determined äs the reduced potential denitrification rate or äs the rate at which nitrate in soil is available for denitrification.
2.3 Soil mineral nitrogen processes
The soil mineral nitrogen processes in the model include uptake by plant roots, and vertical movement in the soil profile.
The nitrogen uptake model is based on the concept of a potential nitrogen demand simulated by the crop model, and the availability of nitrogen in the soil for plant uptake, i.e. the rate at which nitrogen can be made available at the root surfaces. The transport of nitrogen from the bulk soil to the root surfaces is based on a number of assumptions.
Each root exploit an average effective volume of soil which is assumed to be a cylinder around each root. The radius of this cylinder is assumed to correspond to the average half distance between the roots. It is assumed that nitrogen is transferred to the root surface by mass flow and diffusion and that the concentration - distance profile develops in time in a stepwise manner, and at each timestep it approximates to a steady state profile (Baldwin et a/., 1973). In the present model it is assumed that nitrogen uptake equals the nitrogen flux towards the root surface. Based on these assumptions the flux of nitrogen ,l, towards the root surface is calculated:
2rcDb(ü-Cr) ß22ln P -1/2
( ß
2- 1 ) ü - C
rl n ß (ß
2- 1) - In ß
(ß
2- - (ß
2"
u- D C
ra = 0
cc = 2
eise
(2)
a =
where D is the diffusion coefficient, C is average concentration in solution, Cr is concen- tration at root surface, and b is buffer power of soil. If the uptake is limited by the availabi- lity of nitrogen then Cr is assumed equal to zero and hence the root act äs a zero sink. In this case total uptake of nitrogen is calculated by integrating ,1, over the entire root System. In the case of ample nitrogen supply the total nitrogen uptake is determined by the potential nitrogen demand. Then total uptake is distributed over the entire root zone by assuming a common value of Cr to exist along the root surfaces of the entire root System. Soil layers in which C< Cr are assumed not to contribute to nitrogen uptake. The calculations are performed for both ammonium and nitrate. It is assumed that ammonium is taken up by plant roots in preference to nitrate.
The mobility of the ammonium in soil is considered less than that of nitrate due to adsorption of ammonium to soil colloids which is described by an adsorption desorption isotherm derived from Schouwenberg and Schuffeien (1963). In the case of nitrate adsorption is considered insignificant. The vertical movement of nitrogen is modelled by means of a numerical solution of the convection dispersion equation for ammonium äs well äs for nitrate. The source sink term in the convection dispersion equation integrales the transformation processes in the case of ammonium äs well äs in the case of nitrate.
2.4 Crop growth processes
The main objective of the crop growth model is to constitute the basis for the Simulation of uptake of water and nitrogen from the root zone. A secondary objective is to simulate crop production.
The crop growth model is based on the concept of production levels (Witand Penning de Vries, 1982). This classification System of crop production is based on growth-limiting factors. At production level 1, potential production, the growth rate of the crop only depends on the current state of the crop and on the current weather, particularly radiation
and temperature. It is a basic assumption that the crop has ample supply of water and nutrlents. At production level 2, water-limited production, the growth rate of the crop is limited for at least part of the growing season due to shortage of water. Water deficiency is the only growth factor that reduces the crop production in comparison to production level 1. At production level 3, nitrogen limited production, the growth rate of the crop also may be limited due to shortage of nitrogen. In Daisy the only growth-limiting factors taken into account are water and/or nitrogen deficiency.
In the present model a crop is considered to consist of two or three parts viz. shoot, root, and in some cases also storage organs. The shoot is characterized by dry matter and nitrogen content, leaf area Index of photosynthetically active leaves, and total leaf area index. The root System is characterized by dry matter and nitrogen content, rooting depth and root density. When assumed present, storage organs are characterized by dry matter and nitrogen content.
The crop model is based on the thermal unit concept which imply that crop development from emergence to harvest can be described in terms of temperature sum. Plant emer- gence and leaf area index at the early stage of crop canopy development are simulated solely äs functions of temperature sum while leaf area index La, at later stages of crop canopy development is simulated äs of function of both temperature sum and accumula- ted amounts of shoot dry matter:
La,=
ET.SA,
(3)
where W8 is the accumulated amount of shoot dry matter, ETa is the temperature sum calculated from emergence, c is the specific leaf area index, and a, A1f and A,> are crop specific empirical constants. Equation (3) is used in simulating photosynthetically active leaf area index äs well äs total leaf area index. Only the empirical constants, a, A,, and A2, differs in the two cases.
Simulation of crop dry matter production is based on calculation of daily gross canopy photosynthesis, partitioning of assimilates between shoot and root, and respiration of shoot and root, respectively. The calculation of gross canopy photosynthesis is based on the assumptions that gross leaf photosynthesis can be described by a single light respon- se curve (Goudriaan and Laar, 1978) and that the light distribution within the crop canopy can be described by Beer's law. The daily gross canopy photosynthesis FQ|1 is calculated äs:
Fg,i =f'1 * Sa (4)
(6)
e = 0.15 - 0.158 - 0.094
L,,
Lg, + 3
s
aSa + 7.81 08
(5)
where f Is the energy content of carbohydrates, e is radiation conversion efficiency coefficient, Sa is absorbed photosynthetically active radiation in J m"2 day"1, /^ is the reflection coefficient of crop canopy, K is the extinction coefficient (0.6), S, is global radiation, and o^ is the fraction of photosynthetically active radiation (PAR) in the global radiation. Corresponding values of e, Lai and Sa were obtained by applying the basic assumptions on crop canopies with various values of Lal for days with various radiation patterns, and integrating the gross leaf photosynthesis over space and time. Equation (5) is the result of a parameterization of the relation between e, L^, and Sa. The numeric constants in the equation were obtained by use of agro-meteorological data measured at a location 55°40' N and 12°18' E (Hansen etal., 1981).
The assimilate partitioning between the considered crop components is simulated äs a function of temperature sum. For instance the relative amount of assimilates allocated to roots yr is estimated äs:
Yr = Yr,1 Yr,2 Yr,4
Yr,3EVAr.1
Ar,2"Ar,1
a
E T
a(7)
where yri1, yr>2, yr>3, yr,4, Ar>1, and \2 are crop specific empirical constants. The fraction of assimilates allocated to shoots y8 is then equal to 1-yr if the model do not take storage organs into account. If storage organs are considered then the fraction allocated to the storage organs ,y0, is calculated in a similar way äs yr, only the crop specific empirical constants differ. The remaining assimilate is allocated to the shoot. It is noted that internal pools of assimilate are not taken into account in this model. This approximation is assumed to be fairly good äs the time step of the model is one day.
The respiration is assumed to include growth respiration äs well äs a temperature dependent maintenance respiration (McCree, 1970). Thus the daily growth of shoot AWS
is calculated äs:
A W8= Ys( ysFg- rm ( SWs) (8)
where Y8 is the assimilate conversion coefficient, and rms is the temperature dependent (Q10 = 2) maintenance respiration coefficient. Caiculation of daily root growth or daily growth of storage organs is performed by analogy to the corresponding caiculation of daily shoot growth.
Root penetration is assumed to take place if a daily net root growth AWr occurs, 5f the soil temperature is above a certain limit Tp, and if the actual rooting depth dr is less than the maximum rooting depth allowed in the particular soii considered. Daily root penetration Adr
is calculated äs (Jacobsen, 1976):
Adr = vp (T8 - Tp) (9)
where vp is a root penetration rate and T8 is the soil temperature at the actual rooting depth dr.
The distribution of root density L in the soil profile is described in accordance with Gerwitz and Page (1974). In order to establish the root density distribution it is assumed that the total root length is proportional to the accumulated amount of root dry matter and that the root density at the rooting depth dr is 0.1 cm cm"3.
The gross canopy photosynthesis may be limited due to water and/or nitrogen deficiency.
The gross canopy photosynthesis under conditions of water deficiency Fg2 (production level 2) is calculated äs:
Frg,2
where Eac is actual crop evapotranspiration and Epc is potential crop evapotranspiration.
The gross canopy photosynthesis under conditions of nitrogen deficiency Fg 3 (production level 3) is calculated äs:
N - N °
FQ 3 = Fa 2 c c (11)
9> Nc a- Nc°
where Nc> Nc° and Nca is the amount of nitrogen in the crop at the actual nitrogen supply, at extremely Iow nitrogen supply, and at just ample nitrogen supply, respectively. The daily potential nitrogen demand ANUP is calculated äs
ANUP = Ncp - Nc 02)
where Ncp is the potential amount of nitrogen in the crop. The nitrogen concentrations corresponding to Ncp, Nca, and Nc°, respectively, are assumed to be functions of tempera- ture sum are illustrated in Fig. 2 for the two parts of a winter wheat crop viz. shoot and root.
§6:
i_ 5 "0) m -
a 4 - c 0 "
<p o -
0 -
l l l l I l Shoot
Limit 1 - Limit 2 - Limit 3 :
l l l l l l l l l l l l l
O ETk. O "
0)a 4 - g 3:
i i: o -
Root
Limit 1 - Limit 2 - Limit 3 :
500 1000 1500 Thermal time, degree day
l l l l l l l l l l l l l 500 1000 1500 Thermal time, degree day Fig. 2: Nitrogen concentrations äs function temperature sum at potential nitrogen content
(solid line), content at just ample nitrogen supply (dashed line), and content at extremely Iow nitrogen supply (dash dotted line).
At present the following crops has been included in the Daisy Model: ray grass for cutting, spring barley, winter wheat, spring rape, fodder beet and potato. Plans exist for including winter rape, spring wheat, and malze.
2.5 Management Model
The System management model allows for various agricultural management practices and strategies including different soil tillage, crop sowing, fertilization, Irrigation, and crop harvest.
The crop harvest routine allows for harvesting a fraction of the produced dry matter. Root dry matter is always left in the field and the corresponding carbon and nitrogen is alloca- ted to appropriate AOM-pools of the organic matter turnover model. Other residues may also be left in the field and enter the soil äs fresh organic matter (AOM-pools).
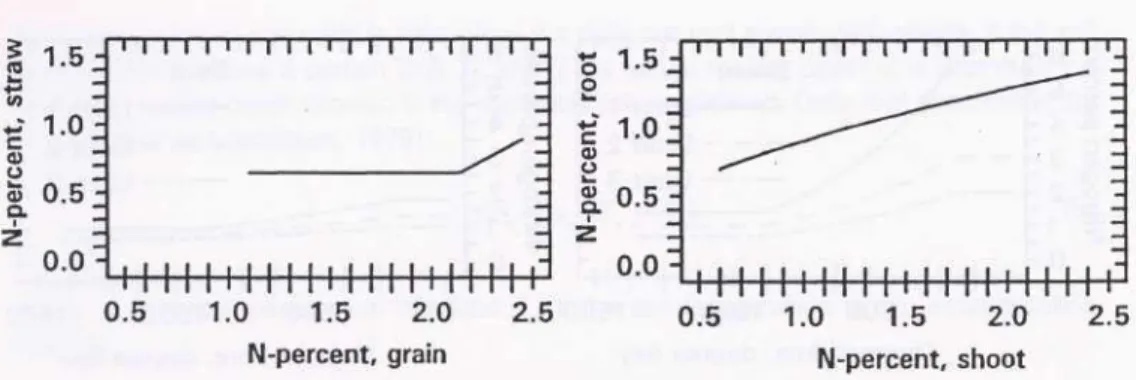
At harvest the crop nitrogen is distributed between the considered crop parts, root, shoot and in some cases also storage organs. To distribute crop nitrogen between root and shoot an equation of the type of equation (13) is used:
occ
(13)
where Cr and C8 is nitrogen concentration in per cent in root and shoot dry matter, respectively, and ccc is an empirical constant. In order to distribute crop nitrogen between shoot and storage organs linear or piecewise linear relations between the nitrogen concentrations of the considered parts is used. Fig. 3 exemplifies the adopted relations in the case of cereals.
1 5-l*° -
*-- 1.0c r
0)
0.5^
0.0-
I l r.
ü0)
0.0-
0.5 1.0 1.5 2.0 2.5 0.5 1.0 1.5 2.0 2.5 N-percent, grain N-percent, shoot
Fig. 3: Relations between nitrogen concentrations in crop parts at harvest in winter wheat.
2.6 Driving variables
Required meteorological variables to run the Simulation model are daily values of global radiation, air temperature, and precipitation. If a fluctuating groundwater table constitute the Iower boundary condition for the Simulation of the soil water dynamics then groundwa- ter table data also acts äs a driving variable.
2.7 Model initialization
The model requires a number of parameters and initial values in order to define and characterize the considered System. In general crop parameters only has to be assessed once. The task of including a new in Daisy is normally equivalent to assessing a new set of parameters.
3. Simulation results
Validation of the Daisy model is reported by Hansen etal. (1991 a), Hansen etal. (1991b), and Vereecken et al. (1991). In order to illustrate the capability of the model, Simulation results are compared with experimental results reported by Grootand Verberme (1991).
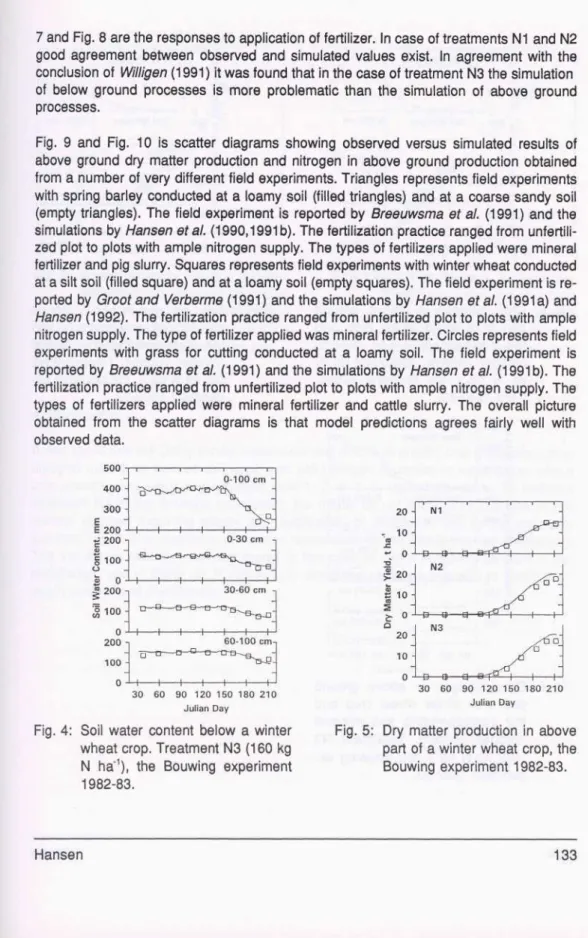
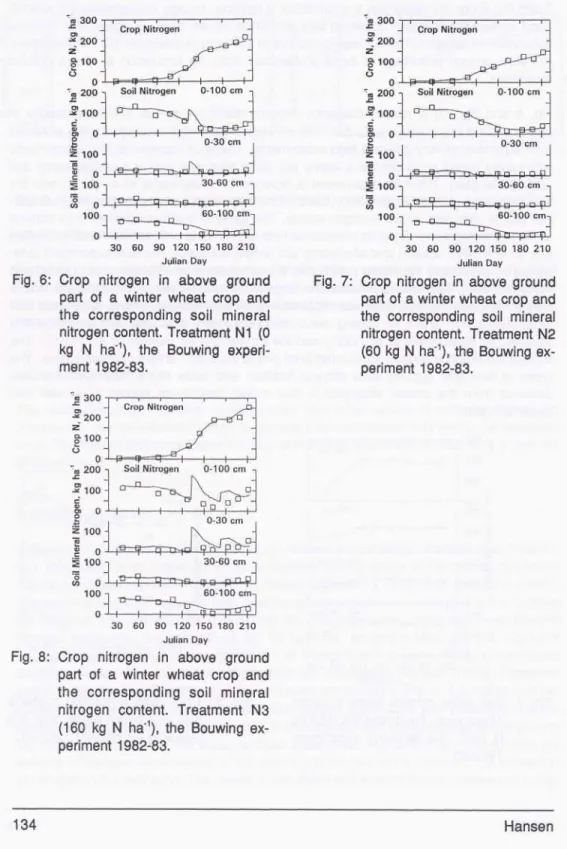
The experimental data originale from a winter wheat experiment conducted at the location the Bouwing, The Netherlands, during 1982-83. The experiment comprises three different nitrogen treatments, N1: unfertilized, N2: 60 kg N ha"1 applied in May, and N3: 120 kg N ha"1 applied in May plus a late application of 40 kg N ha"1 in June. Basic assumptions adopted in order to simulate the experiments are reported by Hansen (1992). Observed and simulated soil water content in the root zone are shown in Fig. 4. It is noted that the observed and simulated soil water extraction pattern agree fairly well indicating that the uptake pattern is simulated correctly. Fig. 5 shows simulated and observed above ground dry matter production at the three fertilizer treatments. Fig. 6 through 8 illustrates the amount of nitrogen accumulated in the above ground part of the crop and the extraction of nitrogen in the root zone. The peaks of simulated soil mineral nitrogen observed in Fig.
7 and Fig. 8 are the responses to application of fertilizer. In case of treatments N1 and N2 good agreement between observed and simulated values exist. In agreement with the conclusion of Willigen (1991) it was found that in the case of treatment N3 the Simulation of below ground processes is more problematic than the Simulation of above ground processes.
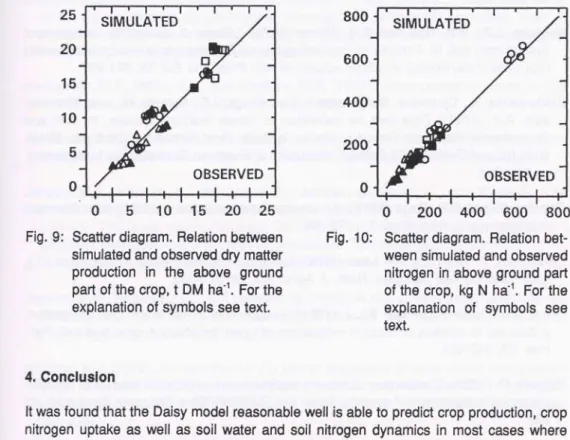
Fig. 9 and Fig. 10 is scatter diagrams showing observed versus simulated results of above ground dry matter production and nitrogen in above ground production obtained from a number of very different field experiments. Triangles represents field experiments with spring barley conducted at a loamy soil (filled triangles) and at a coarse sandy soll (empty triangles). The field experiment is reported by Breeuwsma et al. (1991) and the simulations by Hansen etal. (1990,1991 b). The fertilization practice ranged from unfertili- zed plot to plots with ample nitrogen supply. The types of fertilizers applied were mineral fertilizer and pig slurry. Squares represents field experiments with winter wheat conducted at a silt soil (filled square) and at a loamy soil (empty squares). The field experiment is re- ported by Grootand Verberme (1991) and the simulations by Hansen etal. (1991 a) and Hansen (1992). The fertilization practice ranged from unfertilized plot to plots with ample nitrogen supply. The type of fertilizer applied was mineral fertilizer. Circles represents field experiments with grass for cutting conducted at a loamy soil. The field experiment is reported by Breeuwsma et al. (1991) and the simulations by Hansen et al. (1991b). The fertilization practice ranged from unfertilized plot to plots with ample nitrogen supply. The types of fertilizers applied were mineral fertilizer and cattle slurry. The overall picture obtained from the scatter diagrams is that model predictions agrees fairly well with observed data.
500 400 -
20-
30 60 90 120 150 180 210 Julian Day
30 60 90 120 150 180 210 Julian Day
Fig. 4: Soil water content below a winter wheat crop. Treatment N3 (160 kg N ha"1), the Bouwing experiment 1982-83.
Fig. 5: Dry matter production in above part of a winter wheat crop, the Bouwing experiment 1982-83.
»300
30 60 90 120 150 180 210 Julian Day
Fig. 6: Crop nitrogen in above ground part of a winter wheat crop and the corresponding soil mineral nitrogen content. Treatment N1 (0 kg N ha'1), the Bouwing experi- ment 1982-83.
30 60 90 120 150 180 210 Julian Day
Fig. 8: Crop nitrogen in above ground part of a winter wheat crop and the corresponding soil mineral nitrogen content. Treatment N3 (160 kg N ha"1), the Bouwing ex- periment 1982-83.
0-30 cm
s 100
eso Ä
co 0 100
V/-OU l»lll i
bj "P—\ D T D P O ^p '
30-60 cm
-n—o-
cp D p u ip i 60-100 cmn
H h
30 60 90 120 150 180 210 Julian Day
Fig. 7: Crop nitrogen in above ground part of a winter wheat crop and the corresponding soii mineral nitrogen content. Treatment N2 (60 kg N ha"1), the Bouwing ex- periment 1982-83.
10 15 20 25 Fig. 9: Scatter diagram. Relation between
simulated and observed dry matter production in the above ground part of the crop, t DM ha"1. For the explanation of Symbols see text.
200
200 400 600 800
Fig. 10: Scatter diagram. Relation bet- ween simulated and observed nitrogen in above ground part of the crop, kg N ha"1. For the explanation of Symbols see text.
4. Conclusion
It was found that the Daisy model reasonable well is able to predict crop production, crop nitrogen uptake äs well äs soil water and soll nitrogen dynamics in most cases where crop growth takes place at production level 1, 2, or 3. In certain situations, for instance treatment N3 at the Bouwing experiment, the model do not account for the loss of soil mineral nitrogen occurring shortly after application of fertilizer in late spring and early summer, Fig. 8. The process or processes responsible for this loss is not well understood.
The value of a sufficient detailed model in this case is that it can point to gaps in our knowledge, and in doing so, it can help in designing research that aim at clarification poorly understood phenomena.
5. References
Baldwln, J.P., P.H. Nye and P.B. Tlnker (1973): Uptake of solutes by multiple root System from soll. III. A model for calculatlng the solute uptake by a randomly dispersed root System developing in a finite volume of soil. Plant and Soil 38: 621-635.
Breeuwsma, A., Djurhuus, D.U., Jansen, E.J., Kragt, J.F., Swerts, M., and Thomas- son, A.J. (1991): Data sets for validation of nitrate leaching models. In: Soil and Groundwater Research Report ii, Nitrate in Soils, Final Report on Contracts EV4V- 0098-NL and EV4V-00107-C-AM. Commission of European Communities, Luxembourg.
pp 219-234.
Gerwitz, S. and E.R. Page (1974): An empirical mathematical model to describe plant root Systems. J. Appl. Ecol. 11: 773-781.
Goudriaan, J. and H.H. van Laar (1978): Calculation of daily totals of the gross CO2
assimilation of leaf canopies. Neth. J. Agric. Sei. 26: 373-382.
Groot, JJ.R. and Verberme, E.LJ. (1991): Response of wheat to nitrogen fertilization, a data set to validate Simulation models for nitrogen dynamics in crop and soil. Fert.
Res. 27: 349-383.
Hansen, S. (1992): Comparison of two management-level Simulation models of nitrogen dynamics in the crop-soil System. Daisy and RZWQM. Dina Research Report 13, pp 23.
Hansen, S., Jensen, Sv.E., and Aslyng, H.C. (1981): Jordbrugsmeteorologiske observa- tioner, statistisk analyse og vurdering, 1955-1979. Hydroteknisk Laboratorium, Den Kgl.
Veterinser- og Landbohojskole. pp 414
Hansen, S., Jensen, H.E., Nielsen, N.E. and Svendsen, H. (1990): DAISY: A Soil Plant System Model. Danish Simulation model for transformation and transport of energy and matter in the soil plant atmosphere System, 369 pp. The National Agency for Environ- mental Protection, Copenhagen.
Hansen, S., Jensen, H.E., Nielsen, N.E. and Svendsen, H. (1991a): Simulation of nitrogen dynamics and biomass production in winter wheat using the Danish Simulation model Daisy. Fert. Res. 27: 245-259.
Hansen, S., Jensen, H.E., Nielsen, N.E. and Svendsen, H. (1991b): Simulation bio- mass, nitrogen uptake, and nitrogen leaching using the Daisy model. In: Soil and Groundwater Research Report ii, Nitrate in Soils, Final Report on Contracts EV4V- 0098-NL and EV4V-00107-C-AM. Commission of European Communities, Luxembourg.
pp 300-309.
Hansen, S.,Jensen, H.E., Stougaard, B., Jenson, C., and Holst, K. (1992): Translation of soll type patterns to agro-ecosystem management using the Daisy model. Proc. of Nordic Workshop on Använding av digitale geografiske databaser för hydrologisk modellering. Linköping Sverige. (in press).
Herkelrath, W.N, Miller, E.E., and Gardner, W.R. (1977): Water uptake by plants: II. The root contact model. Soil Sei. Soc. Am. J. 41: 1093-1043
Jacobsen, B.F. (1976): Jord, rodvaekst og stofoptagelse. In: Simuleret pianteproduktion.
Hydroteknisk Laboratorium. Den Kgl. Veterinaer- og Landbohojskole, K0benhavn.
Jensen, H.E., Hansen, S., Stougaard, B., Jensen, C., Holst, K., and Madsen, H.B.
(1992): Using GIS-information to translate soil type patterns to agro-ecosystem mana- gement - The Daisy model. European Conference on Integrated Research for Soil and Sediment Protection and Remediation. Maastricht, The Netherlands. Commission of the European Community, Directorate General for Science. Wageningen.
Jensen, C.R., Henson, I.E., amd Hansen, S. (1988): A root contact model and potentiai differences to water flow in soil plant System. Proc. of The International Congress of Plant Physiology, New Delhi, India, 2: 825-831.
McCree, K.J. (1970): An equation for the rate of respiration of white clover plants grown under controlled conditions. (Ed) l. Setlik. Prediction and measurement of photosyn- thetic productivity. Proc. IBP/PP technical meeting. Trebon 1969, Pudoc Wageningen 221-229.
Nielsen, H., Blicher-Mathiesen, G., Erlandsen, M., and Jensen, C. (1991): Modelbe- regning af den regionale kvaelstofudvaskning. Danmarks Milj0unders0gelser, Faglig rapport 16.
Richard, LA. (1931): Capillary conductivity of liquids in porous mediums. Physics 1, 318- 333.
Schouwenburg, J.Ch. van and A.C. Schuffeien (1963): Potassium-exchange behavior of an Hüte. Neth. J. Agric. Sei. 11, 13-22.
Storm, B., Styczen, M., and Clausen, T. (1990): Regional model for naeringssalttrans- port og omsaetming. 117 pp. The National Agency for Environmental Protection, Copenhagen.
Vereecken, H., Jansen, E.J., Hack-ten Broeke, M.J.D., Swerts, M., Engelke, R., Fabre- wltz, S., and Hansen, S. (1991): Comparison of Simulation results of five nitrogen models using different data sets. In: Soil and Groundwater Research Report ii, Nitrate in Soils, Final Report on Contracts EV4V-0098-NL and EV4V-00107-C-AM. Commis- sion of European Communities, Luxembourg. pp 321-338.
Willigen, P. de (1991): Nitrogen turnover in the soil-crop System; comparison of fourteen Simulation models. Fert. Res. 27:141-150.
Wit, C.T. and Penning de Vrles, F.W.T. (1982): La Synthese et la Simulation des syste- mes de production primaire. In: penning de Vries, F.W.T. and Djiteye, M.A. (Eds): La productivite des paturages saheliens. Agricultural Research Reports 918. Pudoc.
Wageningen.