The role of social cues and social reference points in economic decision-making
188
0
0
Volltext
(2)(3)
(4)(5)
(6)(7)
(8)(9)
(10)
(11)
(12)(13)
(14)
(15)
(16)
(17)
(18)
(19)
(20)
(21)
(22)
(23)
(24)
(25)
(26)
(27)
(28)
(29)
(30)
(31)
(32)
(33)
(34)
(35)
(36)
(37)
(38)
(39)
(40)
(41)
(42)
(43)
(44)
Abbildung
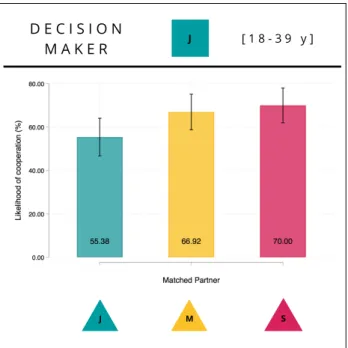
![Figure 3.1: Conditional decisions and experimental games D E C I S I O N M A K E R M A T C H E D P A R T N E R J J M S[ 1 8 - 3 9 y ] N = 1 3 0 a D E C I S I O N M A K E R M A T C H E D P A R T N E RMJMS[ 4 0 - 5 9 y ] N = 1 1](https://thumb-eu.123doks.com/thumbv2/1library_info/3755579.1510598/56.892.110.786.132.698/figure-conditional-decisions-and-experimental-games-d-rmjms.webp)
+7


ÄHNLICHE DOKUMENTE
“The term 'privacy' is best used as a shorthand umbrella term for a related web of things.. D2.4 SOCIAL, ETHICAL AND LEGAL ASPECTS OF BIG DATA AND URBAN DECISION MAKING.. ©
15 This is not an argument against Kuhn, but rather against the tradition of philosophy of science that sees the world mainly through the matrix of basic concepts
RT results replicate subliminal RT priming effects found for simple (button press) responses in a choice reaction time task (response congruency effect 23,28 ): responses
duced as a particularly sophisticated Bayesian framework to understand causal con- nectivity (changes) between brain regions (Friston et al., 2003). In the four main studies of
The authority hypothesis predicts that (a) participants should decide more strongly according to their private information (and should be more confident) when the medical
The Combinatorial Optimization criterion of Blin and Whinston is shown to be monotonically related to the Kemeny function criterion proposed by Levenglick.. The set covering
Gollwitzer and Schaal (1998) tested the efficacy oftwo types of implementation intentions in promoting task performance. In the goal intention condition, participants only
Instead, the country in which the difference in incomes between the high-income natives and the low-income natives is larger should admit more asylum seekers (as a
