• Keine Ergebnisse gefunden

poly(dimethylsiloxanes) and other polymers: Development and optimization of a polymer HPLC method

N/A
N/A
Protected

Academic year: 2021

Aktie "poly(dimethylsiloxanes) and other polymers: Development and optimization of a polymer HPLC method"

Copied!
201
0
0

Wird geladen.... (Jetzt Volltext ansehen)

Volltext

(1)

Analyzing the chemical heterogeneity of

poly(dimethylsiloxanes) and other polymers: Development and optimization of a polymer HPLC method

Dissertation

zur Erlangung des Doktorgrades der Naturwissenschaften (Dr. rer. nat)

der Fakultät für Chemie und Pharmazie der Universität Regensburg

vorgelegt von Bernhard Durner aus Mitterskirchen

April 2019

(2)

Die vorgelegte Dissertation entstand im Zeitraum von Oktober 2016 bis Januar 2019 in Kooperation des Instituts für Analytische Chemie, Chemo- und Biosensorik der naturwissenschaftlichen Fakultät IV – der Universität Regensburg

und

der Corporate Analytics der Wacker Chemie AG in Burghausen.

Die Arbeit wurde angeleitet von Prof. Dr. habil. Frank-Michael Matysik und durchgeführt unter der Leitung von Dr.-Ing. Thomas Ehmann.

Das Promotionsgesuch wurde eingereicht am: 29.04.2019 Termin des Kolloquiums: 12.07.2019

Den Vorsitz des Prüfungsausschusses übernimmt Prof. Dr. Alkwin Slenczka. Erstgutachter ist Prof. Dr.

Frank-Michael Matysik, Zweigutachter ist Prof. Dr. Christian Neusüß und Drittprüfer ist Prof. Dr. Hubert Motschmann.

Die Dissertation enthält entsprechend der Geheimhaltungserklärung der Wacker Chemie AG keine Details

bzw. lässt keine Rückschlüsse auf konkrete Produkte von WACKER zu. Auf Grund der Unvereinbarkeit der

Geheimhaltungserklärung und der Veröffentlichungspflicht, beschrieben in der Promotionsordnung der

Universität Regensburg, wurden in den entsprechenden Abschnitten der Dissertation keine detaillierten

Aussagen zu Produkten von WACKER gemacht.

(3)

„Ein Chemiker, der kein Physiker ist, ist überhaupt gar nichts.“

„A chemist who is not a physicist is nothing at all.”

Robert Wilhelm Bunsen, 1811 – 1899

(4)

Table of contents

I

Table of contents

TABLE OF CONTENTS I

LIST OF PUBLICATIONS VI

CONFERENCE CONTRIBUTIONS XIII

Oral Presentations XIII

Poster Presentations XIII

DECLARATION OF COLLABORATION XIV

LIST OF ABBREVIATIONS XV

INTRODUCTION 1

BASICS OF POLYMER LIQUID CHROMATOGRAPHY 4

2.1 Introduction 4

2.2 Polymer liquid chromatography modes 7

2.3 Size exclusion chromatography 8

2.4 Liquid chromatography at critical conditions 10

2.4.1 Barrier techniques 11

2.4.2 Gradient SEC 12

2.5 Polymer HPLC 13

2.5.1 Liquid adsorption chromatography 19

2.5.2 Precipitation-/ re-dissolution chromatography 20

2.5.3 Temperature gradient interaction chromatography 21

2.6 References 22

(5)

Table of contents

II

EXPERIMENTAL 31

3.1 Chemicals and materials 31

3.2 Measurements 31

3.2.1 HPLC 31

3.2.2 SEC 32

3.2.3 MALDI-ToF-MS 32

SEPARATION OF LINEAR AND CYCLIC POLY(DIMETHYLSILOXANES) 33

4.1 Separation of linear and cyclic poly(dimethylsiloxanes) with polymer high performance liquid

chromatography – Part I 33

4.1.1 Abstract 34

4.1.2 Introduction 35

4.1.3 Material and methods 36

4.1.3.1 Reagents and chemicals 36

4.1.3.2 Instrumentation 36

4.1.4 Results and discussion 38

4.1.4.1 Optimization of stationary phase 38

4.1.4.2 Optimization of mobile phase composition 39

4.1.4.3 Explanation of separation mechanism 40

4.1.5 References 41

4.2 Separation of linear and cyclic poly(dimethylsiloxanes) with polymer high performance liquid

chromatography – Part II 42

4.2.1 Abstract 43

4.2.2 Introduction 44

4.2.3 Material and methods 46

4.2.3.1 Polymer standards, mobile and stationary phases 46

4.2.3.2 Instrumentation 47

4.2.4 Results and discussion 48

4.2.5 Conclusion 58

4.2.6 References 59

(6)

Table of contents

III

ADAPTION OF A PARALLEL-PATH POLY(TETRAFLUORETHYLENE) NEBULIZER TO AN EVAPORATIVE LIGHT SCATTERING DETECTOR: OPTIMIZATION AND

APPLICATION TO STUDIES OF POLY(DIMETHYLSILOXANE) OLIGOMERS AS A MODEL

POLYMER 62

5.1 Abstract 63

5.2 Introduction 64

5.3 Material and methods 68

5.3.1 LC system and ELSD 68

5.3.2 Stationary phases 69

5.3.3 Caffeine analysis 69

5.3.4 PDMS analysis 69

5.4 Results and discussion 70

5.4.1 Caffeine measurements 71

5.4.2 PDMS measurements 76

5.4.2.1 ELSD optimization 76

5.4.2.2 Comparison of nebulizer long-term stability 80

5.4.2.3 PDMS oligomer analysis 82

5.5 Conclusion 84

5.6 References 85

HIGH-RESOLUTION POLYMER HPLC 88

6.1 High-Resolution Polymer High Performance Liquid Chromatography: Application of a saw tooth gradient

for the separation of various polymers 88

6.1.1 Abstract 89

6.1.2 Introduction 90

6.1.3 Material and methods 93

6.1.3.1 Software 93

6.1.3.2 Hardware 94

6.1.3.2.1 LC systems and detectors 94

6.1.3.2.2 Studies of the real shape of the gradient profile 95

(7)

Table of contents

IV

6.1.3.2.3 Semi preparative LC systems 95

6.1.3.3 Stationary phases 97

6.1.3.4 Polymer samples and chemicals 98

6.1.4 Results and discussion 99

6.1.4.1 Fundamental studies of the saw tooth gradient 99

6.1.4.1.1 Development – from linear gradient to saw tooth gradient 99 6.1.4.1.2 Investigation of the gradient profile of the saw tooth approach 102

6.1.4.2 Application to polymer samples 108

6.1.4.2.1 Preparative HRP-HPLC 108

6.1.4.2.2 Application to various polymer types 116

6.1.5 Conclusion 121

6.1.6 References 122

6.2 High-Resolution Polymer High Performance Liquid Chromatography: Optimization of the saw tooth gradient profile for various stationary phases and separations on preparative scale 126

6.2.1 Abstract 127

6.2.2 Introduction 128

6.2.3 Material and methods 130

6.2.3.1 Mobile phase components and polymer standards 130

6.2.3.2 Optimization of LC flow rate 130

6.2.3.3 Evaluation measurements of various saw tooth gradient profiles 131

6.2.3.4 Comparison of different LC columns 131

6.2.3.5 HRP-HPLC using a SEC column 133

6.2.3.6 Preparative HRP-HPLC 133

6.2.4 Results and discussion 135

6.2.4.1 Optimization of LC flow rate 135

6.2.4.2 Development and evaluation of various saw tooth gradient profiles 137

6.2.4.2.1 Saw tooth gradient down-to-zero 137

6.2.4.2.2 3D saw tooth gradient 139

6.2.4.2.3 Ternary saw tooth gradient 140

6.2.4.3 Application of HRP-HPLC to different LC stationary phases 141

6.2.4.3.1 Comparison of classical HPLC stationary phases 141

6.2.4.3.2 One column – two separation mechanisms 144

6.2.4.4 Optimization of preparative HRP-HPLC 146

6.2.5 Conclusion 149

6.2.6 References 150

(8)

Table of contents

V

6.3 Comparison of Molar Mass Determination of Poly(dimethylsiloxanes) by Size Exclusion Chromatography and High-Resolution Polymer High Performance Liquid Chromatography Based on a Saw Tooth Gradient 152

6.3.1 Abstract 153

6.3.2 Introduction 154

6.3.3 Material and methods 156

6.3.3.1 Mobile phase compounds and polymer standards 156

6.3.3.2 Preparative HRP-HPLC based on a saw tooth gradient 157

6.3.3.3 SEC equipment and measurements 158

6.3.3.4 Analytical HRP-HPLC based on a highly resolved saw tooth gradient 158

6.3.4 Results and discussion 159

6.3.4.1 Preparative HRP-HPLC for PDMS fractionation and SEC data evaluation 159 6.3.4.2 Correlation of average molar masses to HRP-HPLC retention times 165

6.3.5 Conclusion 169

6.3.6 References 170

CONCLUSION AND OUTLOOK 174

SUMMARY 177

ZUSAMMENFASSUNG IN DEUTSCHER SPRACHE 178

APPENDIX A: SEPARATION OF LINEAR AND CYCLIC PDMS 179 APPENDIX B: OPTIMIZATION OF THE SAW TOOTH GRADIENT 180 APPENDIX C: APPLICATIONS OF A SAW TOOTH GRADIENT 181

EIDESSTATTLICHE ERKLÄRUNG 182

(9)

List of publications

VI

List of publications

Adaption of a parallel-path poly(tetrafluoroethylene) nebulizer to an evaporative light scattering detector: Optimization and application to studies of poly(dimethylsiloxane) oligomers as a model polymer

Bernhard Durner, Thomas Ehmann, Frank-Michael Matysik Journal of Chromatography A 1564 (2018) 214-223.

Abstract

The adaption of a parallel-path poly(tetrafluoroethylene)(PTFE) ICP-nebulizer to an evaporative light

scattering detector (ELSD) was realized. This was done by substituting the originally installed concentric

glass nebulizer of the ELSD. The performance of both nebulizers was compared regarding nebulizer

temperature, evaporator temperature, flow rate of nebulizing gas and flow rate of mobile phase of

different solvents using caffeine and poly(dimethylsiloxane) (PDMS) as analytes. Both nebulizers showed

similar performances but for the parallel-path PTFE nebulizer the performance was considerably better at

low LC flow rates and the nebulizer lifetime was substantially increased. In general, for both nebulizers

the highest sensitivity was obtained by applying the lowest possible evaporator temperature in

combination with the highest possible nebulizer temperature at preferably low gas flow rates. Besides the

optimization of detector parameters, response factors for various PDMS oligomers were determined and

the dependency of the detector signal on molar mass of the analytes was studied. The significant

improvement regarding long-term stability made the modified ELSD much more robust and saved time

and money by reducing the maintenance efforts. Thus, especially in polymer HPLC, associated with a

complex matrix situation, the PTFE-based parallel-path nebulizer exhibits attractive characteristics for

analytical studies of polymers.

(10)

List of publications

VII

High-Resolution Polymer High Performance Liquid Chromatography: Application of a saw tooth gradient for the separation of various polymers

Bernhard Durner, Thomas Ehmann, Frank-Michael Matysik Journal of Chromatography A 1587 (2019) 88-100.

Abstract

Currently, a lot of research effort in polymer analysis by liquid chromatographic techniques, including size exclusion chromatography, polymer HPLC or liquid chromatography at critical conditions, is done aiming to improve separation performance. In this study, novel gradient protocols were investigated primarily based on gradient polymer elution chromatography (GPEC). Starting with linear gradients and stepwise gradients a new saw tooth gradient profile was developed and optimized. Optimum settings for the saw tooth gradient design were evaluated by design of experiments (DoE) based on Taguchi’s methodology for various types of stationary phases. The gain of peak resolution was dependent on the effective gradient step height. The optimized protocol enabled high-resolution polymer HPLC (HRP- HPLC) separations with common HPLC instruments. The quality of separation was evaluated by heart-cut fraction collection of HRP-HPLC and subsequent determination of the individual fractions by SEC or MALDI-ToF mass spectrometry. Finally, different types of polymers, such as PVC, PDMS, PMMA, or PPG, were studied with the new method and a universal applicability was shown.

Separation of linear and cyclic poly(dimethylsiloxanes) with polymer high performance liquid chromatography

Bernhard Durner, Thomas Ehmann, Frank-Michael Matysik

Accepted in Monatshefte für Chemie – Chemical Monthly (2019) DOI:10.1007/s00706-019-02389-4.

Abstract

The growing importance of siloxanes in various industrial areas, e.g. health care, cosmetics, automotive

and construction industries requires further method development of analysis techniques. In addition, and

complementing gas chromatography analysis, a polymer liquid chromatography method for separation of

linear and cyclic (poly)dimethylsiloxanes was developed and optimized. By an appropriate choice of

(11)

List of publications

VIII

mobile and stationary phase combinations, separations up to 30 monomeric units are achieved.

Therefore, various HPLC columns were investigated concerning physical and chemical properties, e.g. pore size, silica base material, and column functionality. Furthermore, solubility properties of siloxanes in adsorption and desorption promoting solvents were investigated and taking these results into account the separation was optimized applying a mixture of methanol: water (75:25, v/v) and acetone. The findings indicate, that precipitation / re-dissolution effects superimposed by adsorption chromatography result in the oligomer separation of up to 30 monomeric units. Besides method development on an analytical scale, linear poly(dimethylsiloxane) oligomers were separated with preparative polymer HPLC.

These fractions of single oligomers allow further investigations of different material properties beyond polymer HPLC.

High-Resolution Polymer High Performance Liquid Chromatography: Optimization of the saw tooth gradient profile for various stationary phases and separations on preparative scale

Bernhard Durner, Thomas Ehmann, Frank-Michael Matysik Submitted for publication

Abstract

The recently introduced saw tooth gradient for high-resolution polymer HPLC was optimized and

improved in terms of total runtime and separation performance. As a result, increased flow rates enabled

reduced runtimes in combination with enhanced peak resolutions. Moreover, the saw tooth gradient

profile was further investigated using a saw tooth gradient with a down-to-zero approach which

corresponds to an increased height of the negative backward gradient step. Modifying the mobile phase

composition allowed two further gradient protocols: a ternary and a three-dimensional setup. Thereby, a

ternary saw tooth gradient is characterized by repeating the whole gradient elution with two adequate

pairs of adsorption and desorption promoting solvents for mixtures containing diverse polymer

components. A three-dimensional saw tooth gradient is determined by combining three different solvents

in the gradient elution. In addition to mobile phase modifications, various stationary phases were

compared and examined. Applying size exclusion chromatography (SEC) columns for saw tooth gradient

polymer elution chromatography enabled the exploitation of two completely different separation

mechanisms (SEC and high-resolution polymer HPLC) on one stationary phase. Thus, two-dimensional,

(12)

List of publications

IX

heart-cut coupling of SEC and high-resolution polymer HPLC with only one stationary phase could be achieved. The application of the above-mentioned concept is presented for a silicone oil with a viscosity of 350 mPa∙s by using a hybrid HPLC system consisting of a Thermo Fisher Scientific HPLC and an Agilent fraction collector.

Comparison of Molar Mass Determination of Poly(dimethylsiloxanes) by Size Exclusion Chromatography and High-Resolution Polymer High Performance Liquid Chromatography Based on a Saw Tooth Gradient

Bernhard Durner, Beate Scherer, Thomas Ehmann, Frank-Michael Matysik Accepted in ACS Applied Polymer Materials

Abstract

Polysiloxanes are used in a wide range of application fields and extensive research is currently done to enhance product quality and performance. Therefore, more sophisticated analysis methods are necessary to monitor and support the polymer product optimization. Based on different modes in polymer liquid chromatography, heart-cut two-dimensional polymer HPLC is one powerful analytical approach. Due to different distributions within polymer samples, separations according to chemical heterogeneities, molecular architecture or molar mass differences are possible. With the recently introduced saw tooth gradient protocol a new possibility for determining the polymer (micro-) structure on analytical scale has been developed. Hence, the effect of various stationary phases with different particle base material and chemical modifications were investigated in context of the separation of linear poly(dimethylsiloxane) in a molar mass range from 1000 g∙mol

-1

to 300 000 g∙mol

-1

. The resulting chromatograms allowed a direct correlation between HPLC retention times and molar masses corresponding to separated peaks.

Consequently, a detailed analysis of differences in the polymer structure, e.g. fingerprint analysis, is

possible.

(13)

List of publications

X

Miscellaneous

Development and application of a method for ivory dating by analyzing radioisotopes to distinguish legal from illegal ivory

Andreas Schmidberger, Bernhard Durner, David Gehrmeyer and Robert Schupfner Forensic Science International 289 (2018) 363-367.

Abstract

The age determination of elephant ivory provides necessary and crucial information for all criminal

prosecution authorities enforcing the Convention on International Trade in Endangered Species of Wild

Fauna and Flora. The knowledge of the age of ivory allows to distinguish between pre-convention, hence

legal material and ivory deriving from recent, illegal poaching incidents. The commonly applied method

to determine the age of ivory is radiocarbon dating in the form of bomb pulse dating, which however will

fade out soon. This work provides an enhancement of the radiocarbon dating method by supplementary

determination of the isotope profile of 90-Sr and the two thorium isotopes 228-Th and 232-Th. This

combined analysis allows for a precise and unambiguous age determination of ivory. We provided

calibration curves for all involved radionuclides by analyzing ivory samples with known age and

investigated a new method for the extraction of strontium from ivory.

(14)

List of publications

XI

Investigations on the decomposition of AdBlue urea in the liquid phase at low temperatures by an electrochemically induced pH shift

Peter Braun, Bernhard Durner, Hans-Peter Rabl, Frank-Michael Matysik

Accepted in Monatshefte für Chemie – Chemical Monthly (2019) DOI:10.1007/s00706-019-02406-6.

Abstract

Ammonia-based selective catalytic reduction (SCR) systems are the most widely used technology for

reduction of nitrogen oxide emissions from lean-burn engines such as diesel engines. However, at low

exhaust temperatures, the SCR process is limited by difficulties in the decomposition of the ammonia

precursor urea, which is carried on-board using an aqueous solution “AdBlue”. In this study, the

decomposition of AdBlue urea induced by electrical current and the resulting associated pH shifts was

investigated in a divided cell configuration in the liquid phase. The decomposition was found to be

favoured in both electrochemical compartments, anodic and cathodic, at temperatures of 60 °C – 80 °C

compared to a reference without electrochemical treatment. In addition to the determination of

ammonia contents, IC/HPLC analyses were carried out for each sample. Different side products such as

biuret, nitrate, cyanuric acid, ammelide and others were formed. In the anodic compartment, nitrate

formation could be observed, due to oxidation of ammonia at the electrode surface.

(15)

List of publications

XII

Patents

Hochaufgelöste Flüssigchromatographie basierend auf einem Sägezahngradienten

Bernhard Durner, Thomas Ehmann, Wacker Chemie AG

European Patent: PCT/EP2018/064868, application 2018-06-06 Abstract

Die vorliegende Erfindung betrifft ein Verfahren zur Analyse einer Polymerprobe, wobei das Verfahren die

Durchführung einer Flüssigchromatographie-Analyse an einer Chromatographiesäule mit einer mobilen

Phase enthaltend eine Mischung aus mindestens einem Nichtlösungsmittel (S1) und mindestens einem

Lösungsmittel (S2) für die Polymerprobe umfasst, dadurch gekennzeichnet, dass der Volumenanteil an S2

in der mobilen Phase während des Elutionsprozesses stufenweise variiert wird und die Stufen

abwechselnd auf- und absteigen.

(16)

Conference contributions

XIII

Conference contributions

Oral Presentations

Konzernanalytikertreffen 2017 Wacker Chemie AG, 15 November 2017, Burghausen Separation of Linear and Cyclic Poly(dimethylsiloxanes) with Liquid Chromatography Bernhard Durner

14

th

International Students Conference “Modern Analytical Chemistry” 2018, 20 to 21 September 2018, Prague

Separation of linear and cyclic poly(dimethylsiloxanes) by interactive chromatography Bernhard Durner

29. Doktorandenseminar Hohenroda, 6 to 8 January 2019, Hohenroda

Interactive Chromatography for analyzing the Chemical Heterogeneity of Silicones and Poly(vinyl acetate)

Bernhard Durner

Thermo Fisher Scientific Chromatographie Anwenderseminare 2019, 12 March 2019, Wiesbaden

High Resolution Polymer HPLC: A new approach for the separation of various polymers based on the application of a saw tooth gradient

Bernhard Durner

ANAKON 2019, 25 to 28 March 2019, Münster

Anwendungen eines periodischen Sägezahngradienten in der Polymer HPLC Bernhard Durner

Poster Presentations

ANAKON 2017, 3 to 6 April 2017, Tübingen

Auftrennung linearer und zyklischer Polysiloxane durch interaktive Chromatographie

Bernhard Durner, Thomas Ehmann, and Frank-Michael Matysik

(17)

Declaration of collaboration

XIV

Declaration of collaboration

Most of the theoretical and experimental work presented in this thesis was carried out solely by the

author. In some cases, however, the practical implementation of concepts and the performance of

measurements were carried out in collaboration with other researchers and individuals. In accordance

with § 8 Abs. 1 Satz 7 of the Ordnung zum Erwerb des akademischen Grades eines Doktors der

Naturwissenschaften (Dr. rer. nat.) an der Universität Regensburg vom 18. Juni 2009 (Änderungssatzung

vom 6. Februar 2014) the declaration of collaboration is given separately in each relevant chapter.

(18)

List of abbreviations

XV

List of abbreviations

Acetonitrile (ACN)

Charged Aerosol Detector (CAD)

Condensation Nucleation Light Scattering Detector (CNLSD) Critical point of adsorption (CPA)

trans-2-[3-(4-tert-Butylphenyl)-2-methyl-2-propenylidene] malononitrile (DCTB) Design of Experiments (DoE)

Diode array detector (DAD)

Evaporative Light Scattering Detector (ELSD) Fluorescence detector (FLD)

Gas chromatography (GC)

Gel filtration chromatography (GFC) Gel permeation chromatography (GPC)

Gradient polymer elution chromatography (GPEC) High Performance Liquid Chromatography (HPLC)

High Performance Precipitation Liquid Chromatography (HPPLC)

High-Resolution Polymer High Performance Liquid Chromatography (HRP-HPLC) Liquid chromatography (LC)

Liquid chromatography at limiting conditions of adsorption (LC-LCA) Liquid chromatography at limiting conditions of desorption (LC-LCD) Liquid adsorption chromatography (LAC)

Liquid chromatography under critical conditions (LCCC)

(19)

List of abbreviations

XVI Multiangle laser light scattering detector (MALLS detector)

Matrix assisted Laser Desorption Ionization - Time of Flight- Mass Spectrometer (MALDI-ToF-MS) Methanol (MeOH)

Nuclear magnetic resonance spectroscopy (NMR spectroscopy) operational / performance qualification (OQ/PQ)

Pentafluorophenyl (PFP) Poly(dimethylsiloxane) (PDMS) Poly(methylmethacrylate) (PMMA) Poly(propylene glycol) (PPG) Polystyrene (PS)

Poly(tetrafluoroethylene) (PTFE) Poly(vinylchloride) (PVC)

Precipitation- / re-dissolution liquid chromatography (PLC) Refractive index (RI)

Size exclusion chromatography (SEC) Standard liter per minute (SLM) Tetrahydrofuran (THF)

Temperature gradient interaction chromatography (TGIC)

(20)

Introduction

1

Introduction

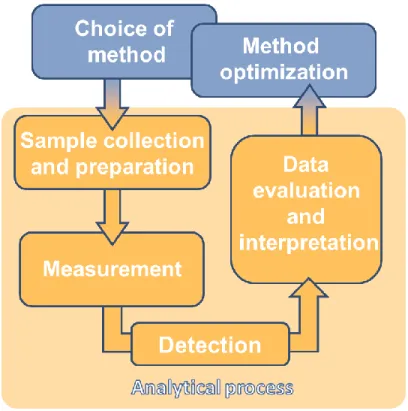
Responding issues connected to analytical chemistry, is an important aspect in science and industry. A lot of different quality and performance problems are solved through analytical chemistry by choosing the appropriate analysis techniques. Figure 1.1 gives an overview about the most important steps during the analysis of arbitrary substances. Therefore, it is important to know and control the analytical process [1], including sample collection and preparation, measurement, detection, and data evaluation as well as interpretation. Furthermore, suitable methods must be chosen and if necessary optimized.

Figure 1.1: Development of an analytical method within and in context to the analytical process.

Particularly, complex samples with high amounts of matrix or a lot of different constituents require chromatographic methods. Several molecular and vaporizable analytes can be separated with gas chromatography (GC). However, samples containing high amounts of matrix or high molecular weight compounds are not suited for GC separation and require liquid chromatography (LC) techniques.

Consequently, the different steps in and around the analytical process are very important for polymer analysis. As previously described, the choice of a proper method usually is the starting point of research.

Thus, if LC is required for polymer analysis, various modes, for example adsorption and size exclusion

chromatography or chromatography under critical conditions, are possible [2]. Therefore, it is important

(21)

Introduction

2

to know as much as possible about the polymer sample and demands of the customer in advance. A first important step during the analytical process is sampling and sample preparation. Particularly, the presence of polymer matrices and product heterogeneities has to be taken in account before or by collecting of the sample. Depending on the type of polymer, different techniques are crucial for a representative sample. Subsequent, polymer sample preparation requires plenty of expertise concerning solubility effects or extraction methods. Even if the sampling was representative and a homogenous sample was taken, the appropriate choice of solvent is important to dissolve the overall polymer.

Moreover, even the distribution of the polymer in solution may be an important and error-prone procedure, if polymer chains are degraded by too much stirring because of shear degradation. For example, high molar mass polymers require a long time before being completely dissolved without chain scission [3]. In the next step of the analytical process of polymer liquid chromatography, the successful collected and dissolved polymer sample is separated according to specific macromolecular properties, like molar mass distribution, chemical functionality distribution or a different molecular architecture. In general, depending on physical and chemical interactions different LC modes are worth to be considered and have to be discussed in this study. Furthermore, current separation methods show some limitations making improvements and optimizations necessary. However, successful measurements strongly depend on the capability and properties of the applied detectors. Therefore, every type of detector has its own advantages and disadvantages and further research may be done in choosing the ideal device appropriate for the particular task. Afterwards, the obtained data have to be carefully evaluated and interpreted under considering quality management, robustness and significance. Additionally, after the analytical process is completed, a feedback on the applied method is important and for ensuring competitiveness.

Emerging from the analytical process, robust and innovative polymer LC methods are crucial to analyze polymers. Therefore, various adjustments of stationary and mobile phases as well as instrumental optimizations were already done and have to be made. For example, based on sophisticated approaches of multi-linear or step-wise gradients [4,5] further optimization of the gradient profile will be presented.

In each case, the resulting methods should be as simple as possible and give versatile improvements

compared to the initial situation.

(22)

Introduction

3

References

[1] M. Otto (Ed.), Analytische Chemie, 4

th

ed., Wiley-VCH, Weinheim, 2011.

[2] L.R. Snyder, J.J. Kirkland, J.W. Dolan, Introduction to Modern Liquid Chromatography, 3

rd

ed., John Wiley & Sons, Hoboken, New Jersey, 2010.

[3] D. Held, Tips & Tricks GPC/SEC: The Art of Analyzing High Molar Mass Samples, The Column 10 (10) (2014) 12–15.

[4] Z. Deyl, K. Macek, J. Janák (Eds.), Liquid column chromatography: A survey of modern techniques and applications, Elsevier Scientific Pub. Co, Amsterdam, New York, 1975.

[5] P. Jandera, Simultaneous optimisation of gradient time, gradient shape and initial composition of

the mobile phase in the high-performance liquid chromatography of homologous and oligomeric

series, Journal of Chromatography A 845 (1-2) (1999) 133–144. https://doi.org/10.1016/S0021-

9673(99)00331-3.

(23)

Basics of polymer liquid chromatography Introduction

4

Basics of polymer liquid chromatography

2.1 Introduction

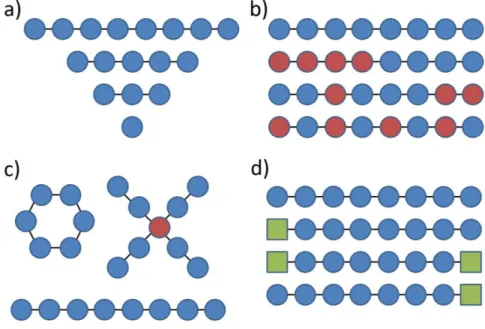
Polymers are built of a high number of monomers and consequently are statistically distributed in several properties. These distributions cause main differences in the quality of polymer products. Therefore, it is essential to investigate, analyze, and optimize the polymerization reaction. Figure 2.1 gives an overview about the most important polymer distributions, i.e. molar mass (a), chemical composition (b), molecular architecture (c), and functionality (d). Depending on the polymerization reaction, polymers may be homogeneous in all distributed properties (monodisperse polymers), heterogeneous in only one property (polydisperse polymers) or heterogeneous in more than one property (complex polymers).

Figure 2.1: Example for typical polymer heterogeneities: a) molar mass distribution, b) chemical composition distribution, c) molecular architecture differences, and d) chemical functionality distribution.

At least all synthetic polymers are polydisperse in the molar mass. Thus, analyzing the molar mass distribution is an important issue in liquid chromatography. Besides, as far as two or more monomers with different chemical composition take part in polymerization, chemical heterogeneities appear. As a result, copolymers with defined blocks, alternating sequences or randomly distributed monomer units are built.

The analysis of these polydisperse or complex polymers is a challenging task and often more than one

separation technique have to be applied [1–5]. Before discussing several typical liquid chromatographic

techniques for polymer analysis, a short overview of the investigated polymers of this study is given.

(24)

Basics of polymer liquid chromatography Introduction

5

Today, poly(siloxanes) are a very important group of synthetic polymers and are used in various industrial areas, e.g. health care, cosmetics, automotive and construction industries. Since the first synthesis by Müller and Rochow [6], siloxanes are used in a broad variety of different applications, e.g. silicone dispersions, elastomers, resins or rubbers [7–12]. A great deal of research was done on the chemical structure and composition of various poly(siloxanes). The combination of silicon, oxygen, and carbon atoms lead to very specific properties in between inorganic and organic chemistry. As depicted in Figure 2.2 the number of organic groups R in comparison to silicon – oxygen bonds cause the characteristics of the organo-poly(siloxanes). Furthermore, the number of silicon – oxygens bonds determine the functionality of the siloxane basic unit, from monofunctional for one Si-O bond to tetrafunctional for four Si-O bonds. The most important class of silicones is poly(dimethylsiloxane) (PDMS, compare the bifunctional poly(siloxane) in Figure 2.2), which contains only methylene groups as organic group and shows a two-dimensional linear structure [11,13].

Figure 2.2: Chemical structure of poly(siloxanes) in between inorganic and organic chemistry, R = organic group.

Based on their polymer structure, siloxane polymers show high temperature and weather resistance, good dielectric properties, a high film-forming capacity, physiological indifference, and anti-foaming effects.

Therefore, poly(siloxanes) are used among other things as sealants, paint additives, marine coatings, cooling liquids in transformers or masonry water repellants. Moreover, various application areas for silicones, e.g. automotive-, energy-, health care-, and construction- industry, are depicted in Figure 2.3.

Additional information about poly(siloxanes) can be found in [14–25].

(25)

Basics of polymer liquid chromatography Introduction

6

Figure 2.3: Overview about applications of silicone in industry (out of business unit presentation of Wacker Silicones, 2017).

Moreover, in this study such homopolymers as poly(methylmethacrylate) (PMMA), poly(propylene glycol) (PPG), polystyrene (PS), and poly(vinylchloride) (PVC) whose structures are depicted in Figure 2.4, are investigated.

Figure 2.4: Overview of additionally investigated homopolymers, a) PMMA, b) PPG, c) PS, and d) PVC.

(26)

Basics of polymer liquid chromatography Polymer liquid chromatography modes

7

2.2 Polymer liquid chromatography modes

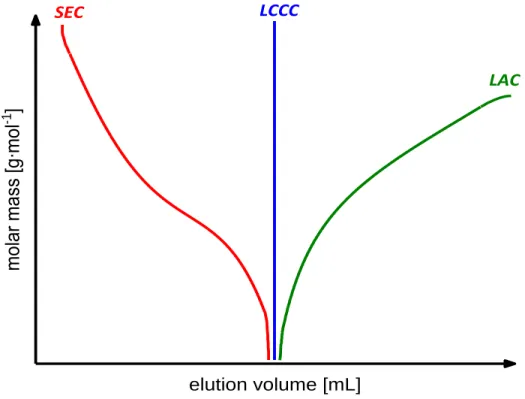
The heterogeneity of polymers requires different separation techniques in liquid chromatography. Based on molar mass, chemical composition, or molecular architecture distributions of the investigated polymer samples, the main purpose of polymer liquid chromatography is a separation or rather fractionation by molecular properties. Depending on the thermodynamic driving force, a differentiation in size exclusion chromatography, liquid chromatography under critical conditions and liquid adsorption chromatography can be made. For mostly entropy driven separations, size exclusion chromatography is the dominant mode, whereas for prevailing enthalpy effects liquid adsorption chromatography (LAC) is applied. In between both modes when entropic and enthalpic effects balance each other, liquid chromatography at critical conditions (LCCC) becomes possible [26–29]. An elugram showing all three different modes of polymer liquid chromatography is presented in Figure 2.5. In SEC mode the molar mass decreases with increasing elution volume and, vice versa, in LAC mode the molar mass increases with increasing elution volume. A more detailed theoretical description including a model for all three modes of polymer liquid chromatography can be found in [28]. In ideal LCCC, the elution of the polymer is independent of molar mass. A more detailed description of these three chromatography modes is given in the following chapters, in which LAC is summarized by the term polymer HPLC.

Figure 2.5: Elugram, showing the three different modes of polymer liquid chromatography.

mo lar ma ss [g ∙mo l -1 ]

elution volume [mL]

SEC LCCC

LAC

(27)

Basics of polymer liquid chromatography Size exclusion chromatography

8

2.3 Size exclusion chromatography

SEC is usually the method of choice for determination of the molar mass distributions of macromolecules.

For synthetic polymers SEC is also called gel permeation chromatography (GPC) because of the permeation of the analyte molecules into the pores of the stationary phase. For biopolymers separated by aqueous mobile phases, SEC is also referred to as gel filtration chromatography (GFC).

The separation mechanism is based on the size of the macromolecules in the eluent and thus on the hydrodynamic volume of the polymer. The stationary phase provides a packing material with different pore sizes and the mobile phase is ideally a strong solvent for the investigated polymer eliminating any chemical interactions between stationary phase and polymer. Under these conditions, the analytes are separated solely by their size, or to put it another way, the molar mass of the macromolecules. In SEC, high molar mass polymers which cannot penetrate the pores of the stationary phase elute first, or rather complete exclusion of these polymer molecules to the pores occurs (see Figure 2.6). At the end of the separation, the eluent which permeates all pores of the column elutes at the dead time. Thus, the separation of polymer samples must be done within the first and only passage through the SEC column.

This leads to elevated column lengths and the coupling of more than one column to enhance the separation range and the peak resolution. In contrast to the total stationary phase permeation of the organic solvent, a complete exclusion from all column pores leads to an unseparated polymer mixture.

Consequently, the separation range in SEC is primarily determined by the pore size distribution of the

used column, the combination of columns with different pore size, and the resulting total length of the

column [27,30,31].

(28)

Basics of polymer liquid chromatography Size exclusion chromatography

9

Figure 2.6: Mechanism in SEC in relation to a SEC elugram; with increasing retention time the molar mass of the eluting macromolecules decreases and at the end of separation the solvent molecules elute at the dead time.

Additionally, any chemical interactions between analyte and the stationary phase must be avoided, and

the mobile phase is solely the carrier transporting the macromolecules through the column. The relation

between elution volume or rather retention time and molar mass is usually established by a calibration

with monodisperse PS standards over the investigated molar mass range. Generally, it is assumed that the

hydrodynamic volume of the PS standards used for calibration acts the same as that of the investigated

polymer. Typically, refractive index (RI), multiangle laser light scattering (MALLS), diode array detectors

or viscometers are used as detector(s). In case of simultaneous MALLS and RI detection an absolute molar

mass determination is possible. Furthermore, combining multiple detectors as RI, MALLS detector and

viscometer information about the polymer branching can be obtained by a Mark-Houwink-Sakurada plot

[32,33]. The most prominent advantages of SEC include isocratic separation, fast and easy separation and

handling, a common relation between molar mass and retention time and a large molar mass range up to

400 million g∙mol

-1

. In contrast to that SEC shows only a low molar mass resolution, indirect determination

of molar masses via the hydrodynamic volumes in the used eluent, and the possibility of secondary

(chemical) interactions between analyte and stationary phase [34]. Further literature and information

about operating SEC with polymers is given in [34–41].

(29)

Basics of polymer liquid chromatography Liquid chromatography at critical conditions

10

2.4 Liquid chromatography at critical conditions

As already shown in Figure 2.5, LCCC exhibits a very unique elution behavior. At the point of critical conditions, the steric interactions of the SEC mode counterbalance with attractive adsorption forces of the LAC mode. Consequently, the separation of polymers is independent of the molar mass but depends on chemical modification or functionality. LCCC can be performed by isocratic and gradient elution.

Moreover, LCCC is also known as elution at the critical point of adsorption (CPA). For separating block- copolymers consisting of two and more blocks with different chemical functionality, LCCC is extremely valuable. However, adjusting the critical conditions in the separation system can be very tedious and may result in an only slightly robust chromatographic method [28,42,43]. In general, the determination of the CPA is done by adaption of the mobile phase composition and/ or the temperature of the separation system to critical conditions. A combination of CPA and SEC is favorable: The polymer of interest is separated at the CPA while all other components elute in the SEC mode. Combining CPA with LAC is not feasible because the non-polymeric components can irreversibly adsorb to the stationary phase due to the isocratic conditions. Several research groups describe different possibilities of adjusting the critical conditions [44,45].

Figure 2.7 left side: Gradient program for finding the eluent composition for the LCCC; right side: Measurement series for determination of the critical conditions (e) of a isotactic polypropylene sample with the mobile phase 2-octanol/ 1,2-

dichlorobenzene at a Thermo Fisher Hypercarb (4.6 x 250 mm) column (both figures out of [44]).

(30)

Basics of polymer liquid chromatography Liquid chromatography at critical conditions

11

Bhati et al [44,46] described a very elegant method to determine the CPA of isotactic polypropylene with a mobile phase combination of 2-octanol and 1,2-dichlorobenzene using a Thermo Fisher Hypercarb column (see Figure 2.7). Therefore, a high molar mass homopolymer was injected into different isocratic mobile phase combinations, until the complete sample amount eluted in one peak (compare Figure 2.7).

At these conditions LCCC took place and could be used for separation of real samples. In [47] an overview of various polymers separated by LCCC is given. Some further examples for LCCC of linear and cyclic PDMS are given in [48], for PS and PDMS block copolymers in [49], for PS and poly(ethylene oxide) block copolymers in [50], and for the separation of diverse poly(ethylene glycols) in [51]. Comparing isocratic and gradient CPA, gradient CPA is advantageous because it is a more robust method, the risk of irreversible polymer adsorption is minimized, and the separation does not depend on the column pore size.

Nevertheless, LCCC has some limitations, i.e. the lack of sample recovery, high susceptibility to variations of surrounding conditions or disturbance through polymer sample changes [2,28]. In the following, two special separation techniques using the advantages of LCCC are explained.

2.4.1 Barrier techniques

The application of solvent barriers exploiting the transition between two modes of polymer liquid chromatography, enables an isocratic separation according to LCCC. Berek et al [28,52–54] essentially differentiate between liquid chromatography at limiting conditions of adsorption (LC-LCA) and liquid chromatography at limiting conditions of desorption (LC-LCD). In LC-LCA, the mobile phase is composed of a solvent mixture slightly below the CPA (of the polymer) and the composition of the solvent barrier is slightly above the CPA. The injection of the polymer occurs within the solvent barrier. Thus, at the initial solvent composition within the solvent barrier SEC mode enables the polymer to pass the solvent barrier.

As soon as critical conditions for the analyte polymer appear, elution in LCCC mode take place and a

separation from other sample components is possible. In the second barrier mode LC-LCD, the initial

mobile phase composition corresponds to SEC conditions (where the polymer is completely dissolved

without the possibility of chemical interactions to the stationary phase) and the barrier composition

corresponds to the LCA mode. The polymer injection in the initial mobile phase results in a SEC mechanism

at the beginning as long as the macromolecules reach the solvent barrier. At the border area LCCC

separates the macromolecules which reach the CPA from the polymer mixture. The complex arrangement

of various solvent barriers limits the application of the barrier techniques and causes reproducibility

issues [28].

(31)

Basics of polymer liquid chromatography Liquid chromatography at critical conditions

12 2.4.2 Gradient SEC

Radke et al [54,55] introduced with gradient SEC a further alternative applying mixed polymer liquid chromatography. This approach is based on the previously described barrier techniques. Thus, the dissolved polymer sample is injected on a SEC column in a solvent composition providing LAC for all components. After the injection a solvent gradient towards SEC conditions is started. For each sample compound a suitable CPA is reached in between the transition from LAC to SEC solvent. More or less this separation technique provides an infinite number of solvent barriers for polymer separation. Compared to the barrier techniques an increased reproducibility and an increased system robustness are gained.

Nevertheless, this approach is prone to system fluctuations and the small differences of the solvent

gradient limits the application to complex real polymer samples. Furthermore, a combination of several

SEC columns is necessary and extends the total runtime [28].

(32)

Basics of polymer liquid chromatography Polymer HPLC

13

2.5 Polymer HPLC

In comparison to a separation according to only one polymer distribution, like molar mass in SEC or chemical functionality in LCCC, polymer HPLC offers various interaction parameters between polymer and mobile/ stationary phase. Therefore, polymer HPLC is often termed as interactive chromatography [27]

or interaction polymer (liquid) chromatography [28]. In this study, polymer HPLC is used as name and includes all types of LC shown in Table 2.1, except SEC. Liquid adsorption chromatography or gradient polymer elution chromatography (GPEC) are the most common types in polymer HPLC. In addition, precipitation- / re-dissolution chromatography (PLC) or temperature gradient interaction chromatography (TGIC) can also be used as separation techniques. A detailed discussion of LAC and PLC will be given in the subsequent chapters, but as previously discussed, a clear differentiation between both LC types is often sophisticated in practical application.

Table 2.1: Different types of polymer HPLC compared to SEC, for more detailed information see [5] and [28].

Type of Liquid chromatography

Separation according to…

Information about molar mass distribution

Information about chemical composition

SEC

… hydrodynamic volume or rather molar

mass ✓ 

LAC, GPEC

… adsorption and partition interactions between polymer and stationary/ mobile phases

✓ ✓

LCCC,

Gradient elution at the CPA

… chemical

composition at critical conditions (molar mass invisibility)

 ✓

PLC … different solubilities

of the macromolecules ✓ ✓

TGIC

… changing system parameters through

temperature gradients ✓ ✓

Before any polymer HPLC techniques can be applied, dissolving the polymer sample is an important

aspect. Thus, the choice of appropriate solvents for the corresponding polymer is crucial for introducing

the complete polymer sample into the chromatographic system. Biopolymers or poly(ethylene glycols)

are water soluble, but for PMMA, PVC, PDMS or PS stronger organic solvents as tetrahydrofuran (THF) are

necessary to completely dissolve the polymer. In some cases, even elevated temperatures or very strong

solvents like concentrated acids or protogenic alcohols (e.g. hexafluor-2-propanol) must be applied in

(33)

Basics of polymer liquid chromatography Polymer HPLC

14

order to dissolve for example polyamides [3,5,56,57]. Moreover, especially polymers of high molecular masses require prolonged dissolution times before a representative sample injection becomes possible [58].

In contrast to SEC, the elution mechanisms in ideal polymer HPLC separate the polymer components according to molar mass and chemical functionality, unaffected by pore size effects or hydrodynamic volume. Furthermore, unlike in SEC, the column dead time or solvent peak marks the starting point of the separation and much more than one column volume is crucial for an appropriate separation. Therefore, the analytes show a different elution order, from low to high molar mass compounds and different chemical functionalities or structures (Figure 2.8). In addition, different stationary phases with smaller column lengths and chemical modified silica particles are typically used. As in HPLC of small molecules, analytical columns are used with lengths between 50 and 250 mm and diameters between 2 and 5 mm.

Moreover, the same chemical functionalized stationary phases are used in polymer HPLC [27,59–69].

Figure 2.8: Polymer-HPLC retention mechanism in relation to a chromatogram, the first peak is the dead time or solvent peak, afterwards macromolecules are separated according to molar mass and chemical functionality, whereby for homopolymers an

increasing retention time corresponds to an increasing molar mass.

Comparing isocratic and gradient elution techniques, in polymer HPLC gradients are preferred

accelerating the measurement and improving the separation by minimizing band broadening effects

[5,28,70,71]. Consequently, in the following section a typical gradient elution is summarized and

discussed.

(34)

Basics of polymer liquid chromatography Polymer HPLC

15

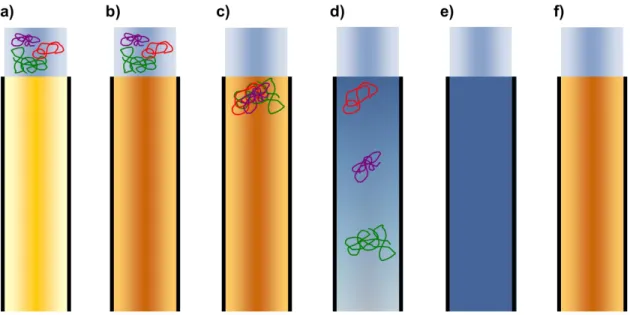
Based on the sample solvents, injection and gradient elution in polymer HPLC (GPEC) follow a different routine compared to HPLC of small molecules. Figure 2.9 depicts a schematic overview of the major steps in GPEC: Before any sample is introduced on the stationary phase (a) a suitable non-solvent or rather weak solvent, in the following referred to as adsorption promoting solvent, is used for conditioning the column (b). In this surrounding, the injected polymer sample precipitates or is strongly adsorbed on top of the column (c) and the solvent plug originally dissolving the polymer is flushed through the system.

Then, a gradient with a second stronger polymer solvent, the desorption promoting solvent, is started to separate the different polymer components (d). After the separation the column is thoroughly flushed with a strong solvent (e) in order to remove remaining polymer components and in a last step the column is re-conditioned to the initial conditions (f) [72–74].

Figure 2.9: Schematic overview of the major steps in GPEC: a) dissolved polymer sample and unconditioned stationary phase;

b) conditioning of stationary phase with weak or non-solvent (adsorption promoting solvent) concerning the investigated polymers; c) injection of the sample on the column – precipitation thereof on top of the column; d) gradient elution through programmed increase of a strong solvent for the polymer (desorption promoting solvent); e) flushing of the column with 100 %

desorption promoting solvent; f) re-conditioning of the stationary phase to initial conditions (b).

Similar to the above-mentioned stationary phases, classical HPLC detectors as diode array detectors (DAD)

or fluorescence detectors (FLD) [75,76] are used in polymer HPLC, if the polymer contains chromophoric

or fluorescent groups. Furthermore, for isocratic elution, RI detectors may also be used for polymer

detection. If neither chromophore groups are present, nor isocratic elution is possible, further much more

universal detection principles are inevitable [35]. Applying an Evaporative Light Scattering Detector (ELSD)

to polymer analysis allows the use of a gradient protocol and the detection of macromolecules without

any functional groups [77–80]. A detailed review of the operation principles and detector optimization is

(35)

Basics of polymer liquid chromatography Polymer HPLC

16

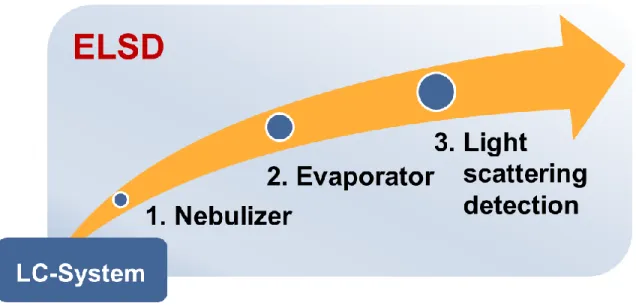
given in chapter 5, and, thus only basic principles are discussed in this section. For an adequate light scattering detection, at first the LC effluent is nebulized and in a subsequent step the mobile phase is evaporated (Figure 2.10). These steps are decisive for the sensitivity and robustness of the whole detection process. Since its invention by Charlesworth [81], the ELSD was optimized to overcome the problems in the detection process and a broad variety of devices were developed by several manufacturers [77]. But nevertheless, some limitations applying ELS detection still remains, for example volatile, vaporable compounds are evaporated with the mobile phase and thus, cannot be detected or clog the concentric nebulizer. A major drawback of the ELSD is its non-linear response which can be approximated by a quadratic calibration curve or more precisely by log-log-transformation of a power function calibration but makes data evaluation tedious. Apart from this, the used mobile phase must be completely volatile within the instrumental settings of the ELSD [78].

Figure 2.10: Detection principle of an ELSD, based on three crucial steps – nebulization, evaporation, light scattering detection.

Adapted from principles of ELSD, a Charged Aerosol Detector (CAD) was invented using a corona discharge

needle for transferring charge on dried aerosol particles (Figure 2.11). Nitrogen ions are generated by a

N

2

gas flow at the corona needle. Afterwards, the nitrogen ions collide with the dried analyte particles in

a mixing chamber and a charge transfer to the analyte particle occurs [78,82,83]. Finally, the charged

analyte ions hit a perforated plate and are counted by an electrometer measuring the resulting current

flow as signal. Compared to ELSD, CAD showed an increased sensitivity and therefore an improved

detection limit. However, CAD is more affected by polymer matrix effects and interferences by

inappropriate mobile phases, e.g. high amounts of semi- or non-volatile buffer [78]. A further

development of the ELSD setup is the condensation nucleation light scattering detector (CNLSD) applying

(36)

Basics of polymer liquid chromatography Polymer HPLC

17

dried aerosol particles as nucleation sites for liquid condensation. In this process, the aerosol particle size can increase from several nanometers up to 10 µm and, thus, allow a more sensitive light scattering measurement. The major constraints of this detector type are the limited commercial availability of the device and the lack of software drivers for chromatography data systems [78,79].

Figure 2.11: Overview of the main functional aspects of a CAD.

Aside from these particle detectors, mass spectrometry can also be applied for detecting synthetic macromolecules. Several applications for polymer LC-MS detections are published in [84,85], but unfortunately uncharged polymers can only be analyzed up to molar masses of 4,000 g∙mol

-1

. Another possibility is matrix assisted laser desorption ionization (MALDI)- MS. One major constraint thereof is the limited possibility in direct coupling to heart cut HPLC because the elution volume of a single peak is normally much larger than the volume which can be directly pipetted on a MALDI target. However, MALDI- MS allows oligomer resolved polymer detection up to a m/ z- ratio of 30,000 [86–88].

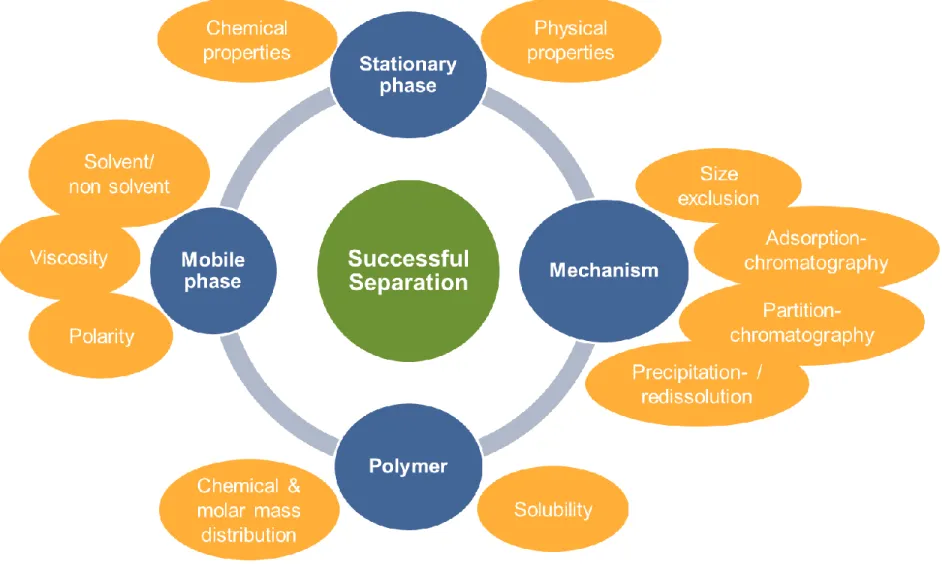
Summarizing, Figure 2.12 shows the most important influencing factors on a successful separation of

macromolecules with polymer HPLC. The interaction of mobile phase, stationary phase, and the specific

polymer determine the prevailing separation mechanism. For this reason, in the following sections the

three main operation modes of polymer HPLC are presented: LAC and PLC are compared with each other

and a short overview about gradient temperature interaction chromatography (TGIC) is given which can

be an interesting alternative to common LC techniques.

(37)

Figure 2.12: Overview of influence influencing factors for a successful separation in polymer HPLC.

.

(38)

Basics of polymer liquid chromatography Polymer HPLC

19 2.5.1 Liquid adsorption chromatography

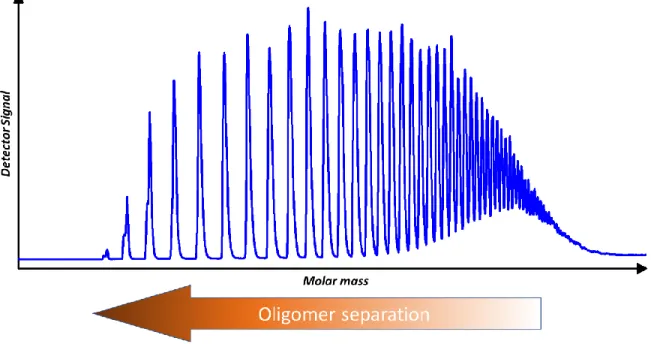
Most of the applications of LAC are performed by gradient elution, because when applying isocratic separation mode, the polymer can irreversibly be adsorbed to the stationary phase. Consequently, LAC is usually performed with mobile phases containing at least two different solvents: an adsorption promoting solvent which is itself a weak or even non-solvent for the polymer and a desorption promoting solvent dissolving the complete polymer sample. In general, with increasing retention time, the molar mass of the oligomers or rather the polymers increase. Particularly for low molecular weight macromolecules, a separation of single oligomers can be achieved by appropriately adjusting of mobile and stationary phases while polymers with increasing molar mass are more or less unresolved or results in broad peaks (Figure 2.13). Varying the gradient slope enables the adjustment of the adsorption area to the separation problem. Depending on the CPA, gradient LAC can be performed up to 10 kDa, 100 kDa or 1 MDa. Hence, in contrast to LCCC, reaching the CPA should be avoided for improving the separation [4,5,28].

Figure 2.13: Degree of oligomer separation in LAC in relation to molar mass.

Compared to HPLC of small molecules, several differences, i.e. small diffusion coefficients of dissolved

polymers and nearly the same dimensions of the polymers to the pore sizes of the stationary phase,

completely change the chromatographic process resulting in different retention characteristics for

macromolecules. Moreover, as long as at least one repetition unit of the polymer backbone is adsorbed

to the column the entire polymer is adsorbed. Compared to typical biomolecules in HPLC of small

molecules, the polymer solubility is considerably increased and therefore secondary interactions as well

(39)

Basics of polymer liquid chromatography Polymer HPLC

20

as peak broadening effects through delayed desorption occur [2,3]. Moreover, in LAC the impact of the stationary phase on the separation is significant: Changing the column has an effect on the retention of the polymer. In general, various separation mechanisms (cf. Figure 2.12) superimpose each other in real chromatographic systems. Therefore, one further very important mechanism is discussed in the subsequent section.

2.5.2 Precipitation-/ re-dissolution chromatography

The influence of precipitation-/ re-dissolution effects on the separation of polymers was introduced as high performance precipitation liquid chromatography (HPPLC) and applied by Glöckner et al [3,89–95].

As generally described for the injection in GPEC (Figure 2.9), in HPPLC or precipitation-/ re-dissolution chromatography (PLC) the polymer precipitates on top of the column. In contrast to LAC, the gradient elution is driven by sequential precipitation and re-dissolution of different polymer components while increasing the content of the stronger solvent for the polymer. The whole process is exclusively driven by solubility effects of the macromolecules (”similia similibus solvuntur”) with changing mobile phase compositions. Staal [72] described the relation between polymer cloud points and the critical elution conditions for the macromolecular sample compounds by reversed phase liquid chromatography.

Therefore, the elution order is the same as in LAC: The molar mass increases with increasing retention

times. Furthermore, depending on the solubility of the polymer in the appropriate composition of the

mobile phase, polymer retention times are independent of the stationary phase [28,72]. As a result

thereof, elution at the CAP is impossible in LPC and cannot restrict the separation in the high molecular

range [28]. A detailed discussion by German et al [96–98] shows the difficulty in differentiating between

LAC and PLC in real chromatography systems. Therefore, they analyzed polyester resins with various

stationary phases and showed that, except for crystalline polyester, adsorption chromatography is the

dominating effect on separation. Concluding, a true precipitation-/ re-dissolution mechanism occurs

rarely in real chromatographic systems [98]. Consequently, polymer HPLC is often operated by a

combination of PLC and LAC, while sorption effects predominate in most cases.

(40)

Basics of polymer liquid chromatography Polymer HPLC

21

2.5.3 Temperature gradient interaction chromatography

A further alternative of polymer HPLC method is called TGIC and was introduced by Chang et al [99,100]

by applying a temperature gradient. They separated a mixture of 10 PS standards over a molar mass range

from 1,700 to 2,890,000 g∙mol

-1

with a temperature gradient from 0 to 44 °C. Hence, they used a water

bath circulator for temperature programming of the column. Moreover, the application to other polymers

like PMMA was demonstrated in [101] by a temperature gradient from 10 to 60 °C. With this particular

technique, copolymer mixtures or polymers exclusively differing in their molecular architecture are

separated [102–104]. The applicability to star shaped or branched PS [105–108] was also demonstrated

and even coupling to MALDI mass spectrometry was reported [109–111]. Hutchings [107] reviewed the

application of TGIC to byproduct analysis of polymer reactions and summarized miscellaneous examples

of the capability of TGIC for microstructure analysis in comparison to SEC. Furthermore, temperature

programming can be used to skip between the three main LC modes, LAC, LCCC, and SEC without changing

other system parameters [112]. Therefore, TGIC represents an additional powerful alternative in polymer

HPLC analysis [28,35]. However, one major drawback is the need to use additional equipment for accurate

temperature control and suitable hard- and software implementation.

(41)

Basics of polymer liquid chromatography References

22

2.6 References

[1] H. Pasch, B. Trathnigg, HPLC of polymers, Springer, Berlin, 1998.

[2] H. Pasch, B. Trathnigg, Multidimensional HPLC of polymers, Springer, Berlin, 2013.

[3] G. Glöckner, Polymercharakterisierung durch Flüssigkeits-Chromatographie: Chromatographische Methoden, Hüthig, Heidelberg, 1982.

[4] G. Glöckner, Polymer characterization by liquid chromatography: Chromatographische Methoden, Elsevier, Amsterdam [u.a.], 1987.

[5] E. Uliyanchenko, S. van der Wal, P.J. Schoenmakers, Challenges in polymer analysis by liquid chromatography, Polym. Chem. 3 (9) (2012) 2313. https://doi.org/10.1039/c2py20274c.

[6] E.G. Rochow, An Introduction to the Chemistry of Silicones, Nabu Press, 1947.

[7] A. Tiwari, M.D. Soucek (Eds.), Concise encyclopedia of high performance silicones, John Wiley and Sons; Scrivener Publishing, Hoboken, New Jersey, Massachusetts, 2014.

[8] A.M. Muzafarov, A. Bockholt (Eds.), Silicon Polymers, Springer, Berlin, 2011.

[9] Y. Liu (Ed.), Silicone dispersions, CRC Press, Boca Raton FL, New York, 2017.

[10] Koerner G., M. Schulze, Weis J., Silicone: Chemie und Technologie ; Symposium am 28. April 1989, Vulkan-Verl., Essen, 1989.

[11] W. Noll, Chemie und Technologie der Silicone, 2nd ed., Verlag Chemie GmbH, Weinheim, 1968.

[12] B. Pachaly, F. Achenbach, C. Herzig, K. Mautner, Silicone, in: Winnacker, Küchler (Eds.), Chemische Technik: Prozesse und Produkte: Organische Zwischenverbindungen, Polymere, 5th ed., Wiley-VCH, Weinheim, 2005.

[13] S.J. Clarson, J.A. Semlyen, Siloxane polymers, Prentice Hall, Englewood Cliffs, NJ, 1993.

[14] N. Auner, J. Weis (Eds.), Organosilicon Chemistry I: From Molecules to Materials, Wiley, Weinheim, 2011.

[15] N. Auner, J. Weis (Eds.), Organosilicon chemistry II: From Molecules to Materials, Wiley-VCH, Weinheim Federal Republic of Germany, New York, 1996.

[16] N. Auner, J. Weis (Eds.), Organosilicon chemistry IV: From Molecules to Materials, Wiley-VCH, Weinheim, New York, 2000.

[17] N. Auner, J. Weis (Eds.), Organosilicon chemistry V: From Molecules to Materials, Wiley-VCH, Weinheim, 2003.

[18] N. Auner, J. Weis (Eds.), Organosilicon chemistry VI: From Molecules to Materials, Wiley-VCH,

Weinheim, 2005.

Abbildung

Figure 1.1: Development of an analytical method within and in context to the analytical process
Figure 2.1: Example for typical polymer heterogeneities: a) molar mass distribution, b) chemical composition distribution,  c) molecular architecture differences, and d) chemical functionality distribution
Figure 2.2: Chemical structure of poly(siloxanes) in between inorganic and organic chemistry, R = organic group
Figure 2.4: Overview of additionally investigated homopolymers, a) PMMA, b) PPG, c) PS, and d) PVC
+7

Referenzen

ÄHNLICHE DOKUMENTE

DOC dissolved organic carbon (gelöster organischer Kohlenstoff) DON dissolved organic nitrogen (gelöster organischer Stickstoff) DOM dissolved organic matter

scholaris, as well as the fractions of the ethanol- ic extract of the leaves (viz., n-hexane, chloroform, ethyl acetate, n-butanol, and remaining water), were tested in vivo

Figure 45: Newtonian and non-Newtonian field recovery factor for different polymer concentration The discrepancy in recovery factor values shown in Figure 45 emphasis

Since in application in CLD laminates damping is provided via shear defor- mation of the adhesive damping layer when the structure is bent, a DMA setup in shear mode was used

To sum up, the suggested process control for polymeric flocculant addition is based on two parameters: the Residual Flocculant Parameter (RFP), which controls possible toxic effects,

The analytical model which uses the fast queuing simulation trace results is able to produce final results of the impact of transport flow control and congestion control on

Furthermore, in gradient elution separations of a simple pharmaceutical drug mixture, for example, a peak width decrease of ~15% and a resolution increase of up to 33% were

Figure 6.3: (A) Diffraction micrograph collected at 33.3 cm camera length, (B) Structure factor, (C) the corresponding radial distribution function for liquid water. Please