doi: 10.3389/fbioe.2020.615520
Edited by:
Georg A. Feichtinger, University of Leeds, United Kingdom Reviewed by:
Nicola Baldini, University of Bologna, Italy Sabine Wenisch, University of Giessen, Germany
*Correspondence:
Susanne Grässel susanne.graessel@ukr.de
†
These authors have contributed equally to this work
Specialty section:
This article was submitted to Preclinical Cell and Gene Therapy, a section of the journal Frontiers in Bioengineering and Biotechnology
Received: 09 October 2020 Accepted: 27 November 2020 Published: 23 December 2020
Citation:
Niedermair T, Lukas C, Li S, Stöckl S, Craiovan B, Brochhausen C, Federlin M, Herrmann M and Grässel S (2020) Influence of Extracellular Vesicles Isolated From Osteoblasts of Patients With Cox-Arthrosis and/or Osteoporosis on Metabolism and Osteogenic Differentiation of BMSCs.
Front. Bioeng. Biotechnol. 8:615520.
doi: 10.3389/fbioe.2020.615520
Influence of Extracellular Vesicles Isolated From Osteoblasts of
Patients With Cox-Arthrosis and/or Osteoporosis on Metabolism and
Osteogenic Differentiation of BMSCs
Tanja Niedermair
1†, Christoph Lukas
2†, Shushan Li
2, Sabine Stöckl
2,
Benjamin Craiovan
3, Christoph Brochhausen
1, Marianne Federlin
4, Marietta Herrmann
5and Susanne Grässel
2*
1
Institute of Pathology, University of Regensburg, Regensburg, Germany,
2Department of Orthopaedic Surgery, Experimental Orthopaedics, Centre for Medical Biotechnology (ZMB/Biopark 1), University of Regensburg, Regensburg, Germany,
3Chair of Arthroplasty, Center for Orthopaedics and Trauma Surgery, University Hospital Giessen and Marburg GmbH, Marburg, Germany,
4Department of Conservative Dentistry and Periodontology, University Medical Center Regensburg, Regensburg, Germany,
5IInterdisciplinary Center for Clinical Research (IZKF), Group Tissue Regeneration in Musculoskeletal Diseases, University Hospital Wuerzburg and Bernhard-Heine-Center for Locomotion Research, University of Würzburg, Würzburg, Germany
Background: Studies with extracellular vesicles (EVs), including exosomes, isolated from mesenchymal stem cells (MSC) indicate benefits for the treatment of musculoskeletal pathologies as osteoarthritis (OA) and osteoporosis (OP). However, little is known about intercellular effects of EVs derived from pathologically altered cells that might influence the outcome by counteracting effects from “healthy” MSC derived EVs. We hypothesize, that EVs isolated from osteoblasts of patients with hip OA (coxarthrosis/CA), osteoporosis (OP), or a combination of both (CA/OP) might negatively affect metabolism and osteogenic differentiation of bone-marrow derived (B)MSCs.
Methods: Osteoblasts, isolated from bone explants of CA, OP, and CA/OP patients, were compared regarding growth, viability, and osteogenic differentiation capacity. Structural features of bone explants were analyzed via µ CT. EVs were isolated from supernatant of naïve BMSCs and CA, OP, and CA/OP osteoblasts (osteogenic culture for 35 days). BMSC cultures were stimulated with EVs and subsequently, cell metabolism, osteogenic marker gene expression, and osteogenic differentiation were analyzed.
Results: Trabecular bone structure was different between the three groups with lowest
number and highest separation in the CA/OP group. Viability and Alizarin red staining
increased over culture time in CA/OP osteoblasts whereas growth of osteoblasts was
comparable. Alizarin red staining was by trend higher in CA compared to OP osteoblasts
after 35 days and ALP activity was higher after 28 and 35 days. Stimulation of BMSC
cultures with CA, OP, and CA/OP EVs did not affect proliferation but increased caspase
3/7-activity compared to unstimulated BMSCs. BMSC viability was reduced after
stimulation with CA and CA/OP EVs compared to unstimulated BMSCs or stimulation
with OP EVs. ALP gene expression and activity were reduced in BMSCs after stimulation
with CA, OP, and CA/OP EVs. Stimulation of BMSCs with CA EVs reduced Alizarin Red
staining by trend.
Conclusion: Stimulation of BMSCs with EVs isolated from CA, OP, and CA/OP osteoblasts had mostly catabolic effects on cell metabolism and osteogenic differentiation irrespective of donor pathology and reflect the impact of tissue microenvironment on cell metabolism. These catabolic effects are important for understanding differences in effects of EVs on target tissues/cells when harnessing them as therapeutic drugs.
Keywords: extracellular vesicles, mesenchymal stem cells, osteoblasts, osteoarthritis, osteoporosis, EVs, osteogenic differentiation
INTRODUCTION
The presence of extracellular vesicles, i.e., exosomes (further referred to as EVs, according to Théry et al., 2018), was initially demonstrated in studies with normal and neoplastic cell lines as exfoliation of membranous vesicles containing 5’-nucleotidase activity (Trams et al., 1981). At first, they were regarded as waste products, but recently they were attributed with a possible therapeutic potential (Edgar, 2016).
EVs are defined as intraluminal vesicles (ILVs) that are released into the extracellular milieu by the fusion of multivesicular bodies (MVBs) with the plasma membrane (Edgar, 2016). Their size varies between 30 and 150 nm and they are packed with a specific set of molecules, consisting of RNA, DNA, and proteins. Some of these molecules can be found commonly in EVs from different parent cells, whereas other molecules reflect the cytosolic and membranous content of the cell of origin (Valadi et al., 2007; Conde-Vancells et al., 2008; Simpson et al., 2008; Mathivanan et al., 2010; Sokolova et al., 2011; Wu et al., 2015). EVs can be incorporated again by the parent cell or can transmit their content by a paracrine or endocrine way from cell to cell, thereby affecting the target cell (Ratajczak et al., 2006; Valadi et al., 2007).
Various studies have reported the participation of EVs from bone cells and chondrocytes in physiological and pathophysiological processes related to bone and cartilage.
EVs from osteoclast precursors were able to enhance osteoclast formation in vitro, whereas RANK-rich EVs from mature osteoclasts inhibited osteoclastogenesis (Huynh et al., 2016).
Pro-osteogenic EVs have been shown to trigger osteogenic differentiation of naÏve mesenchymal stem cells (MSCs) in vitro and in vivo (Narayanan et al., 2016). In another study, Sun et al. demonstrated that miR-214 enriched EVs from osteoclasts can inhibit osteoblast activity in vitro (Sun et al., 2016). Further, EVs isolated from chondrocytes promoted chondrogenesis of progenitor cells and maintained cartilage stability (Chen et al., 2018).
Another aspect is the promising therapeutic effect regarding bone and cartilage regeneration that has been proposed for mesenchymal stem cell (MSC)-derived EVs. MSC have self- renewal capacities and can be isolated from various tissue sources, making them easily accessible. In addition, they are able to differentiate into multiple cells and tissues and have immunomodulatory properties (Caplan, 1991; Phinney and Prockop, 2007). They can be cultured in a short time period and expanded to an appropriate cell number, making
them optimal for therapeutic use from the point of handling (Parekkadan and Milwid, 2010). However, adverse effects have been described in preclinical models and in clinical applications (Grässel and Lorenz, 2014). Usage of MSC derived EVs can reduce complications, e.g., graft vs. host reaction, and has several advantages as lower immunogenicity and the ability to cross biological barriers (Gowen et al., 2020). Several studies already demonstrated promising results regarding MSC-derived EVs in musculoskeletal pathologies such as osteoarthritis (OA) and osteoporosis (OP). The injection of EVs from induced pluripotent stem cell-derived MSCs or from synovial membrane- derived MSCs enhanced chondrocyte migration, proliferation, and cartilage repair in a collagenase-induced murine OA model (Zhu et al., 2017). Using the same model, Cosenza et al.
(2017) reported a chondroprotective role and reduced osteophyte formation after injection of BMSC derived EVs into the mouse knee. In a rat-based study about disuse osteoporosis, injection of human umbilical cord mesenchymal stem cell (HUCMSC) derived EVs could prevent bone loss, demonstrated by µ Ct analysis and HE staining (Yang et al., 2020).
Hence, the use of MSC-derived EVs could be beneficial for the treatment of two of the most common age-related musculoskeletal pathologies: OA and OP. OA is classified as a degenerative joint disease, affecting the whole joint with all its tissue components. Functional and structural changes occur in multiple joint tissues and result in damage and loss of cartilage and the remodeling of subchondral bone resulting in pain as the most disabling symptom for the patient (Litwic et al., 2013; Grässel and Aszodi, 2019). OP is characterized by an imbalance of bone formation and resorption, thereby affecting the integration of bone density and quality. This finally results in compromised bone strength and an increased risk for micro traumata and fragility fractures (NIH Consensus Development Panel on Osteoporosis Prevention Diagnosis Therapy, 2001).
Although the observation of coxarthrosis (CA) in combination with OP is not frequently observed, it can occur simultaneously in the same patient (Pogrund et al., 1982).
The use of MSC-derived EVs might improve and simplify
current treatment strategies of OA and OP. EVs isolated from
bone cells and chondrocytes are able to modulate physiological
and pathophysiological processes related to bone remodeling
and cartilage repair. Hence, EVs derived from pathologically
altered cells in bone and cartilage might influence the outcome of
treatments by counteracting effects from “healthy” MSC-derived
EVs. To gain a better inside into this topic, this study aims
to analyze if EVs isolated from osteoblasts of patients with hip
OA (coxarthrosis/CA), OP or a combination of both (CA/OP) affect the metabolism and osteogenic differentiation capacity of BMSCs differently.
MATERIALS AND METHODS
This study was conducted in agreement with the ethics committee (MSCs: Ethikkommission, Nr. 14-101-0189;
osteoblasts: 18-1109-101) and with patients’ written informed consent before undergoing surgery (email:
ethikkommission@klinik.uni.regensburg.de).
Isolation and Culture of Human BMSCs
Bone marrow aspirate (from femoral heads) was obtained from patients (male and female, n = 10, age 69 ± 9 years) undergoing hip replacement surgery due to coxarthrosis. Density gradient centrifugation to isolate BMSCs was used according to established protocols. Afterward, cells were expanded (passage/P 1–3) in growth medium (StemMACS MSC Expansion Medium,
#130091680, Miltenyi Biotec, Bergisch Gladbach, Germany) supplemented with 0.2% MycoZap TM Plus-PR (#VZA2022, Lonza, Basel, Switzerland) (Leyh et al., 2014; Wessely et al., 2019).
Human MSC-associated markers CD73 + , CD90 + , CD105 + , CD19 − and CD34 − were verified via flow cytometry. Cells in P1–3 were stored in liquid N 2 until further use.
For the experiments, BMSCs in P2 were thawed and seeded in growth medium until 80% confluency. Cells were harvested and seeded in growth medium in 96-well plates (triplicates; 5,000 cells/well) for BrdU, Caspase 3/7, and WST-1 assays. For Alizarin and ALP-assays, cells were cultured for 28 days in osteogenic medium in 12-well plates (duplicates; 10,000 cells/well). For gene expression analysis (RT-qPCR, duplicates), cells were cultured for 13 days in 6-well plates in osteogenic medium (30,000 cells/well).
Cells of different donors were not pooled for the experiments.
To isolate EVs, BMSCs of P3 were thawed and cultured in growth medium until 85–90% confluency. Afterward, cells were washed with PBS and cultured in collection medium (CM) for 48 h [CM: α -MEM, #M8042, Sigma-Aldrich, Steinheim, Germany, + 10% exosome depleted FCS (self-processed via ultracentrifugation, FCS depl. − uc ) (#F7524, + 1% P/S-#A5955, Sigma-Aldrich, Steinheim, Germany)]. CM was collected and stored at − 80 ◦ C for further processing, cells were passaged and the procedure was repeated until P6 (Supplementary Figure 1A).
Isolation and Culture of Human Osteoblast-Like Cells
Osteoblast-like cells were isolated from bone explants (bone disc of the femoral neck) of female patients with coxarthrosis (CA, n = 9), osteoporosis (OP, n = 9) or a combination of both (CA/OP, n = 10) undergoing hip-replacement surgery or after femoral neck-fracture (Age range of female donors: Figure 1A).
Bone was cut into small explants, washed several times with PBS and placed in T25 culture flasks in growth medium (DMEM low glucose, #31885-023, Gibco Life Technologies, Darmstadt, Germany) supplemented with 10% FCS, 1% P/S and 100 µ M
ascorbic acid-2-phosphate (#F7524; #A5955; #A8960, all Sigma- Aldrich, Steinheim, Germany). After 4–5 days, cells start to migrate out of the bone explants (E1/P0, Figure 2A; Dillon et al., 2012). Cells were cultured until confluency, harvested and stored under frozen conditions. Process was repeated with bone explants as E2; cells were stored as E2/P0 and process was repeated one time as E3 (E3/P0). Time span of outgrowth was noted in each explant culture. Cells of E1–E3/P1–3 were used for the experiments.
For the experiments, osteoblast-like cells of E1, 2, and 3 (cells from different donors were not pooled) from CA, OP, and CA/OP patients were thawed and cultured in growth medium until confluency. Time span until confluency was noted. Cells were harvested and seeded in osteogenic medium for 14, 21, 28, and 35 days. Cells were seeded in 96-well plates (5,000 cells/well, triplicates) for the WST-1-assay, in 12-well plates (20,000 cells/well, duplicates) for Alizarin Red quantification and alkaline phosphatase (ALP) assay and in 6- well plates (40,000 cells/well) for gene expression analysis (RT- PCR, duplicates).
To isolate EVs, osteoblast-like cells were thawed, expanded in growth medium until P2–3 and cultured until 80–90%
confluency. Medium was then changed to osteogenic medium [α-MEM, (#M8042, Sigma-Aldrich, Steinheim, Germany) + 10%
FCS, 1% P/S, 4 mM GlutaMAX TM -I (100 × , #35050038, Gibco, Paisley, United Kingdom), 10 µ M ascorbic acid- 2-phosphate, 10 mM β -glycerophosphate (#G9891, Sigma- Aldrich, Steinheim, Germany) and 100 nM dexamethasone (#D4902, Sigma-Aldrich, Steinheim, Germany)] in order to induce osteogenic differentiation of the cells for 35 days.
The term “osteoblasts” is used for osteoblast-like cells in osteogenic culture, to clearly distinguish between cells directly after isolation and cells in osteogenic culture. On day 26, cells were washed with PBS and cultured in osteogenic CM (osteogenic medium + 10% FCS depl. − uc ) until day 28, then CM was collected (day 28) and process was repeated until day 35. CM was stored at − 80 ◦ C for further processing (Supplementary Figure 1A).
EV-Depleted FCS
EV-depleted FCS (FCS depl. − uc ) was prepared according to Lässer et al. (2012). Undiluted FCS was centrifuged at 120,000 × g overnight (minimum 16 h) (Optima L-90 K ultracentrifuge, SW32-Ti rotor, Beckman Coulter, Brea, United States) at 4 ◦ C and EV-depleted supernatant (FCS depl. − uc ) was collected by pipetting.
Special care was taken to not disturb the pellet at the bottom of the tube (Polypropylene Centrifuge Tubes; Beckman Coulter, Brea, United States), therefore up to 1 cm liquid was left. The collected FCS depl. − uc was stored in aliquots at − 20 ◦ C. Medium for EV collection and stimulation was supplemented always with 10% FCS depl. − uc .
EV Isolation
Isolation of EVs from MSC and osteoblast CM was performed by
ultracentrifugation according to a modified protocol from Théry
et al. (2006). In brief, MSC and osteoblast CM was centrifuged at
300 × g (Sigma 3K30, Sigma Laborzentrifugen GmbH, Osterode
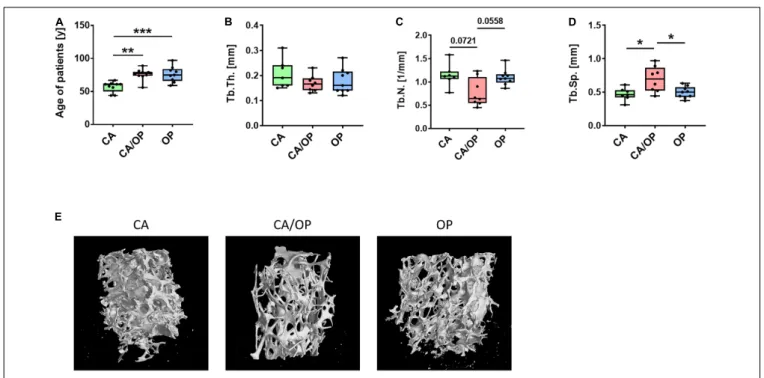
FIGURE 1 | Patient characteristics and µ CT analysis of bone biopsies obtained from CA, CA/OP, and OP patients after hip replacement surgery. (A) Age of patients with CA, CA/OP, and OP at time point of operation. N = 9 (CA), 10 (CA/OP), 9 (OP); Y = years. (B) µ CT analysis of bone explants from trabecular bone—trabecular thickness (Tb.Th.). N = 7 (CA), 8 (CA/OP), 9 (OP). (C) µCT analysis of bone explants from trabecular bone—trabecular number (Tb.N.). N = 7 (CA), 8 (CA/OP), 9 (OP). (D) µCT analysis of bone explants from trabecular bone—trabecular separation (Tb.Sp.). N = 7 (CA), 8 (CA/OP), 9 (OP). (E) Representative 3D-images of bone explants of CA, CA/OP, and OP patients after µ CT analysis. Scanning was performed with a voxel size of 12 µ m.
a. Harz, Germany) for 10 min at 4 ◦ C to remove cells. Supernatant was transferred to a new falcon tube and centrifuged at 2,000 × g for 10 min at 4 ◦ C to remove dead cells. Afterward, supernatant was transferred to a new tube and cleaned from debris (10,000 × g, 30 min, 4 ◦ C). Next, supernatant was filtered (Filtropur S plus 0.2 µ m; Sarstedt, Nümbrecht, Germany) into an ultracentrifugation tube (Polypropylene Centrifuge Tubes; Beckman Coulter, Brea, United States) and centrifuged once at 120,000 × g for 70 min at 4 ◦ C (Optima L-90 K ultracentrifuge, SW32-Ti rotor, Beckman Coulter, Brea, United States). Then, supernatant was removed carefully and the pellet was washed with PBS and centrifuged again (120,000 × g for 70 min at 4 ◦ C). PBS was discarded except for 200–300 µ l residual volume for resuspending the EV pellet. Protein concentration was measured using BCA Protein Assay Kit Pierce (Thermo Scientific, Rockford, United States).
Osteoblast-derived EV from each patient (days 28–35) were pooled before last washing steps to increase EV yield. Finally, EVs derived from naïve BMSCs and CA, OP, and CA/OP osteoblasts were stored until usage in aliquots at − 80 ◦ C (Supplementary Figure 1B).
Western Blot Analysis of EV Markers CD9 and CD81
1 × 10 6 BMSCs were lysed by ultrasound treatment in 150 µ l heat-hot lysis buffer (10 mM TRIS-HCl, Carl Roth, Karlsruhe, Germany; 1%SDS, Carl Roth, Karlsruhe, Germany).
Protein concentration was determined using BCA-assay (#23227, Thermo Scientific, Rockford, United States). Five microgram
of BMSC lysate (lane 2), 8.2 µ g (lanes 3–6) of purified EVs and 10 µ l of undiluted FCS depl. − uc (lane 7) were separated by SDS-PAGE. Then, proteins were blotted onto a PVDF membrane (0.2 µ m; Roche, Mannheim, Germany), stained with Ponceau red solution (#09189-1L-F, Sigma-Aldrich, Steinheim, Germany, see Supplementary Figure 3), blocked with 5%
BSA (Carl Roth, Karlsruhe, Germany) in 0.1% Tween Tris Buffered Saline (T-TBS) and consecutively incubated with the following primary antibodies in 5%BSA/T-TBS overnight at 4 ◦ C: mouse monoclonal anti-CD9 (Ts9, #10626D) and mouse monoclonal anti-CD81 (M38, #10630D) (all 1:1,000;
Thermo Fisher Scientific, Rockford, United States). After three washing steps, 10 min each, membranes were incubated with horseradish peroxidase coupled secondary antibody (1:20,000;
Jackson Immuno Research, West Grove, United States) for 1 h at room temperature (RT). Proteins were visualized using SuperSignal West Femto Maximum Sensitivity Substrate (#34095; Thermo Fisher Scientific, Rockford, United States) according to manufacturers’ protocol. Images were prepared using Photoshop 7.0 (Adobe).
EV Staining With PKH-26
EVs and PBS (control) aliquots were stained with the PKH26
Red Fluorescent Cell Linker Mini Kit for General Cell Membrane
Labeling (#PKH26GL-1KT, Sigma-Aldrich, Steinheim, Germany)
according to a slightly modified manufacturer’s protocol. PBS
was used to control for false positive signals (Wallace et al.,
2008; Lai et al., 2015). Diluent C was added to EVs and PBS
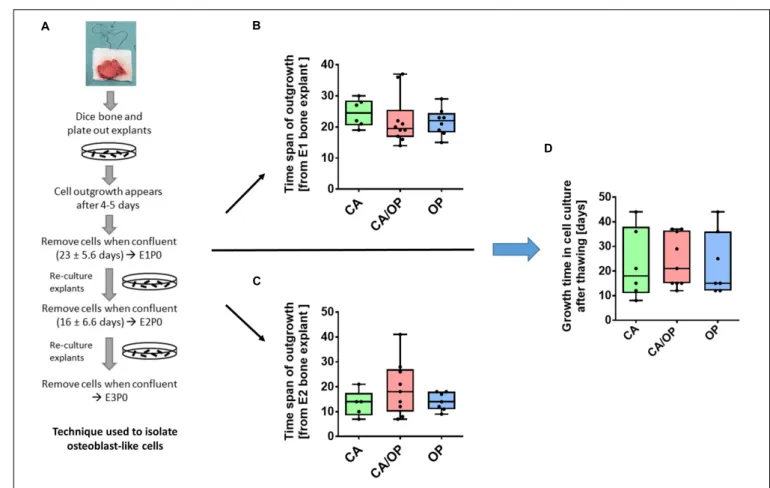
FIGURE 2 | Isolation of osteoblast-like cells from bone explants of patients with CA, CA/OP, and OP. (A) Isolation process demonstrating cell outgrowth of osteoblast-like cells expressing osteoblastic characteristics from bone explants in two consecutive phases of explant (E)1, E2, and E3 cultures. Cells were either frozen immediately in passage 0 (P0) or frozen after additional passaging of the cells until P3 (modified from Dillon et al., 2012). (B) Time span of outgrowth of cells from E1 bone explants until confluency. N = 6–10. (C) Time span of outgrowth of cells from E2 bone explants until confluency. N = 5–9. (D) Growth time of cells in cell culture from time point of seeding the cells after thawing until confluency. N = 6–9.
up to 1 ml volume. Then, 6 µ l PKH-26 staining solution was added, mixed, and incubated for 5 min at RT. To stop the dyeing process, 2 ml of 5% BSA in PBS were added, solutions were transferred to ultracentrifugation tubes, filled up with PBS and centrifuged at 120,000 × g for 70 min at 4 ◦ C. The supernatant was discharged, the pellet was resuspended in PBS and stored on ice.
BMSCs were expanded as described (see section “Isolation and Culture of Human BMSCs”), seeded on chamber slides (Corning, Big Flats, United States, 10,000 cells/chamber) and cultured in growth medium for 48 h. Cells were washed with PBS and growth medium with FCS depl. − uc and the pre-stained EVs or PBS were added for 24 h. Nuclei were counterstained with DAPI (Molecular Probes, Eugene, United States) and staining was analyzed using a fluorescence microscope (Eclipse TE2000-U;
Nikon, Tokyo, Japan).
Transmission Electron Microscopy (TEM) Analysis of EVs
Freshly isolated naïve BMSC EVs were resuspended in cold PBS. For negative staining, 20 µ l were added on a parafilm and a formvar (polyvinyl formal)-carbon coated 400 copper mesh grid (#G400-CU; Science Services, Munich, Germany)
was placed on top of the fluid for 10 min at RT. The grid was incubated with 2% phosphotungstic acid (#19500; Science Services, Munich, Germany) for 1 min and dried at RT for 10 min.
EVs were investigated with an acceleration voltage of 100 kV and 100,000 × magnification using a Leo 912 AB (Carl Zeiss, Oberkochen, Germany).
Scanning Electron Microscopy (SEM) Analysis of EVs
EVs from naïve BMSCs were dehydrated through a graded series of alcohol (1 ml of 30, 50, 70, 80, 90, and 96%) with centrifugation of 2 × 10 min between each washing step. EVs were washed with absolute EtOH, centrifuged at 60,000 × g for 10 min and supernatant was discharged. The pellet was resuspended in 50 µ l absolute EtOH and incubated for 2 h on a 13 mm tissue culture coverslip (#83.1840.002; Sarstedt, Nümbrecht, Germany). Then, 200 µ l absolute EtOH was added and the sample was processed in a critical point dryer and sputtered with platinum. Imaging was performed with an acceleration voltage of 3 kV, spot size of 2, 5–
6 mm working distance and an aperture of 30 µ m using a FEI
Quanta 400 FEG (FEI, Frankfurt a. Main, Germany).
Stimulation of BMSCs With EVs
For BrdU, Caspase 3/7-activity, and WST-1 assay, BMSCs were stimulated with 10 µ g/ml of naïve BMSC, CA, OP, or CA/OP EVs in growth medium. For BrdU and Caspase 3/7-activity assays, cells were cultured for 2 days and subsequently stimulated for 24 h. For the WST-1 assay, cells were cultured 2 days and stimulated for 48 h. For Alizarin Red-, ALP-, and RT- qPCR analysis, BMSCs were stimulated with 10 µ g/ml of naïve BMSC, CA, OP, or CA/OP EVs in osteogenic medium. For RT- qPCR analysis, cells were cultured for 13 days, then stimulated for 24 h, and for Alizarin Red- and ALP-analysis, cells were cultured for a total of 21 days. EVs were added during the last 7 days with every medium exchange (3 times). PBS was used for unstimulated BMSC cultures as control (Ø, no EVs) (Supplementary Figure 2).
BrdU Proliferation Assay
To analyze cell proliferation, BMSCs were cultured in 96-well plates for 2 days. Then, cells were stimulated with EVs for 24 h, simultaneously BrdU reagent was added. Cell proliferation ELISA (colorimetric BrdU, Roche, Mannheim, Germany) was further conducted according to manufacturer’s protocol. Results were calculated as percentage of No EV-controls.
Caspase-3/7 Assay
BMSCs were cultured for 2 days, followed by EV stimulation for 24 h. Afterward, Caspase 3/7-activity was determined as an indicator for apoptosis using the Apo-ONE
RHomogeneous Caspase-3/7 assay (Promega, Madison, United States) according to manufacturer’s specifications. Results were calculated as percentage of No EV-controls.
Viability Assay (WST-1 Assay)
For comparison of CA, OP, and CA/OP osteoblasts, cells were cultured for 14, 21, 28, and 35 days. For experiments, BMSCs were cultured for 2 days, then, cells were stimulated with EVs for additional 48 h. At respective time points, WST-1 reagent was added (Roche, Mannheim, Germany; 10 µ l/well) and absorbance was measured after 30 min (BMSC cultures) or 1 h (osteoblast cultures). For BMSC cultures, results were calculated as percentage of No EV-control.
RNA Isolation and Real-Time PCR (RT-PCR)
RNA from BMSCs was isolated after 14 days in osteogenic medium and stimulation with EVs for the last 24 h of culture time. RNA from osteoblasts of CA, OP, and CA/OP patients was isolated after 28 and 35 days in osteogenic medium to analyze gene expression profile at time points of EV collection.
Cells were cultured in 6-well plates and lysed at respective time points with 100 µ l of β -mercaptoethanol containing lysis buffer.
RNA was further isolated using Absolutely RNA Microprep Kit (Agilent Technologies, Cedar Creek, United States) according to manufacturer’s instructions, including DNAse treatment, with minor modifications during RNA elution steps (3 min
incubation of elution buffer and 5 min centrifugation). RNA- concentration was quantified (NanoDrop 2000; Peqlab, Erlangen, Germany) and cDNA was prepared using AffinityScript QPCR cDNA Synthesis Kit (Agilent Technologies, Cedar Creek, United States) as recommended by manufacturer’s protocol.
PCR was performed in duplicates using the Brilliant III Ultra-Fast SYBR Green QPCR Master Mix with an Agilent PCR-System (Agilent Technologies, Cedar Creek, United States).
The following primers were used (5’–3’): GAPDH (house keeper): fwd, CTGACTTCAACAGCGACACC, rev, CCCTG TTGCTGTAGCCAAAT; ALP: fwd, CCTCCTCGGAAGACA CTCTG, rev, AGACTGCGCCTGGTAGTTGT; BGLAP: fwd, GTGCAGAGTCCAGCAAAGGT, rev, TCAGCCAACTCGTC ACAGTC; COL1A1: fwd, ACGTCCTGGTGAAGTTGGTC, rev, ACCAGGGAAGCCTCTCTCTC; Runx2: fwd, CGGAATG CCTCTGCTGTTATG, rev, GCTTCTGTCTGTGCCTTCTG.
Results of osteoblast cultures were calculated by the 1 CT method in relation to GAPDH expression. Results of BMSC cultures were further calculated as x-fold change to calibrator (= 11Ct method; calibrator = No EV-control).
ALP Enzyme Activity
Intracellular ALP enzyme activity was analyzed as described previously (Niedermair et al., 2018, 2020). Briefly, osteoblasts were seeded in 12-well plates and cultured in osteogenic medium for 14, 21, 28, and 35 days. BMSCs were seeded likewise and cultured for 28 days in osteogenic medium. BMSCs were stimulated with EVs from days 21 to 28 (3 × EV supplemented medium exchange). QuantiChrom Alkaline Phosphatase Assay Kit (BioAssay Systems, Hayward, United States) was used according to manufacturer’s manual to quantify intracellular ALP enzyme activity. Results were calculated as µ mol/l ∗ min, results for BMSC cultures were further calculated as percentage of “No EV-control.”
Alizarin Red Staining and Photometric Analysis
Calcium deposition was measured by Alizarin Red staining and subsequent quantification. Osteoblasts were cultured for 14, 21, 28, and 35 days in 12-well plates in osteogenic medium. BMSCs were cultured likewise for 28 days and stimulated from days 21 to 28 with EVs (3 × EV supplemented medium exchange).
At specific time points, cells were washed with PBS and fixed with 1% glutaraldehyde for 15 min at RT. After a washing step with PBS (pH = 4.2), cells were incubated for 20 min at 37 ◦ C with Alizarin-S staining solution (1%, #0348.3, Carl Roth, Karlsruhe, Germany). Cells were washed again 2 × with PBS and photometric quantification of Alizarin Red staining was performed according to a protocol by Gregory et al. (2004).
Briefly, PBS was discharged, cells and matrix were detached with 200 µ l of 10% acetic acid for 30 min and transferred to a new cup using a cell scraper. Cups were vortexed, incubated at 85 ◦ C for 10 min, cooled on ice for 5 min and centrifuged at 20,000 × g for 15 min at 4 ◦ C. Supernatant was transferred and pH was adjusted to 4.4–4.5. A buffer of 8 parts 10% acetic acid and 3 parts 10%
ammonium hydroxide was prepared for the standard curve (2,
1, 0.5, 0.25, 0.125, 0.0625, and 0.0312 mM). Fifty microliter of sample and standard were measured in a 96-well plate at 405 nm.
Results were calculated as mM Alizarin Red. For BMSC cultures, results were further calculated as percentage of No EV-control.
µ CT Analysis of Bone Samples
Trabecular bone samples (length/width/height about 0.5–0.7 cm) were cut out directly from the bone pieces after receiving the samples and stored frozen at − 80 ◦ C until µ CT analysis. Samples were scanned in a micro-computed tomography system with a voxel size of 12 µ m (Röntgenprüfsystem v| tome| x s 240 Research/Edition V2.5, GE Sensing and Inspection Technologies GmbH, Wunstorf, Germany, DFG number: INST 102/11-1 FUGG). Following parameters were used for scanning: X-ray tube was operated at 45 kV and 260 µ A; integration time of 333 ms and 1,500 images/360 ◦ . Automatic geometry calibration without using further filters was used for reconstruction of the data. Bone microarchitecture was analyzed with the Bruker CtAN Software (Bruker Corporation, Billerica, MA, United States).
Statistical Analysis
GraphPad Prism 8 (GraphPad, San Diego, United States) was used for statistical analysis and graph preparation. Data in box plots are expressed as median + min/max. Differences between the groups were analyzed using two-tailed Mann-Whitney U-test and Wilcoxon signed-rank test was applied when No EV-control was set to 100%. P < 0.05 were considered as significant.
RESULTS
Patients Characteristics and µ CT
Analysis of Bone Explants From CA, OP, and CA/OP Patients
Mean age of CA patients (57.11 ± 8.0 years) was significantly lower compared to mean age of CA/OP (76.10 ± 8.4 years) and OP (76.11 ± 11.7 years) patients (Figure 1A). µCT analysis was performed with trabecular bone samples of a disc, cut out from the femoral neck during hip replacement surgery.
No difference in trabecular thickness (Tb.Th.; Figure 1B) was detected, but trabecular number (Tb.N.; Figure 1C) was lower by trend and trabecular separation (Tb.Sp.; Figure 1D) was higher in bone samples of CA/OP compared to CA and OP patients.
Representative µ CT images of bone explants of all groups are shown under Figure 1E.
Growth Characteristics of Osteoblasts Isolated From CA, OP, and CA/OP Patients
Osteoblast-like cells were obtained from patient bone explants during in vitro explant cultures E1, E2, and E3. Processing of bone explant cultures as described by Dillon et al. (2012) is schematically presented in Figure 2A. No difference was observed regarding time span of cell outgrowth from bone explants until confluency between CA, CA/OP, and OP osteoblast-like cells in E1 or E2 explant cultures (Figures 2B,C).
In addition, growth time until confluency in culture after thawing was comparable in all groups (Figure 2D).
Viability and Osteogenic Differentiation Capacity of CA, CA/OP, and OP
Osteoblasts
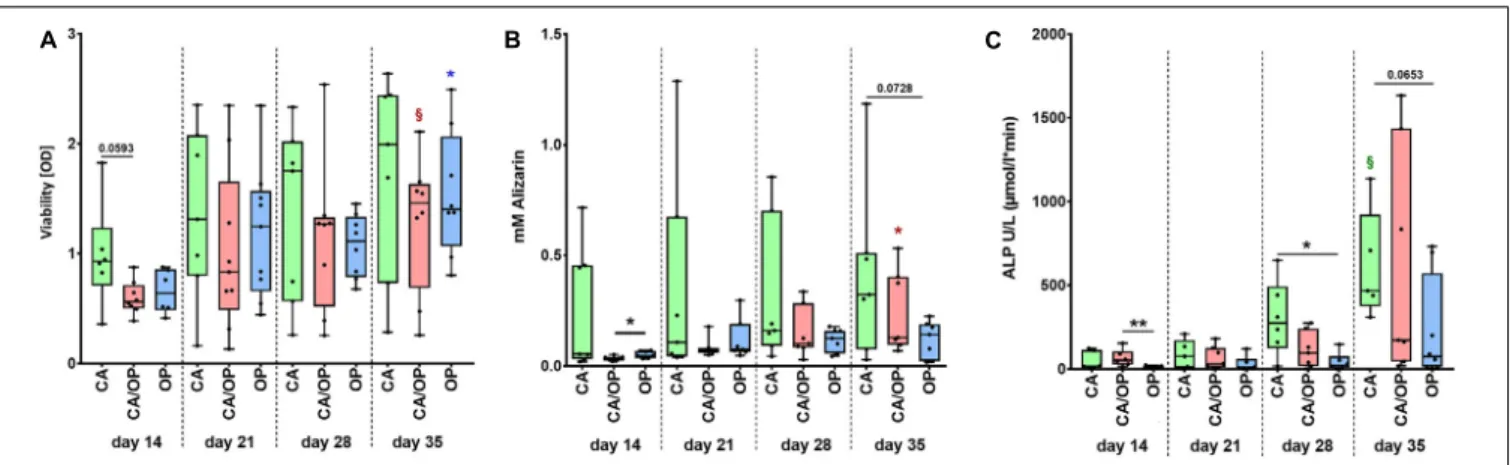
Before collection of culture supernatant for EV isolation, we compared viability, calcium deposition ability (Alizarin Red quantification) and ALP enzyme activity between CA, CA/OP, and OP osteoblasts throughout the osteogenic differentiation time line. Viability was by trend higher in CA compared to CA/OP osteoblasts after 14 days in osteogenic medium.
No further differences were observed between the groups but viability increased by trend during osteogenic differentiation (days 14–35) for CA/OP and significantly for OP osteoblasts (Figure 3A). Calcium deposition was higher in OP compared to CA/OP osteoblasts after 14 days and in CA compared to OP osteoblasts (trend) after 35 days in osteogenic medium. Calcium deposition increased significantly from days 14 to 35 in CA/OP osteoblast cultures (Figure 3B). Intracellular ALP enzyme activity was higher in CA/OP compared to OP osteoblasts after 14 days in osteogenic medium. During later osteogenic differentiation, after 28 and 35 days, ALP activity was higher in CA compared to OP osteoblasts. ALP enzyme activity increased by trend in CA osteoblasts during osteogenic differentiation (days 14–
35) (Figure 3C).
Expression of Osteogenic Marker Genes in CA, CA/OP, and OP Osteoblasts
Culture supernatant for EV/exosome isolation was collected during late osteogenic differentiation, therefore expression of osteogenic marker genes BGLAP, COL1A1, RUNX2, and ALP was compared between CA, CA/OP, and OP osteoblasts after 28 and 35 days. Results of the RT-qPCR analysis were calculated as 1 CT-values in relation to GAPDH expression indicating that a lower 1 CT-value would represent higher gene expression levels, whereas a higher 1CT-value demonstrates lower gene expression levels. Our data revealed no differences regarding gene expression of BGLAP, COL1A1, Runx2, and ALP between CA, CA/OP, and OP osteoblasts after 28 and 35 days in osteogenic medium (Figures 4A,B).
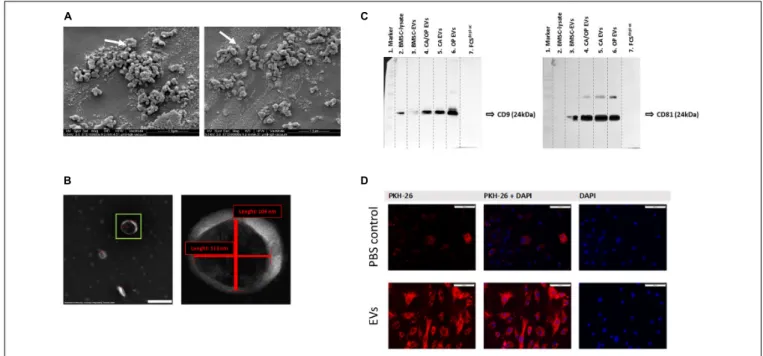
SEM and TEM Evaluation of Isolated EVs From Naïve BMSCs
BMSC-derived EVs were characterized using SEM. Here,
numerous spherical particles were revealed having a round and
uniform morphology. The distribution of size was unimodal with
an average range of about 100 nm (Figure 5A, 97 nm—left image,
115 nm—right image). To further validate the isolated particles
as EVs, TEM analysis was performed. We detected particles with
the typical cup-shaped morphology as a characteristic EV feature,
including exosomes. The depicted structure in Figure 5B (left
image—green box) had a length about 113 nm horizontal and
about 104 nm vertical (right image).
FIGURE 3 | Characterization of viability and osteogenic capacity of osteoblasts isolated from patients with CA, CA/OP, and OP. (A) Comparison of osteoblast viability [optical density = OD]. P-values over bars represent differences between groups (CA; CA/OP; OP).
§(Red) = p = 0.0781, represents tendency compared to the CA/OP group at day 14. *(blue) = p ≤ 0.05, represents difference compared to the OP group at day 14. N = 6–9. (B) Matrix formation capacity was compared using Alizarin Red staining. Graph shows concentration of Alizarin Red in mM. P-values over bars or *(= p ≤ 0.05) represent differences between groups (CA;
CA/OP; OP). *(red) = p ≤ 0.05, represents difference compared to the CA/OP group at day 14. N = 7–8. (C) Bone formation ability was compared by assaying intracellular ALP enzyme activity (U/L). P-values over bars or *(= p ≤ 0.05)/**(= p ≤ 0.01) represent differences between groups.
§(Green) = p = 0.0625, represents tendency compared to the CA/OP group at day 14. (CA; CA/OP; OP). N = 6–8.
FIGURE 4 | Gene expression of BGLAP, COL1A1, Runx2, and ALP in CA, OP, and CA/OP osteoblasts after 28 (A) and 35 (B) days in osteogenic culture medium.
These time points were chosen according to time points for EV isolation from the culture supernatants of osteogenic cultured CA, OP, and CA/OP osteoblasts.
Results were calculated by the 1Ct method. N = 4.
Western Blot Analysis for Exosome Markers CD9 and CD81
Western blotting was performed to verify the presence of EV membrane markers CD9 and CD81. EVs isolated from BMSCs, CA, OP, and CA/OP osteoblasts were analyzed and whole BMSC- lysates were used as positive control. In addition, FCS depl. − uc was analyzed, to control for absence of EV markers. CD9 positive bands were detected at a size of about 24 kDa in the BMSC lysate, BMSC EVs as well as CA, CA/OP, and OP EVs (Figure 5C, left
image). Positive bands for CD81 were detected at 25 kDA in BMSC, CA, CA/OP, and OP EVs, but not in the BMSC cell lysate (Figure 5C right image). No bands were detected in undiluted FCS depl. − uc . Supplementary Figure 3 shows respective images of Ponceau red stained membranes.
EV Uptake
PKH-26 staining was performed to analyze the uptake of EVs by
BMSCs. The upper row of Figure 5D shows confocal fluorescent
FIGURE 5 | EV characterization and validation. (A) Representative SEM pictures of BMSC EVs. White arrows label EVs with 97 nm (left image) and 115 nm (right image) diameter. Magnification: 60,000×. (B) Representative TEM pictures of BMSC EVs. Scale bar left image = 200 nm, magnification: 100,000×. Right image shows magnification of the EV in the green box. The size of objects was determined (red lines). Vertical line = 104 nm, horizontal line = 113 nm. (C) Western Blot analysis of EV specific surface markers CD9 (left image) and CD81 (right image) in BMSC, CA, CA/OP, and OP EVs and in the EV-depleted FCS
depl-uc. Lane 1 = MW ladder, Lane 2 = 5 µg; Lanes 3–6 = 8.2 µg; Lane 7 = 10 µl; Exposure time: left image = 3 min, right image = 10 min (Pierce femto Kit). For respective Ponceau Red images, see Supplementary Figure 3. (D) Test for EV uptake of BMSC-derived EVs into cultured BMSCs using PKH-26 (red) stained EVs (lower panel). PBS solution + PKH-26 stain was used as negative control (upper panel). Nuclei were counterstained with DAPI. Scale bar 100 µ m.
microscopy data for PBS instead of PKH-26 stained EVs as control for false positive staining (PKH-26 in left image, DAPI in right image, overlay in middle image). Some unspecific dyed micro-particles were observed in the negative control, that had been internalized by BMSCs. In contrast, intense red staining was recorded intracellularly after incubation of BMSCs with the PKH-26 labeled EVs (Figure 5D, lower row). Red structures were localized to intracellular compartments as a result of internalization of PKH-26 stained EVs.
Effects of BMSC-, CA-, CA/ OP-, and OP-Derived EVs on BMSC Metabolism
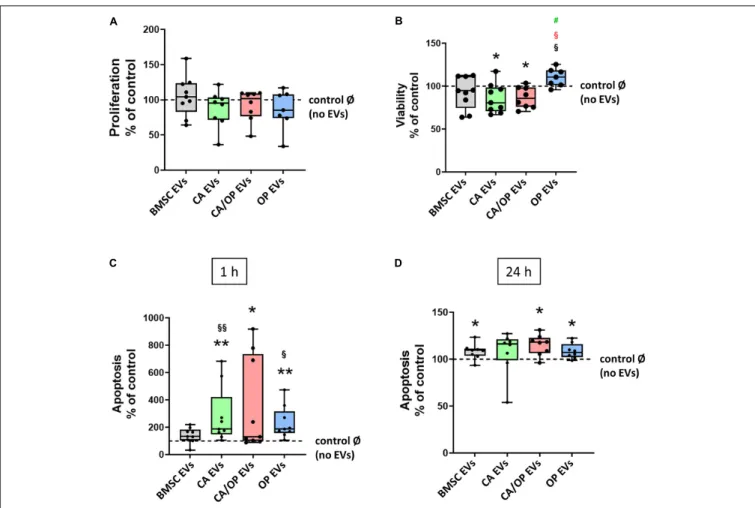
Proliferation, viability and Caspase 3/7 activity were analyzed to test the impact of naïve BMSC-, CA-, CA/ OP-, and OP-derived EVs on the metabolism of BMSCs. Positive effects had been reported in the literature for BMSC EVs on these parameters.
Therefore, we used naïve BMSC EVs to control for CA, OP, and CA/OP EV-mediated effects. In none of the groups, effects on cell proliferation were detected (Figure 6A). Cell viability was significantly decreased after stimulation with CA and CA/OP EVs compared to the No EV-control. Stimulation with OP EVs increased viability of BMSCs compared to the other three groups (Figure 6B). Apoptosis rate of BMSCs treated with CA and OP EVs was highly increased compared to cells stimulated with naïve BMSC EVs and compared to the “No EV-control.”
Higher apoptosis rate was recorded in CA/OP EV-treated BMSCs compared to the No EV-control. Caspase 3/7 activity was not
affected in BMSC EV-treated group (Figure 6C, 1 h assay time point). Comparable results were obtained for the 24 h assay time point (Figure 6D). Stimulation of BMSCs with CA/OP, OP, and naïve BMSC EVs increased apoptosis rate compared to the “No EV-control,” whereas no difference to the “No EV-control” was observed after 24 h for the CA EV-treated BMSC group.
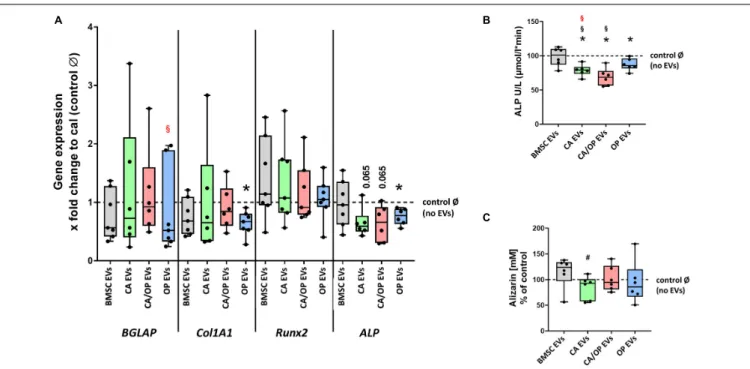
Effects of BMSC-, CA-, CA/ OP-, and OP-Derived EVs on Expression of Osteogenic Marker Genes in BMSCs
Next, we investigated the impact of naïve BMSC-, CA-, CA/ OP-, and OP-derived EVs on osteogenic gene expression in BMSCs (Figure 7A). The gene BGLAP is a marker for the late osteogenic differentiation stage and codes for a protein that binds to calcium and hydroxyapatite. BGLAP expression revealed no difference in BMSC cultures after stimulation with naïve BMSC, CA, CA/OP, and OP EVs compared to the No EV-control. However, BGLAP expression was significantly decreased in the OP EV compared to CA/OP EV-treated BMSC group. COL1A1 was used as a marker for early osteogenic differentiation. Stimulation with OP EVs significantly decreased COL1A1 expression compared to the No EV-control. No differences were observed in the other groups.
RUNX2, a crucial osteogenic transcription factor, was not affected
in all groups. ALP was used as a marker gene for bone formation
processes. Expression was reduced significantly in BMSCs after
stimulation with OP EVs and by trend after stimulation with
FIGURE 6 | Influence of EVs isolated from BMSCs and CA, CA/OP, and OP osteoblasts on BMSC metabolism. (A) Proliferation of BMSCs after cultivation for 2 days followed by stimulation for 24 h with EVs isolated from BMSCs and CA, CA/OP, and OP osteoblasts. N = 9. (B) Viability (WST-1 assay) of BMSCs after cultivation for 2 days followed by stimulation for 48 h with EVs isolated from BMSCs and CA, CA/OP, and OP osteoblasts. N = 9. (C,D) Apoptosis rate (Caspase 3/7 activity assay) of BMSCs after cultivation for 2 days followed by stimulation for 24 h with EVs isolated from BMSCs and CA, CA/OP, and OP osteoblasts. Fluorescence was measured 1 h and 24 h after addition of Caspase 3/7-assay buffer. N = 9. Results were calculated as percentage to the unstimulated control (BMSCs without EV stimulation/no EVs/Ø = 100%, shown by the dotted line). */**Significant differences to control Ø with p ≤ 0.05/0.01; §/§§Significant differences to BMSC EVs (EVs) with p ≤ 0.05/0.01.
§(red) = significant differences to CA/OP EVs with p ≤ 0.05.
#(green) = tendency compared to CA EVs.
CA- and CA/OP EVs compared to the No EV-control. Naïve BMSC-derived EVs had no effect.
Effects of BMSC-, CA-, CA/ OP-, and OP-Derived EVs on Osteogenic Differentiation Capacity of BMSCs
ALP enzyme activity was determined as a marker for bone formation activity. Treatment with CA, OP, and CA/OP EVs resulted in a significant decrease in ALP activity compared to the No EV-control, BMSC EV-treated cells remained unaffected. Further, stimulation with CA/OP and CA EVs decreased ALP enzyme activity compared to BMSC EV-treated group (Figure 7B).
To analyze the effect of the different EV groups on calcium deposition ability in osteogenic differentiated BMSCs, Alizarin Red staining was quantified. Stimulation of BMSCs with CA, OP, CA/OP, and BMSC EVs revealed no effect on extracellular calcium deposition compared to the No EV-control, but
stimulation with CA EVs reduced calcium deposition compared to BMSC EV-treated cells (Figure 7C).
DISCUSSION
Already in 2001, Wakitani et al. (2002) reported a beneficial use of MSCs for the treatment of knee OA. Since then, the use of MSC-based therapies revealed promising effects in OA therapy (Orozco et al., 2013; Davatchi et al., 2016; Harrell et al., 2019) and provides a promising approach for the treatment of OP (Paspaliaris and Kolios, 2019; Macías et al., 2020). Nowadays, the therapeutic effect of MSCs had in part been assigned to secreted factors encapsulated in extracellular vesicles, i.e., EVs.
The use of EVs as therapeutic drugs has several advantages compared to cell-based strategies as higher safety profile or lower immunogenicity (Gowen et al., 2020) making them an ideal treatment option, also for OA and OP (Cosenza et al., 2017;
Zhu et al., 2017; Yang et al., 2020). Most of the present studies
FIGURE 7 | Influence of stimulation with EV from BMSCs and CA, CA/OP, and OP osteoblasts on the expression of osteogenic marker genes in BMSCs and their osteogenic differentiation ability. (A) Gene expression of BGLAP, COL1A1, RUNX2, and ALP was analyzed after cultivation for 13 days followed by a 24 h stimulation of BMSCs with EVs isolated from BMSCs and CA, CA/OP, and OP osteoblasts. Calibrator (= no EVs/Ø control) was set to 1 and results were calibrated as x-fold change to calibrator (= 11Ct method). N = 7. (B) ALP enzyme activity as a marker for bone formation activity in BMSCs after cultivation for 21 days followed by stimulation during the last 7 days (EV addition 3× with medium exchange) with EVs isolated from BMSCs and CA, CA/OP, and OP osteoblasts. N = 7. (C) Alizarin Red incorporation into the extracellular matrix of BMSCs after cultivation for 21 days followed by stimulation during the last 7 days (EV addition 3× with medium exchange) with EVs isolated from BMSCs and CA, CA/OP, and OP osteoblasts. N = 7. *Significant differences compared to no EVs control Ø with p ≤ 0.05.
#