Evolution of orphan genes in Drosophila
I n a u g u r a l – D i s s e r t a t i o n zur
Erlangung des Doktorgrades
der Mathematisch-Naturwissenschaftlichen Fakultät der Universität zu Köln
vorgelegt von
Tomislav Domazet-Lošo aus Split, Kroatien
(
Köln, 2003)
Berichterstatter:
Prof. Dr. Diethard Tautz Prof. Dr. Thomas Wiehe
Tag der mündlichen Prüfung: 03. Juli 2003
Abbreviations 8 Zusammenfassung 9
1. Summary 11
2. Introduction 13
2.1 Genome sequencing projects and orphan genes 13
2.1.1 What are orphan genes? 13
2.1.2 Orphan genes and the yeast genome project 13 2.1.3 Orphan genes are ubiquitous in the genomes 14 2.2 Are there trivial explanations for phenomenon of orphan genes? 16 2.2.1 Do orphan genes code for real proteins? 16 2.2.2 Do orphan genes reflect incompleteness of gene databases? 17 2.2.3 Are orphan genes abundant copies of several genes? 18 2.3 Common assumptions about the evolutionary origin of orphan genes 18 2.4 Functional and other properties of orphan genes 19
2.4.1 Function of orphan genes 19
2.4.2 Distinct features of orphan genes 20
2.5 Orphan genes in Drosophila melanogaster genome 20
2.6 Open questions 21
3. Aim of the study 22
4. Results 23
4.1 Analysis of orphan genes in the D. melanogaster genome 23
4.1.1 Orphan gene content 23
4.1.2 Genetically studied orphan and non-orphan genes 25
4.2 Comparative analysis of expressed genes in D. yakuba 27 4.2.1 Orphan gene content in the sample of expressed genes 27
4.2.2 Genetically studied genes in the sample of expressed genes 27 4.2.3 Sequence properties of the expressed orphan genes 29
4.3 Substitution rates of the expressed genes in D. yakuba 31 4.3.1 Substitution rates of orphan and non-orphan genes 31
4.3.2 Substitution rates of embryo and adult transcripts 36 4.3.3 Substitution rates and genetically studied genes 37
4.4.2 Substitution rates of stage specific and non-restricted genes 41 4.4.3 Protein length of stage specific and non-restricted genes 43 4.4.4 Different expression of orphan genes in embryos and adults 43 4.5 Functional patterns of previously characterised orphan genes 49 4.6 Spatially restricted expression of orphan genes in Drosophila embryo 52
5. Discussion 54
5.1 Evolutionary scenarios for the origin of orphan genes 54
5.1.1 Orphan genes are a reality 54
5.1.2 Evolutionary scenarios 55
5.2 A model for orphan evolution 56
5.2.1 The model 56
5.2.2 Implications of the model 56
5.3 Differences between adults and embryos 59
5.3.1 Overall difference 59
5.3.2 Stage specific genes 60
5.3.3 Developmental constraint 61
5.4 Proteins under adaptive pressure 62
5.5 Conclusion 62
6. Materials and Methods 63
6.1 Database search 63
6.1.1 D. melanogaster proteome analysis 63
6.1.2 D. melanogaster EST database search 63
6.2 cDNA libraries and sequencing 64
6.2.1 D. yakuba 0-14 h embryo library 64
6.2.2 D. yakuba adult library 64
6.2.3 Preparation of plasmid DNA and sequencing 65
6.3 Basecalling and contig assembly 66
6.4 Evolutionary rates, sequence analysis and statistics 66
6.5 Expression analysis 67
7. Literature 68
8. Appendix 74
Erklärung 99 Lebenslauf 100
I am particularly grateful to Prof. Dr. Diethard Tautz for giving me opportunity to join his group, for his patience, guidance, criticism and support. I would like to show gratitude to Prof. Dr. Thomas Wiehe, Prof. Dr. Siegfrid Roth and Dr. Angelika Stollewerk as well for accepting a membership in my thesis committee.
I thank Dr. Wim Damen, Dr. Martin Gajewski and Dr. Angelika Stollewerk for helpful suggestions and discussions during my work. With great pleasure, I thank Dr.
Heidi Fusswinkel and Eva Sigmund for their kindness and help with solving numerous important administrative issues.
Many information technology problems would be very hard to solve without generous help of Alexander Pozhitkov. Our endless scientific and philosophical discussions helped me to clarify many ideas in this work. I am grateful to Hilary Dove for her overall support, especially at the beginning of my staying in Cologne. Karl Schmid generously provided me with embryo library and I am grateful for his hospitality during my visit in Jena. I appreciate discussions with Arne Nolte and his helpful experimental and theoretical hints, above all concerning sequencing.
Sebastian Steinfartz organized many things in the lab professionally, and his help during the very beginning of the project is appreciated. I thank Marco Mendez-Torres for his hospitality and help during my first months in Cologne. I thank Joel Savard who was providing me with the reliable experimental protocols. I thank Michael Schoppmeier and Nikola-Michael Prpić for many useful discussions and advices.
Sonja Ihle helped me with statistical problems and Christian Voolstra gave me in situ hybridisations hints. I am grateful to Susanne Krächter for helping me with sequencing. Finally, I express gratitude to all members of the Prof. Tautz lab that are not mentioned explicitly for their overall help.
Financial support from DFG (Ta99-17) is gratefully acknowledged.
In conclusion, I am particularly grateful to my parents, sister, relatives and friends and especially to Mirjana Madunić for their encouragement and support.
aa – amino acid
ANOVA – analysis of variance
BLAST – basic local alignment search tool bp – base pair
cfu – colony forming unit DEPC – diethyl pyrocarbonate
dN – non-synonymous substitution rate DNA – deoxyribonucleic acid
dNTP – deoxyribonucleoside triphosphate dS – synonymous substitution rate
ENC – effective number of codons EST – expressed sequence tag Fop – frequency of optimal codons GO – gene ontology database mel – Drosophila melanogaster mRNA – messanger ribonucleic acid
NCBI – national centre for biotechnology information ORF – open reading frame
P – probability
pfu – plaque forming unit
r – Pearson’s correlation coefficient RNA – ribonucleic acid
rs – Spearman’s rank correlation coefficient SAGE – serial analysis of gene expression yak – Drosophila yakuba
Orphan-Gene sind proteincodierende Bereiche, die kein erkennbares Homolog in entfernt verwandten Arten haben. Ein wesentlicher Anteil der bisher sequenzierten Genome besteht aus solchen Orphan-Genen, deren evolutionäre und funktionelle Bedeutung bislang nicht bekannt ist. Eine Analyse des Drosophila melanogaster Proteoms zeigt, dass immerhin 26 - 29% aller Proteine keine statistisch signifikanten Übereinstimmungen mit nicht aus Insekten stammenden Sequenzen haben. Entsprechend haben weder das stetige Anwachsen der Menge verfügbarer Sequenzdaten noch die Reannotation bekannter Gene den Anteil der Orphan-Gene im Drosophila Genom wesentlich verändert. Es konnte gezeigt werden, dass Orphan-Gene in derzeitigen genetischen Analysen deutlich unterrepräsentiert sind.
Um die evolutionären Eigenschaften von Orphan-Genen in Drosphila zu analysieren wurden 774 cDNA Sequenzen aus zwei D. yakuba-Genbibliotheken (adult und embryo) mit ihren Orthologen aus D. melanogaster verglichen. Eine Analyse der Substitutionsraten ergab, dass Orphan-Gene im Mittel dreimal schneller evolvieren als Nicht-Orphan-Gene, wobei die Breite der Evolutionsraten-Verteilung sich für beide Klassen ähnelt. Einzelne Orphan-Gene zeigen sehr niedrige Substitutionsraten, wie sie sonst für besonders hochkonservierte Gene typisch sind.
Ein allgemeines Modell für die Evolution von Orphan Genen wurde entwickelt, dass die grossen Substitutionsratenunterschiede durch Phasen schneller und langsamer Divergenz erklährt.
Neben der Tatsache, dass Orphan-Gene unter allen untersuchten Genen unterrepräsentiert sind gibt es Hinweise darauf, dass sie generell einen weniger offensichtlichen Phänotypen haben. Eine Hypothese besagt, dass funktionell wichtige Gene einen deutlichen Phänotypen und eine verlangsamte Evolutionsrate haben. Damit übereinstimmend waren unter den untersuchten cDNA’s genetisch charakterisierte Gene häufig langsam evolvierend. Interessanterweise war solch ein Zusammenhang nicht für Orphan-Gene zu beobachten. Zusätzlich spielen Orphan- Gene überproportional häufig eine Rolle für Geruchssinn, Hormonhaushalt, Puppenanheftung, Eimembranstrucktur und Wahrnehmung. Es ist anzunehmen, dass all diese Funktionen eine Bedeutung für spezifische ökologische Anpassungen haben, die sich schnell verändern und einen schwer detektierbaren mutanten Phänotypen haben.
Embryobibliothek. Eine Analyses der Gene, die Stadienspezifisch exprimiert werden, ergibt ein ähnliches Verhältnis. Zusammen mit einer bei Embryotranskripten gefundenen verringerten Evolutionsrate deutet sich deshalb eine stärkere Einschränkung für die Verwendung von Orphan-Genen in Embryos an. Die Expression von Orphan-Genen ist bei Embryos oft räumlich begrenzt, was auf eine eher lokale als ubiquitäre Verwendung hinweist. Die generellen Charackteristika von Orphan-Genen in Drosophila legen nahe, dass diese bei der Evolution von adaptiven Merkmalen eine Rolle spielen. Langsam evolvierende Orphan-Gene könnten von besonderem Interesse für die Bestimmung von linienspezifischen Adaptationen sein.
Orphan genes are protein coding regions that have no recognizable homologue in distantly related species. A substantial fraction of coding regions in any genome sequenced so far consists of such orphan genes, but their evolutionary and functional significance is not understood. A re-analysis of the Drosophila melanogaster proteome is presented that shows that there are still between 26 - 29%
of all proteins without a significant match with non-insect sequences. Therefore, neither the growth of the database nor the re-annotations have significantly changed the proportion of orphans in the Drosophila genome over time. In addition, it was shown that these orphans are significantly underrepresented in the current genetic analysis.
To analyse directly the evolutionary characteristics of orphan genes in Drosophila, 774 sequences were compared between cDNAs retrieved from two D.
yakuba libraries (embryo and adult) and their corresponding D. melanogaster orthologues. Analysis of substitution rates shows that recovered orphans evolve on average more than three times faster than non-orphan genes, although the width of the evolutionary rate distribution is similar for both classes. In particular, some orphan genes show very low substitution rates, which are comparable to otherwise highly, conserved genes. A general model for orphan gene evolution is proposed that takes these large rate differences into account and suggests that they are caused by episodic phases of fast and slow divergence.
Besides the result, that orphans are under-represented among genetically studied genes, additional findings suggest that orphan genes have less obvious phenotypes. For example, in the complete sample of the recovered cDNAs higher frequency of genetically studied genes was found among slow evolving genes, what supports the proposed hypothesis that functionally more important genes with obvious phenotypes have lower evolutionary rates. Interestingly, such relationship is lacking if only orphans are analysed. Additionally, orphans are over-represented among genes related to olfaction, hormonal activity, puparial adhesion, egg membrane structure and perception and response to abiotic stimulus. It is reasonable to expect for all of these functions to be involved in specific ecological adaptations that change easily over time, and accordingly to have mutant phenotypes which are difficult to detect.
genes having stage specific expression reveals a similar figure and together with lower evolutionary rate of embryo transcripts suggests a higher constraint on use of orphan genes in embryos. Furthermore, expression of embryo orphans is more often spatially restricted compared to a random sample of genes what shows that they act in more localised rather then ubiquitous manner. Taken together, the general characteristics of orphan genes in Drosophila suggest that they may be involved in the evolution of adaptive traits and that slow evolving orphan genes may be particularly interesting candidate genes for identifying lineage specific adaptations.
2. Introduction
2.1 Genome sequencing projects and orphan genes 2.1.1 What are orphan genes?
A gene that has amino acid sequence similarity to other genes that belong to relatively narrow monophyletic lineages is referred to as an orphan gene. The phylogenetic group used to define orphan genes in a particular study is necessary arbitrary, often influenced by availability of the sequence data. In the most rigorous use, the term designates strictly genes specific just for one species, moreover sometimes only one strain (e.g. bacterial species), but more frequently group of closely related species is compared to the rest of the living organisms. It is reasonable to expect that genes specific to relatively closely related organisms exist.
However, surprisingly, they came into focus only after first complete genomes were sequenced. Most of the genes, studied before the genome era, had sequence counterparts in distantly related organisms, scattered among more general taxonomic divisions like phyla and kingdoms. Sequence similarity between these conserved genes often implied their similar functional roles. This was the reason that genome content was envisaged in a considerably biased way. The yeast genome, as the first completely sequenced eukaryotic genome (Goffeau et al., 1996), illustrates this preconception.
2.1.2 Orphan genes and the yeast genome project
Already after the completion of the first chromosome (chromosome III) of Saccharomyces cerevisiae (Oliver et al., 1992) it was obvious that most of the predicted protein coding genes did not correspond to any previously encountered sequence. This finding was unexpected for an otherwise genetically extensively studied organism such as yeast. Before sequencing of the complete yeast genome started, identification of the same new gene by independent investigators had been becoming frequent; leading to the notion that the yeast genome had become over- studied. When the complete yeast genome was sequenced it was estimated,
depending on the stringency criteria applied, that 30% to 35% of 6275 predicted genes are without any match to other proteins in the gene databases or without any functional information. Inability of genetic screens to uncover substantial proportion of genes and inability of researchers to transfer functional information to these genes using sequence similarity motivated Dujon to name this unforeseen result “the mystery of orphan genes” (Dujon, 1996).
It is important to note that the term ‘orphan’ in this initial analysis of the yeast genome had a double meaning, namely coding regions without known function and coding regions without matches to other genes in the database (Dujon, 1996).
However, taking into account only lack of the sequence similarity, a later study came to a similar proportion of yeast orphans (Malpertuy et al., 2000). To overcome confusion because of the initial functional connotation of the orphan definition Malpertuy and co-workres (2000) proposed the term 'maverick' gene for a gene with lack of sequence similarity to other organisms. However, the definition of orphan genes as coding regions without matches to other genes in the database is usually used (Fischer and Eisenberg, 1999; Schmid and Aquadro, 2001; Jordan et al., 2002a).
2.1.3 Orphan genes are ubiquitous in the genomes
Genome projects of the eukaryotic and prokaryotic (Fischer and Eisenberg, 1999) organisms confirmed findings in the analysis of the yeast genome. Table 1 summarizes approximate orphan content for some completely sequenced eukaryotic genomes based on the original genome publication data. Although similarity searches in these studies were performed in a not directly comparable way, because of different databases sizes used (Spang and Vingron, 2001), differences in their content and varying significance thresholds, it can be said that almost each newly sequenced genome brought a large number of new orphan genes.
Taken together, it can be concluded that the genome sequencing projects uncovered a substantial proportion of genes without sequence similarity in other organisms that were also missed by various previous functional approaches.
Although this phenomenon is not a trivial issue of the genomic and post-genomic research, a small number of studies have addressed this question, and very often just as a side topic.
Introduction Table 1. Approximate orphan gene content in some of the completely sequenced eukaryotic genomes Organism Year of publication No. of genes Orphan genes Taxonomic groupa Reference Saccharomyces cerevisiae 1996627530-35%Saccharomyces cerevisiae (Goffeau et al., 1996; Dujon, 1996) 2000 5651 32 % Ascomycetes (Malpertuy et al., 2000) Caenorhabditis elegans 19981860058%Nematoda(Blaxter, 1998; The C. elegans Sequencing Consortium., 1998) Drosophila melanogaster 2000 13601 ~ 30 % Drosophila melanogaster (Rubin et al., 2000; Adams et al., 2000) 20021388518.6%Drosophila melanogaster (Zdobnov et al., 2002) 2002 13885 34.5 % Insecta (Zdobnov et al., 2002) Homo sapiens 20013177825%Homo sapiens (Lander et al., 2001) Schizosaccharomyces pombe 2002482414%Schizosaccharomyces pombe (Wood et al., 2002) 30%Schizosaccharomyces pombe and Caenorhabditis elegans(Wood et al., 2002) Ciona intestinalis 20021585221%Ciona intestinalis (Dehal et al., 2002) Anopheles gambie 20021298111.1%Anopheles gambie (Zdobnov et al., 2002) 2002 12981 29.0 % Insecta (Zdobnov et al., 2002) Mus musculus 2002 22011 ~ 0 % Mus musculus (Waterston et al., 2002) 2002 22011 14 % Mamalia (Waterston et al., 2002) 2002 22011 20 % Chordata (Waterston et al., 2002) Arabidopsis thaliana 2000 25498 ? - (Arabidopsis Genome Initiative, 2000) Oryza sativa 2002 53398 ~50 % monocots (Yu et al., 2002) a Taxonomic rank used to define orphan genes. If a gene lacks sequence similarity to a sequence outside the stated taxonomic rank it is considered as an orphan gene.
2.2 Are there trivial explanations for phenomenon of orphan genes?
2.2.1 Do orphan genes code for real proteins?
The first trivial explanation, which could account for the existence of orphan genes, is that orphan genes are just over-predicted open reading frames (ORFs) that do not code for the functional proteins. Correct selecting of ORFs (which are coding for real proteins) from an 'ORFome' (total number of possible ORFs) is recognized as the main problem in defining the proteome of an organism. (Zhang, 2002; Harrison et al., 2002; Parra et al., 2003). Direct functional analysis and different types of transcriptome analysis, e.g. expressed sequenced tags (EST) projects, full length cDNA sequencing, serial analysis of gene expression (SAGE) (Velculescu et al., 1997) and microarray analysis (Shoemaker et al., 2001; Clark et al., 2002), are used to improve pure ab initio or homology based annotation of the genomes. However, high-throughput experimental approaches for identification of genes and their functions are still in development. As a result, reliable experimental genomic data, necessary for precise annotations and improvement of prediction tools, is still missing (Zhang, 2002).
Because of the above reasons the gene count for many completely sequenced eukaryotic genomes is still debated. Even the true size of the yeast proteome has been a point of considerable confusion, although its complete genome is available for already seven years. In the beginning, as high orphan content of the yeast genome was unexpected and confusing, several studies based on statistical properties of known genes tried to correct the gene count arguing that many of the ORFs are over-predicted (Kowalczuk et al., 1999; Mackiewicz et al., 1999; Zhang and Wang, 2000). However, when the partial genome sequences of a set of closely related Hemiascomycetous yeasts became available, it was possible to support the annotation of many orphan genes based on sequence similarity. This study showed that, although the total estimated number of genes dropped by 9 % compared to the initial one (Table 1), the proportion of orphans, now defined as Hemiascomycetous yeast specific genes, remained the same. This result suggests that, most likely, miss- annotation is not the major determinant that can account for the existence of orphan genes, at least not in the yeast genome. However, this study does not provide evidence that the regions, having similarity to the yeast orphans, are indeed protein coding. Transcriptional analysis of these regions is indispensable to show that they
related bacterial species Mycoplasma pneumoniae and Mycoplasma genitalium brought orthologues for the most of the predicted genes (Himmelreich et al., 1997). In the same way, the recent sequencing of human (Lander et al., 2001) and mouse genome (Waterston et al., 2002), which are closely related organisms in the terms of evolutionary rates, brought support for many mammal specific orphans. However, in this case caution is necessary because of a very unreliable annotation of these genomes (Harrison et al., 2002; Xuan et al., 2003; Parra et al., 2003).
Contrary to the above findings, a direct study of four orphans from the Drosophila melanogaster Adh region found that their ORFs were interrupted in the closely related species D. simulans or D. yakuba, indicating that they are not real genes (Schmid and Aquadro, 2001). Taken together, it is not yet clear which proportion of orphans are functional proteins, although several studies suggest that many of them are real genes.
2.2.2 Do orphan genes reflect incompleteness of gene databases?
Based on the studies reported in the previous section it seems that reliable annotation of a genome requires sequencing of two or more closely related species and that orphan genes will have orthologues only in the closely related organisms.
However, another trivial explanation for orphan genes could be that they are genes that do have homologues in other distantly related organisms but that these organisms are not yet sequenced. Indeed, complete genome sequences of many phyla are missing in the databases. On the other hand, if incompleteness of gene databases explains why most of the genes are orphans then accumulation of enough sequence information in the databases would reduce their number. However, all genome projects so far have identified a substantial fraction of open reading frames that have no similarity to the other genes in the database, demonstrating that the fraction of orphans cumulatively does not diminish (Fischer and Eisenberg, 1999;
Rubin et al., 2000) (Table 1). Accordingly, this defies early hopes that an increasing database size would eventually reduce the number of orphan genes (Casari et al., 1996). On the other hand, there is also the possibility that the original reports about orphans are outdated and that previously classified orphans can now find matches to newly sequenced genes. Indeed, some decay in the number of bacterial orphans can be observed, but their proportion in bacterial genomes is still significantly high
(Fischer and Eisenberg, 1999). Nevertheless, rigorous tests on the current number of orphans for many sequenced genomes especially eukaryotic ones are missing.
2.2.3 Are orphan genes abundant copies of several genes?
If one takes orphan genes as reality, their abundance may alternatively be explained by a high copy number of several duplicated orphan genes. Fischer and Eisenberg (1999) tested the possibility that a high frequency of orphans in bacteria is due to the existence of paralog families of orphan genes. Nevertheless, the frequency of recovered orphan protein families was also high. Moreover, they notice that bacterial orphans are less likely to be members of paralog families compared to other proteins. This observation is unexplained and opens the question about the evolutionary dynamics of orphan genes (Fischer and Eisenberg, 1999).
2.3 Common assumptions about the evolutionary origin of orphan genes
If a substantial fraction of orphan genes code for functional proteins, then the next question is about their evolutionary origin. There are two most commonly used explanations for the lack of sequence similarity of orphan genes. The first one is that orphan genes are fast evolving genes and the second one is that they are lineage specific genes (Blaxter, 1998; Fischer and Eisenberg, 1999; Wolfe and Sharp, 1993;
Malpertuy et al., 2000; Rubin et al., 2000; Schmid and Aquadro, 2001; Rubin, 2001;
Dehal et al., 2002). Certainly, these two possibilities are not expected to be mutually exclusive.
Several studies indirectly approached the question of protein evolution rate of orphan genes. A lower sequence conservation between genes of unknown functions, as compared with the functionally assigned genes, has been observed for the two related bacterial species Mycoplasma pneumoniae and Mycoplasma genitalium (Himmelreich et al., 1997). As unknown function is often coupled with lack of sequence similarity to distantly related organisms this was the hint that orphan genes might have different evolutionary rates. In a more direct approach, it was shown that sequence similarity between Kluyveromyces lactis and Saccharomyces cerevisiae is lower for orphans then for non-orphans (Ozier-Kalogeropoulos et al., 1998). Similar results were obtained in the analysis of the partial genomic sequence of other closely
a hint that at least some of the orphan genes could have reasonably low divergence rates, indicating that orphans might be lineage specific genes as well (Malpertuy et al., 2000). However, these results were based on the BLAST E-values and amino acid identities, which are rather rough measures of sequence divergence. In addition, these studies were based on the partial gene sequences derived form genomic regions, and thus they lack stronger evidence that aligned sequences are coding for real proteins.
Schmid and Tautz (1997) by genomic hybridisation studies and sequencing of orthologs from D. melanogaster and D. yakuba showed that the fraction of fast evolving genes in Drosophila is about 30%, roughly matching the percentage of orphan genes predicted in the Drosophila genome (Rubin et al., 2000). However, not all fast evolving genes were orphan genes. For example, a zinc-finger transcription factor and a functional homologue of a yeast chaperone gene was found in the class of fast evolving genes (Schmid et al., 1999; Wang et al., 1999). Both of these do not qualify as orphan genes as they match at least partially with known protein domains.
In addition, the relationship between average rate of sequence evolution and orphan gene status could not be established unequivocally because the applied hybridisation technique lacks the sensitivity and because public databases contained in the time of that study only the yeast genome as completely sequenced eukaryotic organism.
2.4 Functional and other properties of orphan genes 2.4.1 Function of orphan genes
As mentioned in the previous part, lack of sequence conservation of orphan genes is coupled with lack of their functional assignment, not only due to the inability of researchers to infer functional information using the sequence similarity but also because phenotype information for orphan gene mutants was not obtained by the genetic studies. This was originally found in the yeast project (Oliver et al., 1992;
Dujon, 1996) but was also noted in the extensive study of the Adh region in Drosophila (Ashburner et al., 1999) and the analysis of fast evolving genes (Tautz and Schmid, 1998). Comparison of genomes of bacterial strains of the same species also suggest that strain specific genes are over-represented among functionally uncharacterised genes (Jordan et al., 2002b).
Indirectly, a possible function of orphan genes can be traced trough some comparative genomics and yeast studies. For example, genomic exploration of the closely related yeast species shows that orphan genes are especially abundant among proteins involved in the extracellular secretion and in the organisation of the cell wall (Gaillardin et al., 2000). Interestingly, both of these functional classes were extensively used as taxonomic markers (Phaff, 1998). In bacterial, archaeal and eukaryotic organisms some of the proteins with narrow phyletic distribution were shown to function at the periphery of the cell. More specifically, some of them were predicted membrane proteins that may mediate the interaction of the cells with their environment (Jordan et al., 2001; Jordan et al., 2002b).
2.4.2 Distinct features of orphan genes
Several studies report some additional distinct properties of orphan genes.
For example, Lipman et al. (2002) found in a comparison between two prokaryotes, yeast, Drosophila and humans that non-conserved genes are generally shorter than conserved ones and that their length distribution is more uniform. This could be explained if non-conserved genes are under weaker selective constraints and would thus more easily tolerate deletion mutations. The comparison between the Drosophila and the Anopheles proteome shows also that the orphans that are specific for each species have the shortest average length (Zdobnov et a. 2002).
There is also indication that orphan genes are generally lower expressed than non-orphan genes. The observation that phylogenetically conserved genes are more highly expressed tested by occurrence of ESTs was first made by Green et al. (1993) (Green et al., 1993) and was confirmed in the analysis of the Adh region in Drosophila (Ashburner et al., 1999).
2.5 Orphan genes in Drosophila melanogaster genome
The first annotation of the D. melanogaster genome uncovered that 28% of predicted genes has no sequence similarity to other organisms (Adams et al., 2000).
However, a systematic study or orphan genes in the Drosophila at the genome level is still missing, although high orphan gene content was announced three years before as an important open question of fly biology (Rubin et al., 2000). Since then
(Schmid and Aquadro, 2001).
2.6 Open questions
Based on the current state of the literature many of the important questions concerning orphan genes are not answered. For example, it is not clear which fraction of orphans are coding for real proteins, especially in the eukaryotic organisms. Although repeatedly noted, under-representation of orphans among studied genes was not tested on the genome level. The evolutionary origin of orphan genes is also still enigmatic. Two proposed reasons for the lack of sequence similarity of orphans, namely rapid evolution of coding sequence and/or lineage specific localization of these genes, have not yet been tested rigorously. There is definite scarcity of information concerning the function of orphan genes, although some functional roles are suggested. Moreover, protein properties, expression profiles and position in biochemical pathways are almost completely unexplored for orphan genes.
3. Aim of the study
The aim of this thesis was to study evolutionary dynamics, as well as sequence properties of the orphan genes in Drosophila, with view to understand their evolutionary origin and general functional patterns.
The following aspects were in special focus of this study:
• Proportion of orphan genes in the Drosophila melanogaster genome
• Under-representation of orphan genes in the genetic studies
• Testing of hypothesis that orphan genes are fast evolving genes
• Testing of hypothesis that functionally more important Drosophila genes have lower evolutionary rates
• Comparison of evolutionary rates between adult and embryo transcripts
• Expression levels of orphan genes trough ontogeny of Drosophila and their relation to possible genetic or developmental constraint
• Statistical analysis of functional patterns of previously characterized orphan genes
• Spatial expression of orphan genes in the Drosophila embryo
4. Results
4.1 Analysis of orphan genes in the D. melanogaster genome 4.1.1 Orphan gene content
As gene database content is increasing exponentially and annotation of the complete genomes is improving some change in the number of orphan genes in Drosophila genome can be expected. The current database was therefore re- analysed using BLASTP with the about 14,300 predicted full-length proteins of the Drosophila melanogaster proteome (release 2), to re-analyse whether the fraction of orphans reported previously (Rubin et al., 2000) has changed over time. As the probability of identifying a significant BLAST match depends on the size of the database (Spang and Vingron, 2001), it is not possible to use a single probability cutoff criterion for assigning orphan status. To overcome this uncertainty, a range of probability cutoffs was used. For each cutoff category, as defined through the expectation (E)-values provided by BLAST (Altschul et al., 1990; Altschul et al., 1997), the fraction of genes was determined whose matches above this cutoff occurred only in Drosophila or other insects.
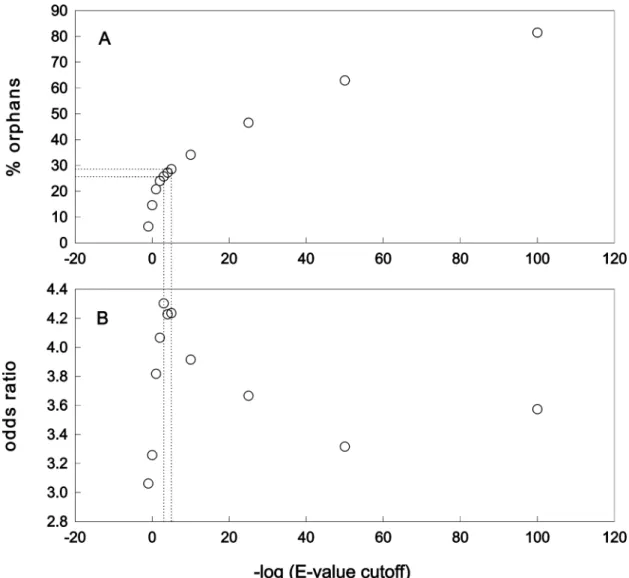
Figure 1a shows the results for cutoff E-value classes from 10 to 10-100. The number of non-matching sequences is very small at the highest E-values, but this is evidently due to many insignificant chance matches. With continuously lower E- values there is a continuous increase in the non-matching sequences and there is no obvious criterion for choosing a particular E-value as a cutoff criterion for orphan genes. Most studies prefer to take cutoff values form 10-3 to 10-5 to discriminate significant matches from ‘noise’ in a similar type of database search (e.g. Lipman et al., 2002), whereby the 10-3 cutoff value is considered as rather conservative. In this analysis for cutoff classes form 10-3 to 10-5, the fraction of orphan genes is 26 to 29 % (marked in Figure 1a). When the BLAST output data were inspected manually and decision about the significance of a match was done case-by-case, most of the E- values were also fitting to the above range. Besides these arguments, additional support that the chosen cutoff values are appropriate comes from analysis of the named genes in Drosophila genome (see section 4.1.2). Based on these results it
can be concluded that the fraction of the orphan genes in the Drosophila genome is still comparable to what has been repeatedly found in the past (Rubin et al., 2000).
Therefore, neither the growth of the database nor the re-annotations have significantly changed this value over time.
Figure 1. A: Percentage of orphans found in each cutoff category. The broken lines indicate the BLAST E-value range of 10-3 to 10-5, for which 26 to 29% orphan genes and the highest odds ratio were found (see below) B: Odds-ratios for genetically studied genes in the different cutoff classes. The values indicate how much more likely one finds a genetically studied gene in the non-orphan compared to the orphan class. All values are highly significant (P = 0 Fischer’s exact test).
4.1.2 Genetically studied orphan and non-orphan genes
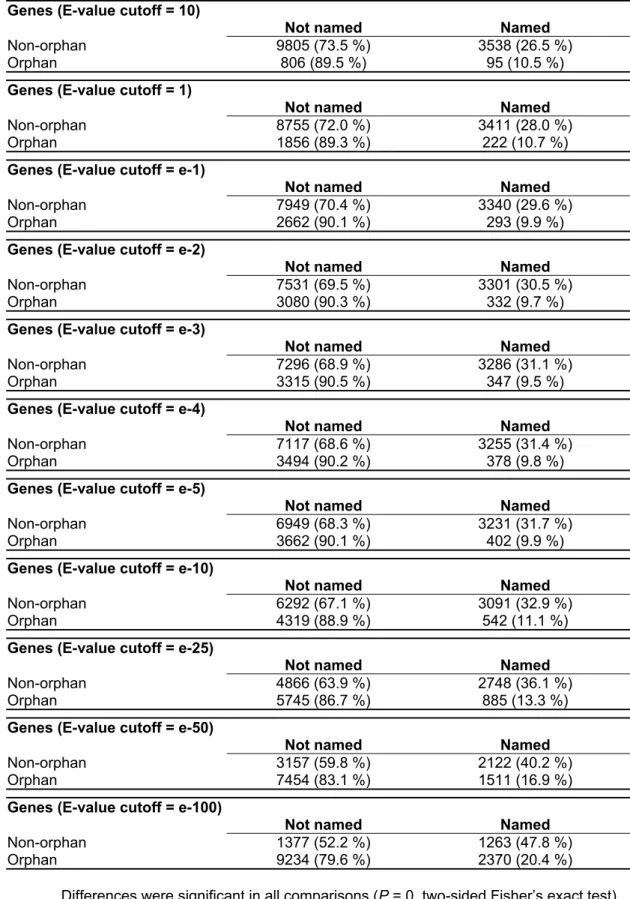
In Drosophila, one can take the fact that a gene has been named as an approximate indicator that it has been genetically studied, i.e. that a described mutant exists for it. Therefore, the relative proportion of genetically studied genes was analysed in all cutoff categories. There are currently 3,633 named genes in Drosophila, which correspond to about 26 % of the known ORFs. Differences in the number of named genes were compared between the orphan and non-orphan sample for each cutoff category (Table 2) and corresponding odds-ratios were calculated (Figure 1b). The results show that named genes, independent of the chosen E-value cutoff, are more likely to occur in the non-orphan class. The odds ratio of finding named genes among non-orphans compared to orphans is the highest for 10-3 to 10-5 cutoff class, supporting the notion that orphan genes are less likely to be recovered in the current genetic screens.
Interestingly, the odds ratio analysis has a peak at the same cutoff range as the one chosen to re-estimate the proportion of orphan genes in the Drosophila genome (see section 4.1.1). This supports independently the correctness of the chosen cutoff range, because such a peak can be expected only for a non-orphan sample with the lowest level of incorrectly assigned genes. This reasoning is based on the assumption of general over-representation of named genes in the non-orphan sample. Accordingly, more loose or stringent cutoff values then the optimal one would change the odd ratio by introducing false positives or excluding false negatives (Figure 1).
Additionally, it is interesting to note that even if E-value cutoff of 10–50 is used as threshold for a significant match, 58% of the named Drosophila genes are still among non-orphans, although the non-orphan class contains for this threshold only 37 % of all genes. This is indication, if BLAST E-value is taken as a rough measure of sequence conservation, that genetic studies have focused on phylogenetically strongly conserved genes, whereas lineage specific and phylogenetically broadly distributed weekly conserved genes were more likely to be overlooked.
Table 2. Number of named genes in the orphan and non-orphan sample (complete Drosophila genome)
Genes (E-value cutoff = 10)
Not named Named
Non-orphan 9805 (73.5 %) 3538 (26.5 %)
Orphan 806 (89.5 %) 95 (10.5 %)
Genes (E-value cutoff = 1)
Not named Named
Non-orphan 8755 (72.0 %) 3411 (28.0 %)
Orphan 1856 (89.3 %) 222 (10.7 %)
Genes (E-value cutoff = e-1)
Not named Named
Non-orphan 7949 (70.4 %) 3340 (29.6 %)
Orphan 2662 (90.1 %) 293 (9.9 %)
Genes (E-value cutoff = e-2)
Not named Named
Non-orphan 7531 (69.5 %) 3301 (30.5 %)
Orphan 3080 (90.3 %) 332 (9.7 %)
Genes (E-value cutoff = e-3)
Not named Named
Non-orphan 7296 (68.9 %) 3286 (31.1 %)
Orphan 3315 (90.5 %) 347 (9.5 %)
Genes (E-value cutoff = e-4)
Not named Named
Non-orphan 7117 (68.6 %) 3255 (31.4 %)
Orphan 3494 (90.2 %) 378 (9.8 %)
Genes (E-value cutoff = e-5)
Not named Named
Non-orphan 6949 (68.3 %) 3231 (31.7 %)
Orphan 3662 (90.1 %) 402 (9.9 %)
Genes (E-value cutoff = e-10)
Not named Named
Non-orphan 6292 (67.1 %) 3091 (32.9 %)
Orphan 4319 (88.9 %) 542 (11.1 %)
Genes (E-value cutoff = e-25)
Not named Named
Non-orphan 4866 (63.9 %) 2748 (36.1 %)
Orphan 5745 (86.7 %) 885 (13.3 %)
Genes (E-value cutoff = e-50)
Not named Named
Non-orphan 3157 (59.8 %) 2122 (40.2 %)
Orphan 7454 (83.1 %) 1511 (16.9 %)
Genes (E-value cutoff = e-100)
Not named Named
Non-orphan 1377 (52.2 %) 1263 (47.8 %)
Orphan 9234 (79.6 %) 2370 (20.4 %)
Differences were significant in all comparisons (P = 0, two-sided Fisher’s exact test).
4.2 Comparative analysis of expressed genes in D. yakuba 4.2.1 Orphan gene content in the sample of expressed genes
Analysis of expressed genes allows avoiding mistakes due to wrong annotations. To study directly the evolutionary characteristics of orphan genes, cDNA libraries were prepared from D. yakuba embryos and adults and clones were picked randomly from these. The clones were initially 5’-sequenced to check for redundant clones and the non-redundant clones were then fully sequenced to high quality.
Comparisons with the D. melanogaster genome sequence allowed to unequivocally identify the corresponding D. melanogaster orthologue in all cases. The full D.
melanogaster gene sequence was then taken to determine whether it is an orphan applying the rather conservative cutoff criterion of E > 10-4.
Approximately 400 non-redundant cDNAs were obtained from each of the two libraries (371 from the adult and 403 from the embryo library). Among these, 81 genes were found in both libraries and just one of them was orphan. The embryo library contains 42 and the adult library 81 orphan genes. To be certain that only true orphans were included, clones in which a weak match with an InterPro domain was present were removed, although significance of these weak matches may be questionable. This curation yielded 34 orphan genes for the embryo library (8.4 %) and 73 (19.7 %) for the adult library, which is highly significant difference (P < 0.001).
This difference is analysed in more detail in sections 4.3.2 and 4.4. On the other hand, the percentages are lower than one would have expected from the whole genome scan (27.1 % in the 10-4 class). This could either suggest that many of the genomic orphans are indeed due to wrong annotations (Schmid and Aquadro, 2001), or that orphans are generally lower expressed than non-orphan genes, with a corresponding under-representation in cDNA libraries. That less conserved genes may be generally lower expressed has also been noted before (see Introduction, 2.4.2).
4.2.2 Genetically studied genes in the sample of expressed genes
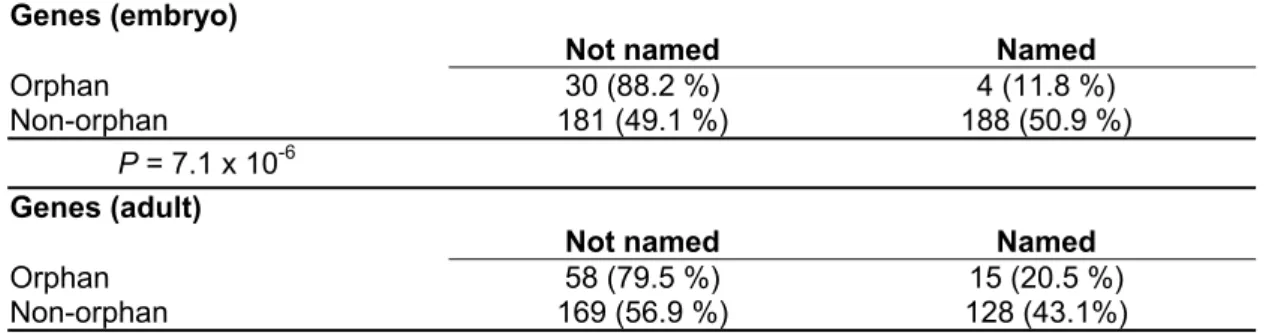
Named genes are strongly under-represented among identified orphans. The odds ratio analysis shows that in the embryo library it is almost eight times and in the
adult library it is almost three times less likely to find a named gene in the orphan class than in the non-orphan class (Table 3). Still, 4 orphan genes in the embryo library and 15 in the adult library are previously named genes, but it is interesting to look at the nature of the named genes in the orphan class (Table 4). In the adult library genes with available functional information are involved in immune response, behaviour, oxygen deprivation or regulation of circadian rhythm and flight. All these functions can be expected to be important in a specific ecological context.
Interestingly, for several of these mutants are not known, i.e. they were named because of other reasons.
Table 3. Number of named genes in the orphan and non-orphan sample (genes recovered in this study)
Genes (embryo)
Not named Named
Orphan 30 (88.2 %) 4 (11.8 %)
Non-orphan 181 (49.1 %) 188 (50.9 %)
P = 7.1 x 10⁻⁶ Genes (adult)
Not named Named
Orphan 58 (79.5 %) 15 (20.5 %)
Non-orphan 169 (56.9 %) 128 (43.1%)
P = 0.0004, two-sided Fisher’s exact test
Table 4. Previously named orphan genes that were identified among D. yakuba cDNA sequences
Name Function Mutants
Adult library
ACP53EA Accessory gland-specific peptide 53Ea 6 alleles known AttA Attacin-A, a gram-negative antibacterial peptide none
AttD Attacin-D, a putative antibacterial peptide none Cp16 Chorion protein 16 - structural protein of the chorion none Dpt Diptericin, a gram-negative antibacterial peptide none DptB Diptericin B, a putative antibacterial peptide none fau An anoxia-regulated novel gene none
fln Required for thick filament in flight muscle viable, but flightless fok Associated with kinesin-like molecule none
l(2)k09913 Unknown function recessive lethal Mst89B Testis specific expression, function unknown none
Noe Nervous system expression, function unknown none Os9 Olfactory system expression, function unknown none
to Circadian rythm regulated gene rythm defective yellow-c Possibly involved in cuticle development none
Embryo library
GATAd Non-specific RNA polymerase II transcription factor none
mael Involved in oocyte nucleus migration recessive lethal Tom Interacts genetically with Su(H) recessive lethal Df31 Component of the chromatin recessive lethal
4.2.3 Sequence properties of the expressed orphan genes
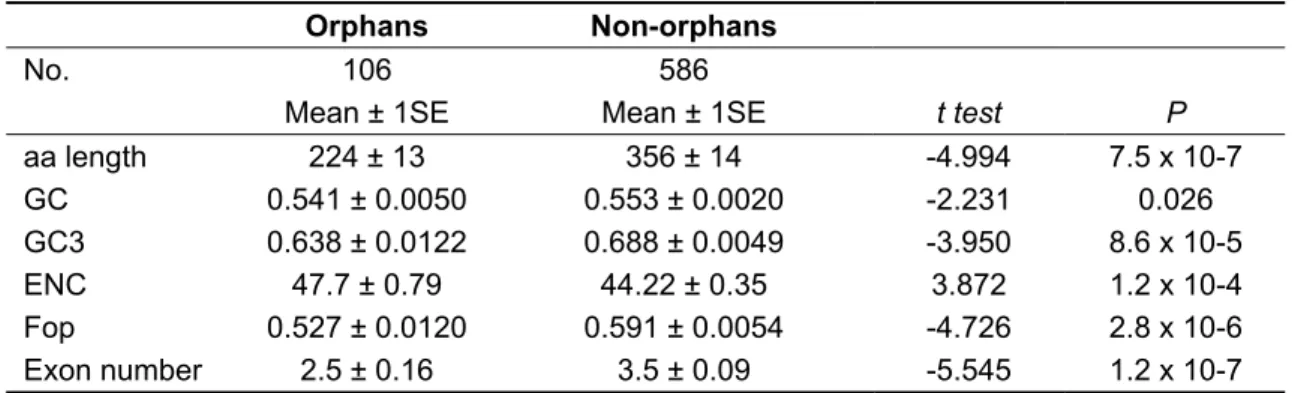
The identified orphan genes differ also in several other respects from non- orphan genes. They are on average more than 100 amino acids shorter, have lower GC content, lower codon usage bias and fewer exons. All of these differences are statistically significant (Table 5). Likewise, the number of paralogs is lower in the orphan sample. If two samples are compared, not taking into account the number of paralogs per gene (Table 6), the difference is significant but not large. Interestingly, when the number of paralogs for each gene is included, non-orphan genes have on average more than four times more paralogs (NORPHAN = 2.7 ± 0.6; NNON-ORPHAN = 12.3
± 1.3; P = 0.006, Mann-Whitney U test).
Table 5. Statistical comparisons between orphan and non-orphan cDNAs.
Orphans Non-orphans
No. 106 586
Mean ± 1SE Mean ± 1SE t test P
aa length 224 ± 13 356 ± 14 -4.994 7.5 x 10⁻⁷ GC 0.541 ± 0.0050 0.553 ± 0.0020 -2.231 0.026 GC3 0.638 ± 0.0122 0.688 ± 0.0049 -3.950 8.6 x 10⁻⁵ ENC 47.7 ± 0.79 44.22 ± 0.35 3.872 1.2 x 10⁻⁴ Fop 0.527 ± 0.0120 0.591 ± 0.0054 -4.726 2.8 x 10⁻⁶ Exon number 2.5 ± 0.16 3.5 ± 0.09 -5.545 1.2 x 10⁻⁷
Mean and standard errors of the mean are given. Significance of differences were tested using Student’s t. Values are derived from the full length D. melanogaster homologues of the D. yakuba cDNAs. GC is general GC content, GC3 is GC content at third codon positions. ENC (effective number of codons) and Fop (frequency of optimal codons) are measures of codon usage bias.
Table 6. Genes with paralogues in the orphan and non-orphan sample
Genes Paralogues
0 ≥1
Orphan 62 (57.9%) 45 (42.1%)
Non-orphan 313 (46.9%) 354 (53.1%)
Difference is significant (P = 0.032, 2-sided, Fischer’s exact test). Numbers in parenthesis represent percent of genes in the respective class. The analyzed sample consists of D. melanogaster genes, which are homologues to the non-redundant cDNAs recovered from D. yakuba. Each gene was compared by BLASTP against the complete D. melanogaster coding sequence (FlyBase Release 2). If a gene had at least one BLASTP hit with an E-value
<10-10 it was considered to have a paralogue in the D. melanogaster genome.
4.3 Substitution rates of the expressed genes in D. yakuba 4.3.1 Substitution rates of orphan and non-orphan genes
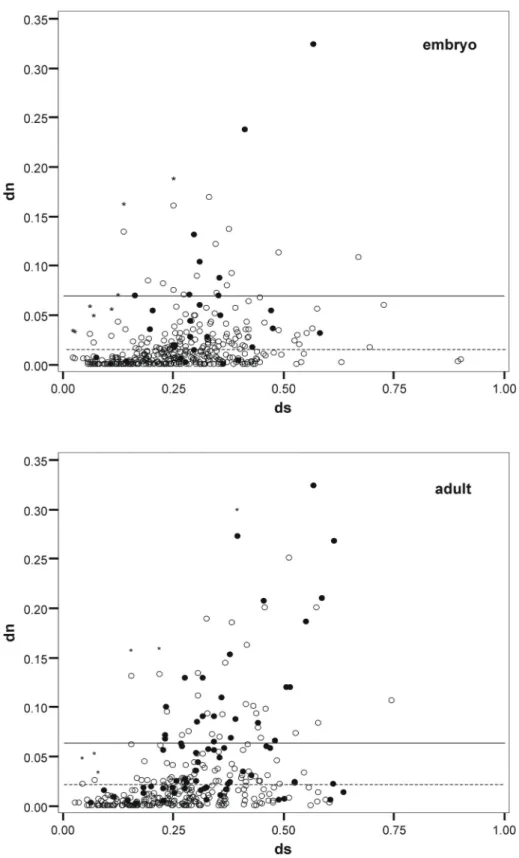
Substitution rates at coding (dN) and non-coding (dS) positions were determined for embryo (381) and adult (356) D. yakuba cDNAs aligned to the corresponding D. melanogaster genes. In this data set, 71 cDNAs were present in both libraries. Removing the respective shorter cDNA from these duplicate pairs yielded a non-redundant set of 659 cDNAs. None of the genes has a dN/dS ratio larger than one, which would be indicative of fast evolution due to positive selection.
For 18 non-redundant genes (2 orphans and 16 non-orphans) it was not possible to reject the hypothesis that their rate is significantly different from one (Figure 2).
However, many of these genes showed only a small total number of substitutions (Appendix Table 20).
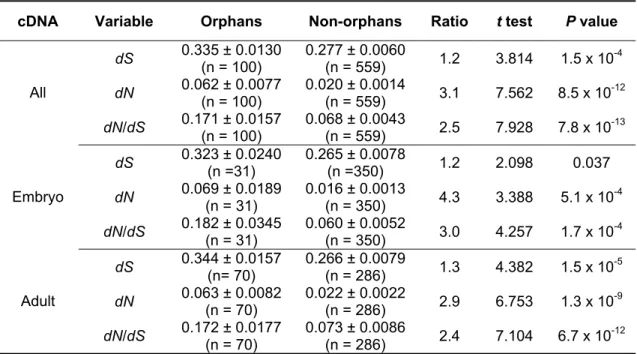
Table 7 summarizes the rate comparisons. As a class, orphan genes have a more than three times higher non-synonymous substitution rate compared to non- orphan genes (dN ORPHAN = 0.062 versus dN NON-ORPHAN = 0.020). When the adult and embryo transcripts are compared separately, orphan genes from the embryo library are evolving more than four times faster compared to non-orphans, while adult orphan genes almost three times faster (Table 7). A similar trend but with a lower proportion is seen for the synonymous substitution rates (dS ORPHAN = 0.335 versus dS NON-ORPHAN = 0.277) in the complete sample, and when embryo and adult transcripts are considered separately (Table 7).
Several studies reported positive correlation between dN and dS in different organisms including Drosophila (Duret and Mouchiroud, 2000; Comeron and Kreitman, 1998; Dunn et al., 2001). In this study, significant correlation between dN and dS is also detected for the complete sample (r ALL GENES = 0.443, P = 3.5 x 10⁻²²), and in both subclasses (r ORPHAN = 0.487, P = 2.4 x 10⁻⁷; r NON-ORPHAN = 0.408, P = 5.2 x 10⁻²²). Therefore, this correlation may at least partially account for the increased dS rates of orphans. In mammals neighbouring effects like double mutation at adjacent sites were proposed to explain this correlation (Duret and Mouchiroud, 2000). In Drosophila it is suggested that relaxed constraint exists on both kinds of substitutions in a particular codon (Comeron and Kreitman, 1998).
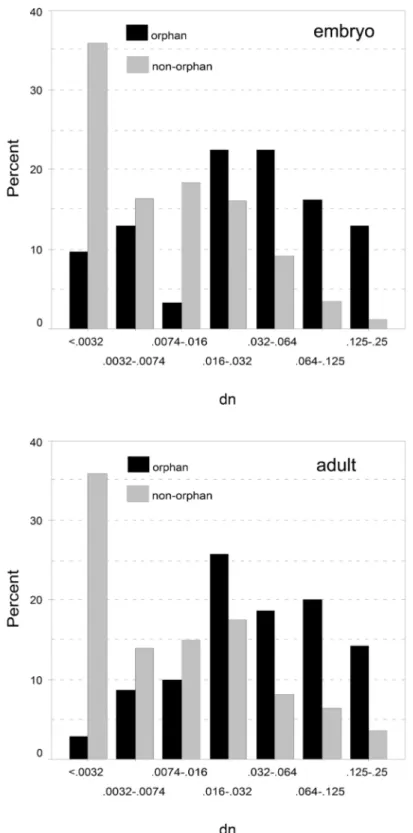
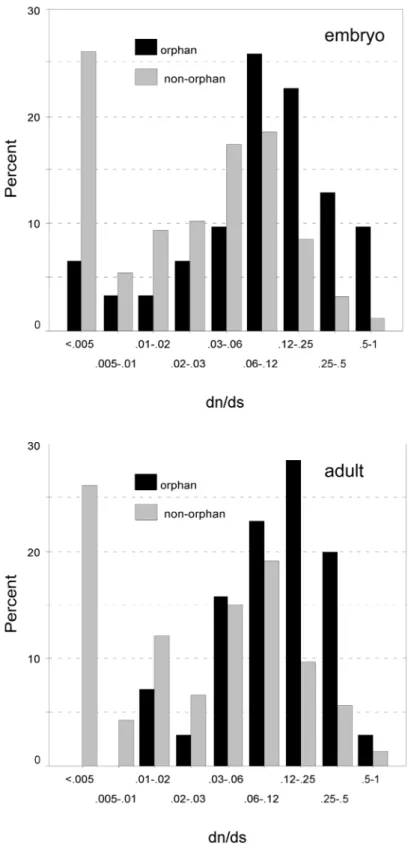
Although dN and dS are correlated, the dN/dS ratio of orphan genes is on average 2.5 times higher than of non-orphan genes (Table 7), indicating that orphan proteins are less constrained by purifying selection. Taken together these results rule out the null-hypothesis that orphan and non-orphan genes have equal rates of evolution. Although orphan genes evolve on average significantly faster than non- orphan genes, there is nonetheless a broad distribution of different rates for both classes of genes (Figure 3 and Figure 4). Intriguingly, sequences with very low divergence rates (dN < 0.0032, dN/dS < 0.02) were found in the orphan gene class, which is in the range of highly conserved non-orphan genes. Thus, orphan genes are not necessarily all fast evolving genes.
Table 7. Substitution rate comparisons between orphan and non-orphan cDNAs
cDNA Variable Orphans Non-orphans Ratio t test P value dS 0.335 ± 0.0130
(n = 100) 0.277 ± 0.0060
(n = 559) 1.2 3.814 1.5 x 10⁻⁴ dN 0.062 ± 0.0077
(n = 100) 0.020 ± 0.0014
(n = 559) 3.1 7.562 8.5 x 10⁻¹² All
dN/dS 0.171 ± 0.0157 (n = 100)
0.068 ± 0.0043
(n = 559) 2.5 7.928 7.8 x 10⁻¹³ dS 0.323 ± 0.0240
(n =31) 0.265 ± 0.0078
(n =350) 1.2 2.098 0.037 dN 0.069 ± 0.0189
(n = 31) 0.016 ± 0.0013
(n = 350) 4.3 3.388 5.1 x 10⁻⁴ Embryo
dN/dS 0.182 ± 0.0345
(n = 31) 0.060 ± 0.0052
(n = 350) 3.0 4.257 1.7 x 10⁻⁴ dS 0.344 ± 0.0157
(n= 70) 0.266 ± 0.0079
(n = 286) 1.3 4.382 1.5 x 10⁻⁵ dN 0.063 ± 0.0082
(n = 70) 0.022 ± 0.0022
(n = 286) 2.9 6.753 1.3 x 10⁻⁹ Adult
dN/dS 0.172 ± 0.0177
(n = 70) 0.073 ± 0.0086
(n = 286) 2.4 7.104 6.7 x 10⁻¹² Mean and standard errors of the mean are given. Significance of differences was tested using Student’s t.
Figure 2. Scatter plot of the nucleotide substitution rates at synonymous (dS) and non- synonymous (dN) sites for the embryo (above) and the adult library (below). Orphan genes are represented as filled circles and non-orphan genes as open circles. The mean of the dN´s for the orphan genes is marked as solid line and for non-orphan genes as dashed line. Genes for which the null hypothesis that dS and dN are equal can not be rejected are marked with a star.
Figure 3. Discrete distribution of non-synonymous substitutions (dN) for the embryo (above) and the adult (below) library. The percentages of genes falling into the respective dN value classes are represented by black (orphans) and gray (non-orphans) columns. Note the logarithmic scale for representing the dN value classes.
Figure 4. Discrete distribution of dN/dS ratios for the embryo (above) and the adult (below) library. The percentages of genes falling into the respective dN/dS value classes are represented by black (orphans) and gray (non-orphans) columns. Note the logarithmic scale for representing the dN/dS ratio classes.
4.3.2 Substitution rates of embryo and adult transcripts
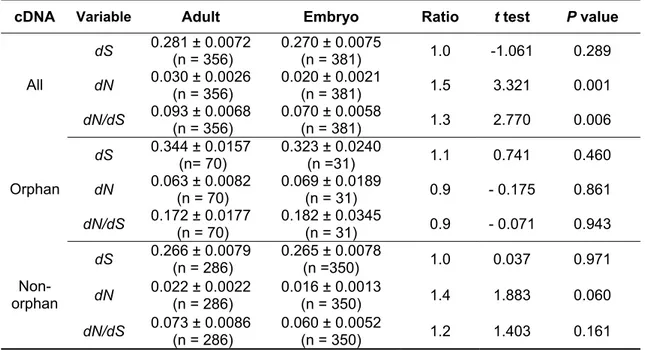
The proportion of orphan genes is higher among adult transcripts (see section 3.2.1) and therefore it is interesting to analyse how this difference may influence substitution rates between adults and embryos. There are fewer highly conserved orphan genes in the adult library than in the embryo library (Figure 4), but the average non-synonymous substitution rate, synonymous substitution rate and dN/dS ratio are nonetheless not significantly different for the orphan genes in both libraries (Table 8). The same is true for the non-orphan genes (Table 8). Thus, the fact that the average dN and dN/dS ratios are higher among the cDNAs recovered from the adult library (dN ADULT = 0.030 versus dN EMBRYO = 0.020; dN/dS ADULT = 0.093 versus dN/dS EMBRYO = 0.070) is apparently solely due to the fact that there are more orphan genes among adult transcripts.
Table 8. Substitution rate comparisons between cDNAs from the adult and embryo library cDNA Variable Adult Embryo Ratio t test P value
dS 0.281 ± 0.0072
(n = 356) 0.270 ± 0.0075
(n = 381) 1.0 -1.061 0.289 dN 0.030 ± 0.0026
(n = 356) 0.020 ± 0.0021
(n = 381) 1.5 3.321 0.001 All
dN/dS 0.093 ± 0.0068
(n = 356) 0.070 ± 0.0058
(n = 381) 1.3 2.770 0.006
dS 0.344 ± 0.0157 (n= 70)
0.323 ± 0.0240
(n =31) 1.1 0.741 0.460
dN 0.063 ± 0.0082
(n = 70) 0.069 ± 0.0189
(n = 31) 0.9 - 0.175 0.861 Orphan
dN/dS 0.172 ± 0.0177 (n = 70)
0.182 ± 0.0345
(n = 31) 0.9 - 0.071 0.943 dS 0.266 ± 0.0079
(n = 286) 0.265 ± 0.0078
(n =350) 1.0 0.037 0.971
dN 0.022 ± 0.0022
(n = 286) 0.016 ± 0.0013
(n = 350) 1.4 1.883 0.060
Non- orphan
dN/dS 0.073 ± 0.0086
(n = 286) 0.060 ± 0.0052
(n = 350) 1.2 1.403 0.161
Mean and standard errors of the mean are given. Significance of differences was tested using Student’s t. The 81 clones that were found in both libraries were excluded from the comparisons.
4.3.3 Substitution rates and genetically studied genes
If one assumes that slow evolving genes have important and more general functions, than the probability of recovery of these genes by classical functional genetic methods would be higher than for the fast evolving genes. This would hold under the assumption that the dispensability of genes is correlated with the rate of protein evolution. A recent study showed that this is indeed the case in bacteria (Jordan et al., 2002b; Jordan et al., 2002a), but for eukaryotic organisms the situation is not completely clear (Hurst and Smith, 1999; Hirsh and Fraser, 2001; Jordan et al., 2002a). As was mentioned before, in Drosophila one can take the fact that a gene has been named as an approximate indicator that an observable phenotype exists for it (section 4.1.2). Thus, evolutionary rates calculated for the genes recovered in this study give an opportunity to test hypothesis that a clear phenotype is correlated with evolutionary rate. This analysis can be done for all genes or just specifically for orphans and non-orphans.
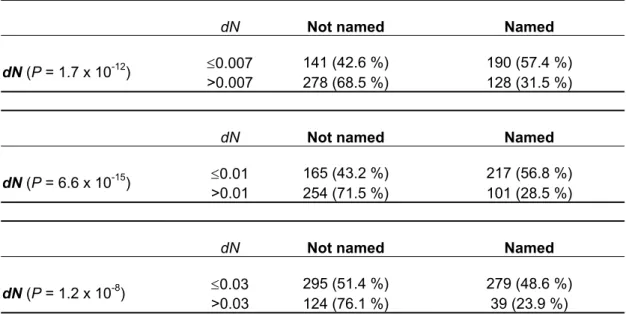
The analysis of non-synonymous substitution rates and of dN/dS ratio for the complete sample shows that there is a significant difference in the proportion of named genes (genetically studied genes) between the slow and fast evolving group irrespective of the threshold used (Table 9 and Table 10). The same holds when non- orphan genes are considered separately (Table 11 and Table 12). On the other hand, the pattern is opposite for the orphan genes, namely the proportion of named genes is not significantly different for slow and fast evolving orphan genes for all thresholds.
Similarly, there is significant rank correlation between naming and evolutionary rate for the complete (dN: rs = -0.293, P << 0.001; dN/dS: rs = -0.248, P << 0.001) and the non-orphan sample (dN: rs = -0.255, P << 0.001; dN/dS: rs = -0.206, P << 0.001), but not for the orphan genes (dS: rs = -0.055, P = 0.56; dN/dS: rs = -0.039, P = 0.7).
Taking into account that orphans are also under-represented among genetically studied genes, this suggests that most of them have less obvious phenotypes, even if some of them have rather low evolutionary rates.
Table 9. Number and proportion of named genes for different levels of non-synonymous substitution rate (dN) in the complete sample
dN Not named Named
≤0.007 141 (42.6 %) 190 (57.4 %) dN (P = 1.7 x 10⁻¹²)
>0.007 278 (68.5 %) 128 (31.5 %)
dN Not named Named
≤0.01 165 (43.2 %) 217 (56.8 %) dN (P = 6.6 x 10⁻¹⁵)
>0.01 254 (71.5 %) 101 (28.5 %)
dN Not named Named
≤0.03 295 (51.4 %) 279 (48.6 %) dN (P = 1.2 x 10⁻⁸)
>0.03 124 (76.1 %) 39 (23.9 %) Differences were tested using two-sided Fisher’s exact test.
Table 10. Number and proportion of named genes for different levels of selective constraint (dN/dS) in the complete sample
dN/dS Not named Named
≤0.03 151 (45.3 %) 182 (54.7 %) dN/dS (P = 1.2 x 10⁻⁸)
>0.03 268 (66.3 %) 136 (33.7 %)
dN/dS Not named Named
≤0.06 216 (48.0 %) 234 (52.0 %) dN/dS (P = 9.5 x 10⁻¹⁰)
>0.06 203 (70.7 %) 84 (29.3 %)
dN/dS Not named Named
≤0.1 295 (52.3 %) 269 (47.7 %) dN/dS (P = 6.8 x 10⁻⁶)
>0.1 124 (71.7 %) 49 (28.3 %) Differences were tested using two-sided Fisher’s exact test.
Table 11. Number and proportion of named genes for different levels of selective constraint (dN/dS) in the orphan and non-orphan sample
Genes
dN/dS Not named Named
≤0.03 9 (69.2 %) 4 (30.8 %) Orphan (P = 0.241)
>0.03 74 (84.1 %) 14 (15.9 %)
≤0.03 142 (44.4 %) 178 (55.6 %) Non-orphan (P = 1.7 x 10⁻⁷)
>0.03 194 (61.4 %) 122 (38.6 %) Genes
dN/dS Not named Named
≤0.06 20 (74.1 %) 7 (25.9 %) Orphan (P = 0.242) >0.06 63 (85.1 %) 11 (14.9 %)
≤0.06 142 (46.3 %) 178 (53.7 %) Non-orphan (P = 3.6 x 10⁻⁶)
>0.06 194 (65.7 %) 122 (34.3 %) Genes
dN/dS Not named Named
≤0.1 39 (81.3 %) 9 (18.8 %) Orphan (P = 1) >0.1 44 (83.0 %) 9 (17.0 %)
≤0.1 256 (49.6 %) 260 (50.4 %) Non-orphan (P = 0.001)
>0.1 80 (66.7 %) 40 (33.3 %) Differences were tested using two-sided Fisher’s exact test.