IHS Economics Series Working Paper 287
June 2012
Market Structure and Market Performance in E-Commerce
Franz Hackl Michael E. Kummer Rudolf Winter-Ebmer Christine Zulehner
Impressum Author(s):
Franz Hackl, Michael E. Kummer, Rudolf Winter-Ebmer, Christine Zulehner Title:
Market Structure and Market Performance in E-Commerce ISSN: Unspecified
2012 Institut für Höhere Studien - Institute for Advanced Studies (IHS) Josefstädter Straße 39, A-1080 Wien
E-Mail: o ce@ihs.ac.atffi Web: ww w .ihs.ac. a t
All IHS Working Papers are available online: http://irihs. ihs. ac.at/view/ihs_series/
This paper is available for download without charge at:
https://irihs.ihs.ac.at/id/eprint/2134/
Market Structure and Market Performance in E-Commerce
Franz Hackl, Michael E. Kummer, Rudolf Winter-Ebmer, Christine Zulehner
287 Reihe Ökonomie Economics Series
287 Reihe Ökonomie Economics Series
Market Structure and Market Performance in E-Commerce
Franz Hackl, Michael E. Kummer, Rudolf Winter-Ebmer, Christine Zulehner Juni 2012
Contact:
Franz Hackl
Department of Economics University of Linz Altenberger Str. 69 4040 Linz-Auhof, Austria email: franz.hackl@jku.at
Michael E. Kummer – Corresponding Author Department of Economics
University of Mannheim and ZEW, L7, 1
68131 Mannheim, Germany email: Kummer@zew.de Rudolf Winter-Ebmer Department of Economics Johannes Kepler University Altenberger Str. 69 A-4040 Linz-Auhof, Austria email: rudolf.winterebmer@jku.at and
Institute for Advanced Studies, Vienna Christine Zulehner
Department of Economics University of Linz Altenberger Str. 69 4040 Linz-Auhof, Austria email: christine.zulehner(at)jku.at and
WIFO, Vienna
Founded in 1963 by two prominent Austrians living in exile – the sociologist Paul F. Lazarsfeld and the economist Oskar Morgenstern – with the financial support from the Ford Foundation, the Austrian Federal Ministry of Education and the City of Vienna, the Institute for Advanced Studies (IHS) is the first institution for postgraduate education and research in economics and the social sciences in Austria. The Economics Series presents research done at the Department of Economics and Finance and aims to share “work in progress” in a timely way before formal publication. As usual, authors bear full responsibility for the content of their contributions.
Das Institut für Höhere Studien (IHS) wurde im Jahr 1963 von zwei prominenten Exilösterreichern – dem Soziologen Paul F. Lazarsfeld und dem Ökonomen Oskar Morgenstern – mit Hilfe der Ford- Stiftung, des Österreichischen Bundesministeriums für Unterricht und der Stadt Wien gegründet und ist somit die erste nachuniversitäre Lehr- und Forschungsstätte für die Sozial- und Wirtschafts- wissenschaften in Österreich. Die Reihe Ökonomie bietet Einblick in die Forschungsarbeit der Abteilung für Ökonomie und Finanzwirtschaft und verfolgt das Ziel, abteilungsinterne Diskussionsbeiträge einer breiteren fachinternen Öffentlichkeit zugänglich zu machen. Die inhaltliche Verantwortung für die veröffentlichten Beiträge liegt bei den Autoren und Autorinnen.
Abstract
We investigate the causal effect of market structure on market performance in the consumer electronics. We combine data from Austria’s largest online site for price comparisons with retail data on wholesale prices provided by a major hardware producer for consumer electronics. We observe input prices of firms, and all their moves in the entry and the pricing game over the whole product lifecycle. Using this information for 70 digital cameras, we generate instrumental variables for the number of firms in the market based on the shops’
entry decisions on other product markets in the past. We find that instrumenting is particularly important for estimating the effect of competition on the markup of the price leader.
Keywords
Retailing, product lifecycle, market structure, market performance, markup, price dispersion
JEL Classification
L11, L13, L81, D43
Comments
We thank Irene Bertschek, Sara Ellison, Avi Goldfarb, Gautam Gowrisankaran, Michelle Haynes, Jose Luis Moraga-Gonzalez, Ariel Pakes, Martin Peitz, Philipp Schmidt-Dengler and the participants of the SEEK 2010 Workshop on online markets for valuable comments. This project was supported by the SEEK research program (ZEW). We are indebted to geizhals.at and a producer of consumer electronics for providing the data. Andreas Lumesberger and Sergiy Golovin provided invaluable
Contents
1 Introduction 1
2 Theoretical Predictions 3
3 Data and Empirical Strategy 5
4 Results 12
4.1 Market Structure and Market Performance ... 12 4.2 Lifecycle Effects ... 16 4.3 Robustness ... 17
5 Conclusions 19
References 21
Tables 1-12 25
Figure 1-4 37
1 Introduction
Analyzing the link between market structure and market performance is of central im- portance in the field of industrial organization. In particular, antitrust and regulatory authorities are seeking to determine the number of firms required to sustain competition in a market. For example, the expected relation between the number of firms in the market and market outcomes such as prices or markups is at the core of merger assessments.
Economic theory predicts that market structure affects prices. Under reasonably gen- eral conditions, the consequence of an increase in the number of market participants is lower prices. Experimental evidence of this relation goes back to Selten (1973), who coined the statement, “four are few and six are many.” However, the empirical assessment of this relation is not an easy task, as prices and market structure are endogenous: firms may enter in response to perceived profit opportunities or may exit in response to realized losses.
Because of the difficulties in finding convincing instruments to account for endogeneity, structural models of market structure, entry, and exit have been developed. These models allow the estimation of unobservable economic quantities that could not be recovered using descriptive models (Berry and Reiss (2007)). One of the pioneering studies on entry into local markets by Bresnahan and Reiss (1991) shows that the first two or three entrants have the largest impact on market price, and that later entrants do not significantly reduce market price any further.
In a recent survey, M. (2012) emphasizes the focus on the underlying factors that determine market structure and performance. Market structure may adapt only slowly to long-run equilibrium levels and many entering firms may be atypical fringe firms unable to influence market structure at the core. While this accurately describes well-established markets with market leaders and high advertising requirements, market structure in e- commerce is different: because of the cheap and easy establishment of online shops, many
such shops operate only online, without a brick-and-mortar store or physical storehouse.
Entry and exit of these firms is therefore very prevalent.
In this paper, we use an instrumental variables strategy to investigate the impact of the number of firms on markups and price dispersion in e-commerce using data from an Austrian online price-comparison site (price search engine) for digital cameras. Products are only listed for a short time, which allows us to observe products over their full market product lifecycle from birth to death. This is important for two reasons: i) entry in such a market is particularly easy because an existing firm has to decide whether to list a new camera or not. This makes the number of firms extremely volatile. ii) Several researchers have claimed that competition or the absence thereof is particularly important at the beginning of a product lifecycle,1 while later on, competition may matter less. Therefore, as our second main focus we concentrate on the impact of the number of firms across the full product lifecycle, which has not been shown before.
Previous studies in e-commerce, such as Brynjolfsson and Smith (2000), Baye et al.
(2009), Baye et al. (2003), and Haynes and Thompson (2008b), do not take the endogeneity of the number of sellers into account.2 Baye et al. (2003) and Baye et al. (2004) look at price dispersion using various metrics. Haynes and Thompson (2008b) use data on 400 digital cameras in the US and favor the model of Carlson and McAfee (1983): with more firms in the market prices go down and dispersion increases. Haynes and Thompson (2008a) take a first step to explain entry and exit behavior in a shopbot. To do so, they estimate an error-correction model and show that entry into and exit from a market are correlated with a measure of lagged price-cost margins and the number of competitors. Ellison and
1Examples include Berry (1992), Campbell and Hopenhayn (2005), Carlton (1983), Davis (2006), Dunne, Roberts and Samuelson (1988), Geroski (1989), Mazzeo (2002), Seim (2006), and Toivanen and Waterson (2000, 2005).
2Barron et al. (2004), using data from gasoline retail markets, discuss the predictions of four different models that analyze the relationship of markups and price dispersion and the number of firms. They find that both markups and price dispersion decrease as the number of firms increases and interpret this as evidence in favor of models of monopolistic competition.
Ellison (2005) and Ellison and Ellison (2009) examine the competition of Internet retailers and identify different Internet-specific firm strategies that are applied in online markets to cope with the increased price sensitivity.
There is hardly any literature investigating the market structure along the life cycle of a consumer product. Barron et al. (2004) mention the lifecycle, but use it only as a control variable. In the marketing literature, Moe and Yang (2009) analyze the product lifecycle in e-tailing. However, their data did not allow them to consider the endogeneity of entry and exit.
For e-commerce in Austria, we find a highly significant and strong effect of the number of firms on markups. Ten additional competitors in the market reduce median markups by 0.22 percentage points and the minimum markup by 0.57 percentage points. However, accounting for the potential endogeneity of markups and the number of firms in the market, we see a substantially higher negative effect: ten additional retailers reduce the markup of the median firm by 0.85 percentage points and the markup of the cheapest firm by 1.72 percentage points. We also find that having one more firm in the market reduces the markup of the price leader by the same amount as the competition between existing firms in a period of three additional weeks in the product lifecycle.
The remainder of the paper is organized as follows. We present the theoretical predic- tions derived in the literature in Section 2 and describe the data as well as the empirical strategy in Section 3. We discuss our estimation results in Section 4 and conclude in Section 5.
2 Theoretical Predictions
Baye and Morgan (2001) theoretically investigate the market for information gatekeepers.
They analyze the behavior of firms listed on a price-comparison site as well as the behavior
of the monopolistic shopbot. Shops, which have a local monopoly in their town, have to choose between serving only the uninformed population of their own town or advertising on the price-comparison site to potentially serve informed customers in all other towns as well. Consumers, on the other hand, have the option to subscribe to the price-information site or to remain uninformed. In the first case, they can choose from among all shops, but in the latter they can only buy locally.
Given the site’s behavior and the share of consumers using the site, the model predicts that the shops will randomize over prices in the price setting equilibrium. They do so in order to maintain positive markups without being undercut by their opponents with certainty. Thus, they generate price dispersion in the market for this homogenous product.
The impact of more competition on the platform is not explicitly analyzed in the model.
Yet it is relatively easy to see that the minimum price (the lower bound of the support of the price distribution in their model) is decreasing in the number of firms, whereas the range of the distribution (price dispersion) increases with an increasing number of firms.
As earlier studies have argued, models allowing for price dispersion in a homogenous market have been classified into three groups:3 i) First, search-theoretic models (Varian (1980), Rosenthal (1980)), which evoke price dispersion by introducing heterogeneity in the search costs of consumers. Baye and Morgan (2001) is an example that directly con- siders e-commerce. ii) Models of monopolistic competition (Perloff and Salop, 1985) can account for price dispersion when extended by introducing asymmetries across firms, such as heterogeneous producer cost or heterogeneous producer demand (Barron et al., 2004).
iii) Carlson and McAfee (1983) present a search-theoretic model that accommodates two sources of heterogeneity by assuming a non-degenerate distribution of producers’ marginal cost and heterogeneous visiting cost of consumers. Finally, a simple structure-conduct- performance model (Bain, 1951) must also be considered.
3See, for example, Barron et al. (2004) or Haynes and Thompson (2008b).
The first group of search-theoretic models (Varian, 1980) predicts that an increased number of sellers results in a larger price dispersion and – somewhat counter-intuitively – a higher average price. The second group of models with differentiated sellers and production cost or buyer cost asymmetries would predict that a larger number of sellers is associated with a lower average price and smaller price dispersion. Thirdly, the model by Carlson and McAfee (1983) predicts that average prices would go down while price dispersion is expected to rise. According to a structure-conduct-performance model where the incumbents face the threat of entry, prices should decrease or stay the same when more firms enter the market, depending on the strength of the entry threat. The model does not make any predictions about price dispersion.
3 Data and Empirical Strategy
Price search engine: In our analysis we use data from the largest Austrian price comparison site, www.geizhals.at. At the time of our analysis Geizhals.at listed on average price offers from 1,200 firms for 200,000 products. Recently, Geizhals has expanded to other European countries, including Germany, Poland, and the United Kingdom.4 This recent internationalization leads to a substantial expansion of products and supplying retailers.
At present, the website offers more than 723,000 products with 64 million price quotes that can could be actualized by the retailers several times per day. In January 2012, Geizhals registered 3.1 million “unique clients.”5
The business model of Geizhals is as follows: the retailers have to pay a fixed fee for each referral request of a customer to the respective e-shop.6 If the retailer agrees to
4See Geizhals.de, Skinflint.co.uk, Cenowarka.pl.
5The number of unique clients is calculated from the number of different terminal devices (PCs, PDAs, etc.) used to access a website (in our case, the Geizhals websites). A unique client can be used by more than one person. An individual can have access to more than one unique client.
6A referral request is a click by the customer on the link of an online shop at Geizhals.at. After the
embed the Geizhals logo and link on its website, a reduced fee is paid. If the total of these click-dependent fees does not exceed a certain limit, the online store has to pay a flat fee. The electronic retailers can list as many products they want and can change the prices as often they want, free of charge. There is also no cost if retailers decide to suspend a certain price quote temporarily. Hence, apart from a relatively small flat rate and the click-dependent fee retailers are not confronted with entry or exit costs in the different product markets.7 By this construction, Geizhals has the incentive to increase its profits by permanently extending the number of retailers. However, at least in Austria, Geizhals has already acquired such a strong reputation among customers that online stores cannot afford not to be listed at geizhals.at as the market is dominated by this price search engine.
Hence, it seems reasonable to assume that our data for Geizhals.at will cover the whole electronic retailing market.
Available data: For the study in this paper, we usedaily data on 70 items (mainly digital cameras) from a major hardware manufacturer,8 which were listed during the period from January 2007 through December 2008.9 We define a camera’s birth by its appearance on Geizhals.at. The cameras were offered by up to 212 sellers from Austria and Germany.
For time t(measured in days), we observe for each producti and retailerj thepriceijt, the shipping costijtposted at the website,10 and theavailabilityijt of the product.11 Addi- tionally, we observe the customers’ referral requests (clicksijt) from the Geizhals.at website
click, the online shop of the retailer opens in a new browser window.
7Of the 1,200 retailers at the time of our analysis, only a very small number of retailers have other contracts with Geizhals.at, e.g., they pay only for products actually sold.
8The hardware manufacturer is a multinational corporation specializing in manufacturing electronic equipment in several areas. The manufacturer asked to keep its name anonymous.
9For our instrumentation strategy, we use also the product lifecycle of cameras entering the market starting from May 2006.
10Shipping cost is the only variable that has to be parsed from a text field. We use the information on “cash in advance for shipping to Germany,” which is the type of shipping cost most widely quoted by the shops. Missing shipping costs are imputed with the mean shipping cost by the other retailers and controlled for with a dummy for imputed values.
11If the product is available immediately or at short notice, the dummy is 1; if the product is available within 2-4 days, it is 0.
to the retailers’ e-commerce website as a proxy for consumer demand.12 Customers have the option to evaluate the (service) quality of the firms on a five-point scale, the average of which is listed together with the price information on Geizhals.at. Wholesale prices for each product i at time t were obtained from the Austrian representative of the interna- tional manufacturer. We do not claim that these wholesale prices correspond perfectly to the retailers’ marginal cost. Even though the manufacturer’s distribution policy indicates that the retailers should be served by the local representative, it may happen that single retailers procure commodities from, for instance, the Asian market. Moreover, the local representative might offer special promotions including lower wholesale prices in excep- tional cases, e.g. if a retailer commits to promoting the manufacturer’s good in a special way. Finally, it must be mentioned that the retailers in e-commerce might have additional costs each time they order in addition to the wholesale price. Despite these qualifications, we still believe that our measures are a very good proxy for the actual marginal cost of the retailers.13 Priceijt and wholesale priceit were used to calculate the firms’ markupijt according to the Lerner index and the markets’ price dispersionit.
Organization of data: We reorganized the data in such a way that the product lifecycles of all digicams start at the same day 1. Hence, we have shifted the product lifecycles of the digicams so that we can analyze the impact of market structure on markup and price dispersion in a cross section of 70 product lifecycles. This reorganization of data is also im- portant to guarantee that observations are iid. The independence assumption is especially crucial, as the listing decisions of e-commerce traders are strategic variables: if we studied product cycles in real time the decision to list digicam X might be related to the listing decision of the follower model Y. By shifting the product lifecycles to identical starting
12See Dulleck et al. (2011) for a description of the data.
13According to the Austrian distributor the Austrian and German lists of wholesale prices are almost identical. Note the manufacturer’s incentive to keep cross-border sales between distributors and retailers as low as possible - an argument which supports the reliability of our wholesale prices as indicator for marginal cost.
points the iid assumption concerning our data structure is valid. We define the end of a product life cycle as the point when the number of referral requests diminishes to less than 500 clicks. Thus, we use a daily unbalanced panel with information on the products’ age, the number of firms, average markups, the markup of the price leader, different measures for price-dispersion, and the number of clicks.
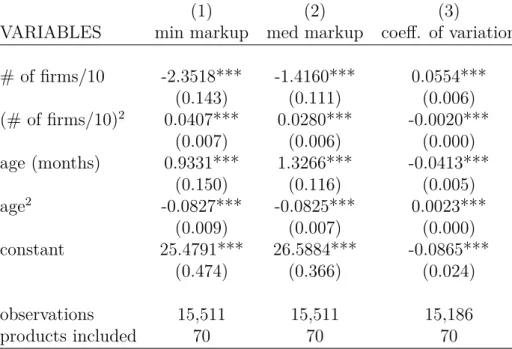
Descriptives: Table 1 contains summary statistics of the data. Each observation in the descriptives refer to a single productiat a given daytin the product lifecycle. We will use the markup (Lerner index) and the price dispersion as endogenous variables. Whereas the median markup amounts to 17.8% on average, the mean markup for price leaders is only 4.6%. These numbers are of comparable size to those in Ellison and Snyder (2011), who report an average markup of 4% for memory modules on Pricewatch.com. We use different measures for price dispersion: the coefficient of variation and the standard deviation of the distribution of prices, as well as the absolute price gap between the price leader and the second cheapest price. On average, a product lifecycle amounts to 167 days with a mean of 104 firms offering the digicams.
Figure 2 shows that the estimated markup declines with age, and, more importantly, as the number of firms increases. The decline in markups with the number of firms is a rather smooth phenomenon, and not as quick as one might expect in perfectly transparent e-commerce markets. Even with 70 and more firms in the market, there is a positive markup. In the top left panel, the median markupit is scattered against the number of f irmsit in the corresponding market; the top right panel shows the average pattern. The number of firms ranges from 0 to more than 200 and the median markup ranges from 0 to 35%.
There are also some negative markups, especially for the minimum price firms, where the average markup of the price leader is only 4.8%. In our dataset, we observe negative markups for 26.9% of all best-price offers. This is in line with Ellison and Snyder (2011),
who also report a substantial number of price offers with negative markups in the case of Pricewatch.com. Negative markups might have several possible causes: they might simply point to sellouts after overstocking, they might hint to cases where retailers are not procuring products via official retail channels, or they might indicate the use of loss leader strategies where a digicam is offered at a price below marginal cost to attract new customers or to make profits with complementary goods.
In the middle row, the median markup is plotted against the age of the product. We typically observe a camera between seven and 15 months. Again, the markets’ median markups fall with the duration of the product lifecycle. In the lower row, the number or retailers is plotted against the age of the camera: there is a steep increase in the number of listing firms at the very beginning of the lifecycle, whereas after 12 months the number of firms is declining again. This average pattern hides some heterogeneity, which can be seen on the left-hand side. Some cameras are listed only by a minority of firms, say 20 or 60, and do not stay on the market very long. The third group of cameras is listed by roughly 150 shops and stays on the market much longer.
Empirical strategy: To estimate the impact of market structure on markups and price dispersion, we estimate the following fixed-effects regression as our baseline model:
markup=αj +α1∗age+α2∗age2+β1∗numf irms+β2∗(numf irms)2+jt
This model will be estimated for the median and the minimum markup; a similar strat- egy is used for price dispersion which is measured as the coefficient of variation and other measures. Lifecycle effects are captured by a quadratic age trend. In a later specification, we use interactions between the age terms and the number of firms to capture varying
competition effects over the lifecycle of the product.14
Sources of endogeneity: In all markets, particularly in particular in an e-tailing shopbot market, it is important to treat market structure as endogenous: because of simple and low-cost market entry and exit, e-tailers can easily adapt to changing circumstances by listing a particular product. If, for example, some unobserved factor temporarily drives up markups for some item, shops that did not sell the item before might move into this market. Thus, we would expect to observe more shops in markets where higher markups can be reaped and vice versa: reverse causation. This, in turn, will result in an upward bias: an estimated OLS coefficient showing the correlation of the number of firms with markups will be less negative than the true causal parameter.
On the other hand, an OLS estimate might suffer from omitted variables bias: variables related to demand, like consumer preferences or actual sales are unobserved, but might be correlated with both prices and market structure. Again, a positive correlation between demand and market structure and simultaneous positive correlation between sales and prices will lead to an upward bias of an OLS estimate. In order to overcome both problems, we suggest an instrumentation strategy. We need an instrument that can explain market structure but which is both unrelated with demand and has no direct influence on prices.
Moreover, there might be some heterogeneity of the cameras in the market in terms of aspects as quality and design features that might be correlated with both markups and entry of firms. In our estimation, we will use product fixed effects to capture these unobserved features of the specific cameras.
Instrumentation strategy: In the Geizhals.at data, we observe the complete lifecycle of many products from the same producer: these products were launched at different points in time. We consider both of these facts. For markets with brand names, part of the listing decisions can be explained by common patterns, such as an established supply
14In all the regressions we included monthly dummies to account for seasonality effects.
relationship, that a shop might have with a producer or a wholesale importer, or variations in the availability of the product. These patterns will remain the same over time, and they are not influenced by contemporary changes in the market for a specific camera. Thus we use the timing of previous listing decisions of e-tailers for other brand products of our manufacturer as an instrument for current listing decisions. Note that the necessary exclusion restriction will hold for our instrument: the listing decision of a series of different products in the past will have no direct impact on markups for another product in the future.
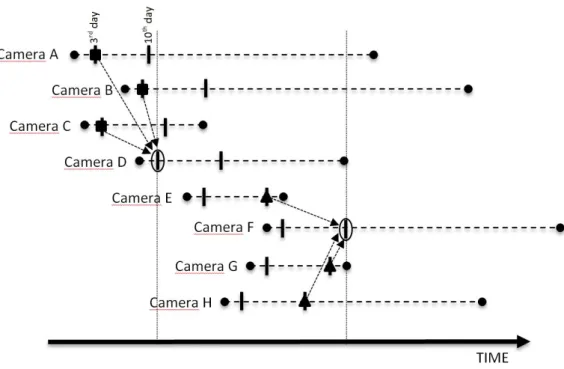
The instrumentation strategy is illustrated with an example in Figure 1. It represents an e-tailer, which we shall call an E-shop for the sake of illustration. The figure illustrates its listing decisions over time for various products: let us consider whether our E-shop will list a product D on the third day after introduction. This decision is represented by the encircled line on item D. We predict the probability of this event by the E-shop’s general probability of listing a similar item that has been on the market for three days.
Considering only the items listed before product D was introduced, we use the last three items that were introduced in the market as a whole. We then calculate how many of those items were listed by the E-shop on the third day after they appeared. Taking the share gives us an estimate of E-shop’s probability of listing product D on its third day of existence. Finally, we aggregate these probabilities across shops to obtain the predictor of the number of shops that will offer item D on a given day.
This strategy can easily be extended for each day in the product lifecycle, giving us a predicted market structure for each day of the product cycle. For the E-shop’s listing decision of product F on the tenth day, for example, we use the respective decisions on the tenth day for products E, G, and H. To guarantee the validity of the instrument, we use only products that were introduced before the introduction of the camera in question.
Note that for instrumenting F, we ignored products A through D because those cameras
lay too far in the past. When calculating the instrument, we fixed the number of cam- eras considered to calculate the instrument to a constant number of three products.15 In contrast to a constant time interval our approach of fixing a constant number of products guarantees valid standard errors that can be calculated without bootstrapping methods.
First-stage regressions: As we use the time patterns of previous listing decisions in completely different markets, our instrument should not have a direct causal implication for today’s markups and price dispersion. Moreover, the listing of a particular type of camera on a particular day in the past should have no influence on sales today. Therefore, the instrument will comply with the necessary exclusion restrictions. Table 2 presents the first stage regressions and shows that the instrument is strong enough to explain the market’s actual entry decisions, which are depicted by the number of firms at each point in the product lifecycle. Columns (1) and (2) compare the contribution of the instrument to explaining the number of firms, and columns (3) and (4) show the contribution to its quadratic term. The instruments are strongly significant and have the expected sign. The marginal R2 amounts to 0.011 up to 0.037 for the linear case with F-values well above 400.
The results for the quadratic terms are similar.
4 Results
4.1 Market Structure and Market Performance
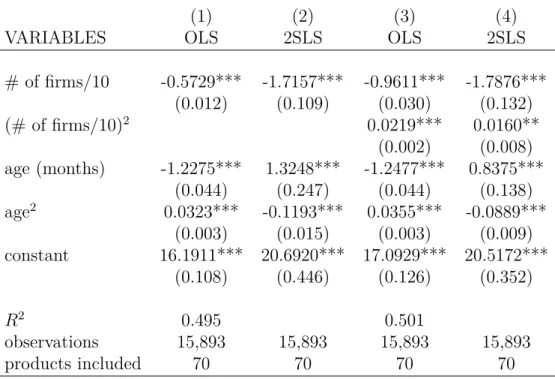
Tables 3 and 4 show our basic results for the impact of market structure on markups.
These baseline specifications are parsimonious, as they consider only the number of firms on the market – either linearly or in quadratic terms – and the product lifecycle. Moreover, to account for seasonal effects, we add an indicator variable for offers that were quoted in
15Results using the last five products as an instrument are available on request; they are very similar.
December.16 All product-specific influences are covered by a product fixed effect. Columns 1 and 3 show OLS estimations, whereas in Columns 2 and 4, our instrumental variables approach is used.
Our results indicate a highly significant and relatively strong effect of the number of firms on markups. Not accounting for the endogeneity of the number of firms and using OLS, we would estimate the effect of ten additional competitors in the market to reduce minimum markup by 0.57 percentage points and median markups by 0.22. The cheapest firm reacts significantly more strongly than the median firm, which might be explained by the high frequency with which prices are changed in online markets, where the cheapest price is a focus of considerable attention from both consumers and firms.
If we instrument for the number of firms, we see a substantially larger negative effect:
10 additional retailers reduce the markup of the cheapest firm by 1.72 percentage points and the markup of the median firm by 0.85 percentage points. These figures are large in economic terms considering the standard deviation of 57 firms in our sample. As discussed above, OLS is likely to overestimate the true effect of an additional firm on the markup, as it does not account for the fact that attractive items also attract more firms. Again, the cheapest firm reacts considerably more strongly than the median firm.
In Columns 3 and 4 we use a quadratic specification of the number of firms: it turns out that there is a solid negative but decreasing influence of the number of retailers on markup, both for the cheapest and the median firm. There is no turnaround. For the cheapest price, the negative influence of the number of firms ceases at 560, and that for the median markup with 340 firms given a maximum number of firms in our sample of 203.
Looking at the impact of the product cycle on markups, we get very interesting results:
in all 2SLS regressions, markups grow in the beginning and go down after the first few months until the end of the product lifecycle. For the minimum markup, the turning point
16The results for this variable are omitted in the tables to follow.
is between five and six months (Columns 2 and 4 of Tables 3 and 4), which is around the mean duration of a product lifecycle of 5.5 months. For the median markup, the turning point is at eight to nine months, and is slightly above the mean duration of the product lifecycle. It seems that markups tend to grow as the market grows, but decline later on, perhaps as a consequence of saturation in the market.
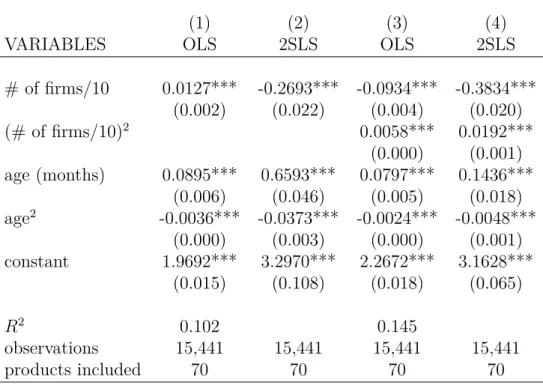
To investigate the impact of the number of sellers on price dispersion we concentrate on the coefficient of variation (Table 5). While the OLS regressions show a somewhat negative relation between the number of firms and price dispersion, in the 2SLS results (Columns 2 and 4), we see a strong positive relationship. In the linear case, increasing the number of firms by 10 increases the coefficient of variation by 0.03. For the quadratic case (Column 4) we observe increasing price dispersion up to the value of 106 firms. Note that the mean of supplying firms per product is 104. For a higher number of firms, the coefficient of variation shrinks again.
The combined results on markups and price dispersion are compatible with the model of Carlson and McAfee (1983), i.e. a search theoretic model that accommodates two sources of heterogeneities by assuming a non-degenerate distribution of producers’ marginal cost and heterogeneous visiting costs of consumers. In addition, the augmented search theoretic model by Baye and Morgan (2001), which features randomization over prices as a consequence of zero online search costs, are well in line with our findings. The other search theoretic models are, however, not in line with our findings of a decreasing median markup. Models of monopolistic competition, on the other hand, predict a decreasing price dispersion. With the exception of the quadratic case for more than 106 firms we find no empirical evidence for this type of model.
The clear purpose of the price comparison site is to facilitate price comparisons and, thus, to increase price competition. This is what we find in our results for markups: there is a strong markup-reducing effect of an increasing number of firms. Consumers have to
pay shipping costs in addition to this net price. While sellers are ranked at Geizhals.at according to net prices, prospective shipping costs are reported on the website as well. A quick and easy comparison thereof is not possible, though, because there is no automatic ranking and there are typically several ways to report shipping costs on the website, e.g.
standard shipping, shipping to Germany or Austria, and different shipping costs depending on the payment options. Given the fact that shipping costs are often used as an obfuscation strategy in such markets (Ellison and Ellison, 2009) and that these shipping costs are far more difficult to compare across firms, it is interesting to see whether shipping costs react to market pressure as well.
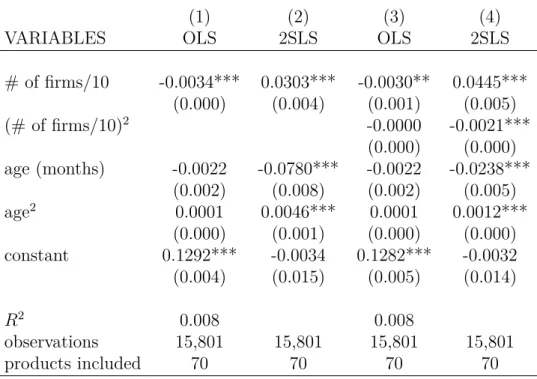
In Table 6, we report the effects of the market structure on shipping costs divided by median price to make it comparable. As there are different shipping costs possible, we concentrate on those mostly observed in the data: shipping costs to Germany when paying cash in advance. Interestingly, the patterns are largely the same as in Tables 3 and 4. While OLS predicts a positive relationship between shipping costs and the number of firms, Columns 2 and 4 reveal a robust negative relationship with a small and positive quadratic term.
It is remarkable that more competition decreases shipping costs. This market structure effect of shipping costs is economically significant, but only around one-third of the effect the number of firms has on median markups and one-sixth of the effect on minimum markups. These results confirm the visibility argument, that consumers have a much harder time comparing shipping costs than actual prices. A simple shipping cost equation not shown in the text where we estimate shipping costs in cents, shows that ten more firms actually decrease the average shipping cost in that market by seven cents, a relatively large number given the standard deviation of 57 firms.
4.2 Lifecycle Effects
In this section we investigate whether the profit-squeezing effect of a higher number of firms is the same in different phases of the product lifecycle. Several authors claim that competition might be particularly important at the beginning of the lifecycle of a product (e.g. Toivanen and Waterson (2005) and Berry (1992)); on the other hand, it could be that at the beginning of the product lifecycle pioneer consumers react less to prices and therefore a higher markup can be achieved.
To do this, we extend the model to check for different effects of market structure on markups over the product cycle. In Table 7, we expand our baseline model and add crossterms, interacting the number of firms with age (both linearly and quadratically).
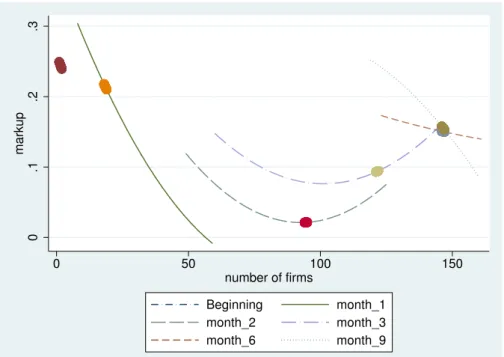
For ease of interpretation of the coefficients, in Figures 3 and 4 we plot these results for the minimum and median markup, respectively.
In these plots, each line represents a product of a certain age; we plot the curve for products right after their introduction and after 1, 2, 3, 6, and 9 months on the market.
To clarify, for each phase of the lifecycle we concentrate on the typical situation concerning the number of firms.17 Our plots show a consistent pattern, which appears to consist of three phases. In Figure 3, we observe the pattern for minimum markups. Apart from the months in the middle, we see a clear pattern: markups decline with more firms. This pattern, however, is less pronounced during months 2-4, where we observe a movement to the right, with more firms entering while markups remain stable, indicating only a small negative effect. Toward the end of the cycle (month 6 and later), competitive pressures again become more pronounced and the relationship becomes negative again.
Comparing the six curves, we can consider the development of markups over time. The
17We plot only in the region between the 33rd and 67th percentile of the distribution concerning firm sizes to avoid extrapolation of the polynomials. The dots represent the median of the empirically observed distribution of the number of firms.
median markup for each phase is indicated by a dot: at first, markups fall drastically, but then they stabilize and even recover slightly. Figure 3 shows the minimum markup which decreases below 0 within 2 months. However, after that, it remains close to 0 with more or less fierce competition, depending on the phase of the lifecycle.
For the case of median markups in Figure 4, we observe a fairly similar pattern: more firms in the market means lower median markup, particularly in the beginning and toward the end of the lifecycle, with a flatter curve in the middle. Again, there is an initial reduction of markups over the time of the lifecycle, but this trend turns around after three months and then median markups even rise slightly again.
4.3 Robustness
We perform several robustness checks. First, we test the robustness of the basic results by using varying definitions of price dispersion and by using other definitions of markups, i.e.
by including shipping costs in sales prices. Moreover, at the end, we take account of the fact that some of the price offers may attract less attention from potential buyers; we use click-weighted markups to control for this.
Our first robustness check, shown in Table 8, concerns our definition of price disper- sion. We experiment with different definitions: apart from the coefficient of variation (the benchmark case from Table 5, Column 4) we use the standard deviation of prices and a co- efficient of variation calculated in such a way that the prices are weighted with the number of clicks received. All these variations show a similar pattern: price dispersion increases with the number of firms at a decreasing rate; in all cases, the turning point is larger than the average number of firms in the sample. Interestingly, applying the click-weighting increases the turning point even further, to 175 firms.
The next robustness check, shown in Table 9, concerns the measurement of prices.
Consumers typically pay the product price plus shipping costs. In such a case, the total price including shipping costs should be used to calculate the markup of the firm. Again, we use shipping costs to Germany when paying cash in advance. Consistent with our previous results on shipping costs, our comprehensive markup model in Table 9 shows even a higher causal effect of market structure on markups: both the minimum and median markups decline significantly with the number of firms, and price dispersion is increasing.
We investigate further whether our results are influenced by the fact that we treat all product offers symmetrically in our regressions. In particular, in questions of price dispersion researchers typically mistrust the validity of price offers that are much too high (cf. Baye et al. (2004)). This suggests weighing price offers with the number of clicks they receive to give low-ranked and perhapse less reliable price offers less weight. When we do this in Table 10, our main results are reinforced.
Finally, we want to see whether our results are due to changes in the composition of the shops offering an item over the lifecycle. In particular, the presence of larger shops, cheaper, or more reliable shops or a higher presence of shops that sell not only online but also have a brick and mortar outlet might affect the outcomes. Therefore, in Tables 11 and 12, we include the composition of shops in the regression. In these tables, Column 1 shows the quadratic 2SLS estimation from Tables 3 and 4. We then add the share of firms that have the item stocked (i.e., immediately available), the share of firms with low reputation, the share of low-price firms, the share of large firms, and the share of shops with a brick and mortar facility. All of these shares are scaled on a range from 0 to 100: for example, if, in Table 11, the share of large firms increases by 10%, this is associated with a drop in median markups by 0.62 percentage points.
When we introduce these measures of market heterogeneity one by one, because they are to a large extent multicollinear, we find our general results completely unaffected. Both, minimum and median markups fall as the share of larger firms (Column 5) and the share
of firms with low reputation (Column 3) increase. The sign of the statistically significant variables are reasonable: we would expect lower markups for firms with low reputation and stronger competition in case of an increasing share of large firms in which undercutting of prices might have a larger impact. The decrease of markups is more pronounced for the size of the firms. The pattern is somewhat ambiguous for the share of low-price firms (Column 4). The presence of generally low-price shops in a market decreases the median markup, but has a positive effect on minimum markups. It seems that these generic low-price shops themselves have lower markups, decreasing the median, but they might be too small to influence the minimum price in the market downward. Finally, the share of firms that have the item in stock (Column 2) and the share of firms also having a brick-and-mortar facility (Column 6) are related to an increase in markups; again, the positive signs confirm the expected price-setting behavior.
5 Conclusions
In this paper we estimate the effect of market structure on market performance in e- commerce. As endogeneity of market structure and market performance is an important issue, particularly in e-commerce, we correct for this problem using an instrumental vari- able strategy based on regularities in listing behavior over past product lifecycles. We use data for 70 different digital cameras and find that an increase in the number of sellers in a market by 10 reduces the markup of the price leader by 1.72 percentage points and that of the median firm by 0.85 percentage points. Comparisons with simple OLS estimations show that instrumenting is, in fact, very important; the markup-reducing effects of com- petition would be estimated to be much lower. Moreover, we find a positive effect of the number of firms on the coefficient of variation of prices. This combined pattern in terms of markups and price dispersion is compatible with a search-theoretic model combining both
heterogeneities in producers’ marginal costs as well as the search costs of consumers.
Our results are also in line with the predictions of Baye and Morgan (2001) and the results of recent empirical papers by Haynes and Thompson (2008b) for the US online market for cameras and with Campbell and Hopenhayn (2005) for the US brick-and-mortar retail industry. In both cases, the competitive effects of an increasing number of firms persist in a homogenous goods market. Even with more than one hundred retailers we find that markups still decrease.
When we differentiate market structure effects over the full lifecycle of a product, we find a negative impact throughout, which is especially pronounced in the beginning and the late phases of the lifecycle. Our results refer to e-tailing in the presence of a price-search engine with very narrowly defined products. In such a situation, consumers can very easily collect information about prices and seller reliability. Still, it takes a large number of sellers and a relatively long time for firm markups to dissipate.
The markup of the price leader also diminishes over the lifecycle of the product. This allows us to compare the competitive effect of the number of firms to the effect of time:
having one more firm in the market reduces the markup of the price leader by the same amount as three additional weeks in the product lifecycle. In other words, by waiting three more weeks a consumer will get the same price reduction she would get if she went to a market with one additional firm, ceteris paribus. In reality, waiting longer will typically also increase the number of firms, thus increasing the advantage of waiting. Our results highlight the usefulness of considering this very specific market for consumer electronics, where product lifecycles are particularly short and thus can be fully observed. Thus, analyses of such environments have great potential to shed light on phenomena of markups over the product lifecycle, early adopters, and inter-temporal price discrimination.
References
Bain, J.S., “Relation of profit rate to industry concentration: American manufacturing,
1936-1940,” The Quarterly Journal of Economics, 1951, 65 (3), 293–324.
Barron, J.M., B.A. Taylor, and J.R. Umbeck, “Number of sellers, average prices, and price dispersion,” International Journal of Industrial Organization, 2004, 22 (8-9), 1041–1066.
Baye, M.R. and J. Morgan, “Information gatekeepers on the internet and the compet- itiveness of homogeneous product markets,”American Economic Review, 2001, Vol. 91, No. 3,, 454–474.
, , and P. Scholten, “The value of information in an online consumer electronics
market,”Journal of Public Policy & Marketing, 2003,22 (1), 17–25.
, , and , “Price dispersion in the small and in the large: Evidence from an internet price comparison site,” The Journal of Industrial Economics, 2004, 52(4), 463–496.
, J.R.J. Gatti, P. Kattuman, and J. Morgan, “Clicks, discontinuities, and firm
demand online,” Journal of Economics & Management Strategy, 2009,18 (4), 935–975.
Berry, S. and P. Reiss, “Empirical models of entry and market structure,” Handbook of industrial organization, 2007,3, 1845–1886.
Berry, Steven T., “Estimation of a model of entry in the airline industry,”Econometrica, 1992,60 (4), 889–905.
Bresnahan, T.F. and P.C. Reiss, “Entry and competition in concentrated markets,”
Journal of Political Economy, 1991, 99 (5), 977–1009.
Brynjolfsson, E. and M.D. Smith, “Frictionless commerce? A comparison of Internet
and conventional retailers,” Management Science, 2000, 46 (4), 563–585.
Campbell, J.R. and H.A. Hopenhayn, “Market size matters,” Journal of Industrial Economics, 2005, 53, 1–25.
Carlson, J.A. and R.P. McAfee, “Discrete equilibrium price dispersion,” The Journal of Political Economy, 1983,91 (3), 480–493.
Carlton, D.W., “The location and employment choices of new firms: An econometric model with discrete and continuous endogenous variables,” Review of Economics and Statistics, 1983, 63, 440–449.
Davis, P., “Spatial competition in retail markets: Movie theaters,” Rand Journal of Economics, 2006.
Dulleck, U., F. Hackl, B. Weiss, and R. Winter-Ebmer, “Buying online: An analysis
of shopbot visitors,” German Economic Review, 2011, 12 (4), 395–408.
Dunne, T., M.J. Roberts, and L. Samuelson, “Patterns of firm entry and exit in
U.S. manufacturing industries,”Rand Journal of Economics, 1988, 19 (4), 495–515.
Ellison, G. and S.F. Ellison, “Lessons about markets from the Internet,” Journal of Economic Perspectives, 2005,19 (2), 139–158.
and , “Search, obfuscation, and price elasticities on the internet,” Econometrica, 2009,77 (2), 427–452.
Ellison, S.F. and C.M. Snyder, “An empirical study of pricing strategies in an on- line market with high frequency price information,” MIT, Department of Economics, Working Paper 11-13, 2011.
Geroski, P.A., “The effect of entry on profit margins in the short and long run,”Annales d’Economie et de Statistique, 1989, 15-16, 333–353.
Haynes, M. and S. Thompson, “Entry and exit behavior at a shopbot: E-sellers as
Kirznerian entrepreneurs,”Unpublished Working Paper, 2008.
and , “Price, price dispersion and number of sellers at a low entry cost shopbot,”
International journal of industrial organization, 2008, 26 (2), 459–472.
M., Stephen, “Market structure and market performance,” Review of Industrial Organi- zation, 2012,40, 87–108.
Mazzeo, M.J., “Product choice and oligopoly market structure,”RAND Journal of Eco- nomics, 2002, 33 (2), 221–242.
Moe, W.W. and S. Yang, “Inertial disruption: The impact of a new competitive entrant
on online consumer search,”Journal of Marketing, 2009,73 (1), 109–121.
Perloff, J.M. and S.C. Salop, “Equilibrium with product differentiation,”The Review of Economic Studies, 1985,52 (1), 107.
Rosenthal, R.W., “A model in which an increase in the number of sellers leads to a
higher price,”Econometrica: Journal of the Econometric Society, 1980, pp. 1575–1579.
Seim, K., “An empirical model of firm entry with endogenous product-type choices,”The RAND Journal of Economics, 2006, 37(3), 619–640.
Selten, R., “A simple model of imperfect competition, where 4 are few and 6 are many,”
International Journal of Game Theory, 1973, 2(1), 141–201.
Toivanen, O. and M. Waterson, “Market structure and entry: Where’s the beef?,”
Rand Journal of Economics, 2005,36, 680–699.
Toivanen, Otto and Michael Waterson, “Empirical research on discrete choice game theory models of entry: An illustration,”European Economic Review, 2000,44, 985–992.
Varian, H.R., “A model of sales,”The American Economic Review, 1980, pp. 651–659.