Aggressive tax planning indicators
Final Report
TAXUD/2016/DE/319
FWC No. TAXUD/2015/CC/131
Institute for Advanced Studies (Project leader) Institute for Advanced Studies (Consortium leader)
In consortium with
CPB DONDENA
Preface
This report has been prepared for the project “Aggressive tax planning indicators”, Specific Contract No.5 TAXUD/2016/DE/319 implementing the Framework Service Contract No. TAXUD/2015/CC/131 for the provision of economic analysis in the area of taxation.
The following institutions and persons contributed to this project:
IHS (project leader) Simon Loretz
Richard Sellner Bianca Brandl DONDENA Giampaolo Arachi Valeria Bucci CPB
Maarten van't Riet Ali Aouragh
The information and views set out in this report are those of the author(s) and do not
necessarily reflect the official opinion of the Commission. The Commission does not
guarantee the accuracy of the data included in this study. Neither the Commission nor
any person acting on the Commission’s behalf may be held responsible for the use which
may be made of the information contained therein.
Table of contents
Preface ... 2
Table of contents ... 3
List of tables ... 5
List of figures ... 6
List of abbreviations ... 7
List of country acronyms ... 7
Executive Summary ... 8
Sommaire ... 14
1 Introduction ... 20
1.1 Background ... 20
1.2 Objectives ... 21
2 Characterising aggressive tax planning ... 22
2.1 Definition and boundaries of aggressive tax planning ... 22
2.2 Main channels and defining features of aggressive tax planning ... 23
2.2.1 Income shifting through interest payments ... 26
2.2.2 Income shifting through royalty payments ... 28
2.2.3 Strategic transfer pricing ... 31
2.3 Use of Member States’ tax rules in aggressive tax planning ... 34
2.4 Use of third countries in aggressive tax planning ... 35
3 Economic indicators for aggressive tax planning ... 36
3.1 General indicators ... 36
3.1.1 General indicators: country level ... 36
3.1.2 General indicators: MNE group-level ... 41
3.2 Specific indicators ... 44
3.2.1 Specific indicators: firm-level ... 44
3.2.2 Specific indicators: country-pair-level ... 49
3.3 Combinations of indicators ... 51
3.3.1 Relative tax situation of MNE entities... 51
3.3.2 Identifying roles in ATP channels ... 52
3.4 Methodological considerations ... 56
3.4.1 Aggregation of indicators ... 56
3.4.2 Data sources and limitations ... 57
3.4.3 Sample period and time consistency of different data sets ... 59
4 Results for EU 28 Member States ... 60
4.1 Distribution of indicators and data at country level ... 60
4.1.1 Tax rates and revenues ... 60
4.1.2 Foreign direct investment ... 63
4.1.3 Geographical distribution of MNEs and relative tax situations ... 68
4.1.4 Consolidated profitability and effective tax burden in MNE groups ... 72
4.1.5 ATP-specific indicators at entity level ... 82
4.1.6 Royalty flows, bilateral import price anomalies and treaty shopping indicators ... 96
4.2 Roles in ATP structures, by Member States... 105
4.2.1 Roles within ATP via interest payments ... 105
4.2.2 Roles within ATP via royalty payments ... 108
4.2.3 Roles within ATP via strategic transfer pricing ... 111
4.3 Overall assessment of exposure and tax base impact of ATP on Member States 5 Conclusions ... 122 113 References ... 125
Technical appendix ... 129
A Detailed description of ATP structures ... 129
A.1. Offshore loan ATP structure ... 129
A.2. Hybrid loan ATP structures ... 129
A.3. Hybrid entity ATP structure ... 131
A.4. Interest free loan ATP structure ... 131
A.5. Patent box ATP structure ... 132
A.6. Further ATP structures using intangible assets ... 133
A.7. ATP structures and tax rules of Member States ... 134
B Overview combination of indicators ... 136
B.1. Combination of indicators to identify roles in main ATP channels ... 136
B.2. Combination of indicators to identify roles in all ATP structures ... 140
C Dealing with complex ownership structures ... 146
D Gravity equation estimates to control for economic factors ... 148
D.1. Using gravity equations for FDI estimates ... 148
D.2. Simulation of FDI stocks using a simple gravity approach ... 148
D.3. Results gravity equations for geographical distribution of MNE entities and for aggregate FDI stocks ... 149
E Appendix Tables ... 151
List of tables
Table 1: ATP, main mechanisms and corresponding ATP structures ... 24
Table 2: Cost of Capital and Effective Tax Rate in ZEW study (2016) ... 25
Table 3: Summary characteristics ATP via interest payments ... 27
Table 4: Summary characteristics ATP via royalty payments ... 30
Table 5: Summary characteristics ATP via transfer pricing ... 33
Table 6: Description of general indicators - country-level ... 37
Table 7: Description of general indicators - MNE group-level ... 42
Table 8: Description of specific indicators - firm-level ... 46
Table 9: Description of specific indicators - country-pair-level ... 50
Table 10: Tax rates and decomposition of corporate tax revenues (2015) ... 61
Table 11: Foreign direct investment positions (2015) ... 65
Table 12: Foreign-controlled corporate activities (2014) ... 67
Table 13: MNE entities by relative statutory tax rates (2015) ... 69
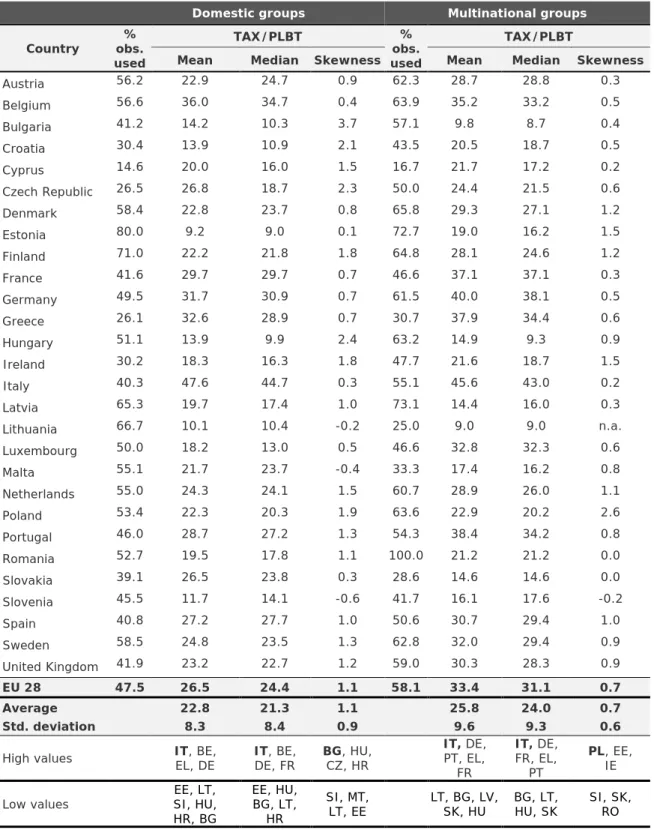
Table 14: Consolidated ETR (Tax/PLBT), by Member States (2010-2015) ... 74
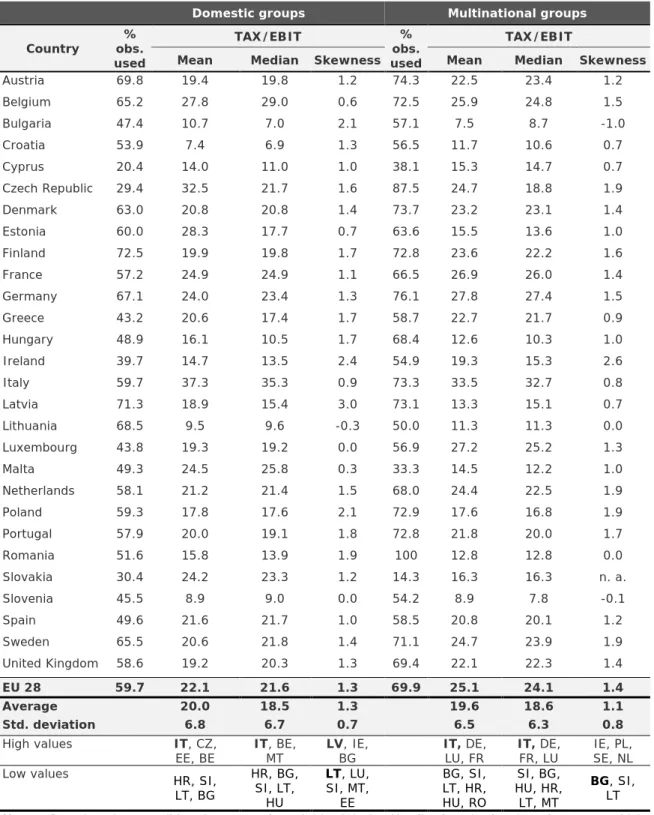
Table 15: Consolidated ETR (Tax/EBIT), by Member States (2010-2015) ... 76
Table 16: Consolidated profitability (PLBT/Assets), by Member States (2010-2015) . 79 Table 17: Consolidated profitability (EBIT/Assets), by Member States (2010-2015).. 81
Table 18: Profitability (PLBT/ASSETS), by Member States (2010-2015) ... 83
Table 19: Profitability (EBIT/ASSETS), by Member States (2010-2015) ... 85
Table 20: Profitability (FIN_PL/ASSETS), by Member States (2010-2015) ... 87
Table 21: Debt share (% of ASSETS), by Member States (2010-2015) ... 89
Table 22: Interest payments (% of ASSETS), by Member States (2010-2015) ... 91
Table 23: Intangible assets (% of ASSETS), by Member States (2010-2015) ... 93
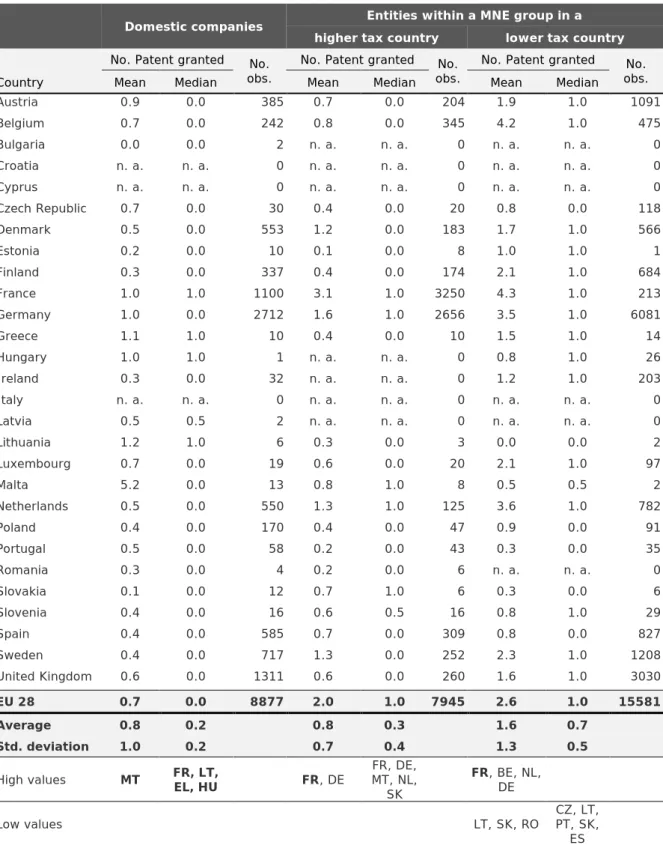
Table 24: Patents granted, by Member States (2010-2015) ... 95
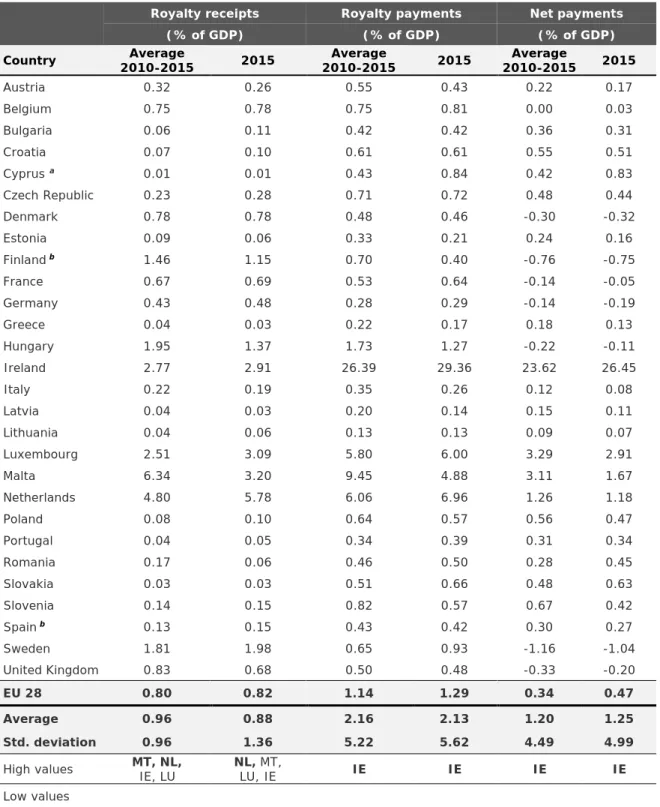
Table 25: Royalty flows, by Member States (2010-2015) ... 97
Table 26: Bilateral import price anomalies, by Member States (2010-2015) ... 99
Table 27: Treaty shopping indicators (2013) ... 102
Table 28: Roles ATP structures using interest payments, by Member States ... 106
Table 29: Roles ATP structures using royalty payments, by Member States ... 109
Table 30: Roles ATP structures using strategic transfer pricing, by Member States . 112 Table 31: Summary of results: Country-level indicators ... 114
Table 32: Summary of results: Consolidated MNE indicators ... 116
Table 33: Summary of results: Specific indicators by firm types ... 117
Table 34: Summary of results: Bilateral indicators ... 117
Table 35: Summary of results: Combination of indicators – roles within ATP channels ... 119
Table 36: Overview of indicators and broad assessment ... 121
Table 37: Legal indicators and roles of countries in ATP structures ... 135
Table 38: Combination of indicators: ATP via interest payments ... 137
Table 39: Combination of indicators: ATP via royalty payments ... 138
Table 40: Combination of indicators: ATP via strategic transfer pricing ... 139
Table 41: Combination of indicators and ATP channels – strict classification ... 143
Table 42: Combination of indicators and ATP channels –standard classification ... 144
Table 43: Results gravity estimates ... 150
Table 44: Comparison FDI stock data ... 151
Table 45: Ownership structures MNE groups (by ultimate owner) ... 152
Table 46: Ownership structures MNE groups (by ultimate owner) continued ... 153
Table 47: Ownership structures MNE groups (by direct owner) ... 154
Table 48: Ownership structures MNE groups (by direct owner) continued ... 155
Table 49: Statutory corporate tax rates Europe and low tax countries ... 156
Table 50: Statutory corporate tax rates Africa, Americas, Caribbean countries ... 157
Table 51: Statutory corporate tax rates Asian, Australia and Oceania countries ... 158
Table 52: Tax rates in Patent boxes (2015) ... 159
Table 53: Country grouping for comparison groups (part1) ... 160
Table 54: Country grouping for comparison groups (part2) ... 161
Table 55: Country grouping for comparison groups (part3) ... 162
Table 56: Number of observations with consolidated accounts by MNE status ... 163
Table 57: Number of observations in dataset by relative tax rate status ... 164
Table 58: Profitability (PLBT/EMP), by Member States (2010-2015) ... 165
Table 59: Profitability (EBIT/EMP), by Member States (2010-2015) ... 166
Table 60: Financial Profitability (FIN_PL/EMP), by Member States (2010-2015) ... 167
Table 61: Number of observations in dataset, by Member States (2010-2015) ... 168
Table 62: Roles ATP structures using interest payments, by Member States ... 169
Table 63: Roles hybrid loan ATP structure, by Member States ... 170
Table 64: Roles transfer pricing ATP structure, by Member States ... 171
Table 65: Roles intellectual property ATP structure, by Member States ... 172
Table 66: Roles in patent box ATP structure, by Member States ... 173
List of figures Figure 1: Boundaries of ATP definition ... 22
Figure 2: ATP structures - Tax planning via interest payments ... 27
Figure 3: ATP structures – Tax planning via royalty payments ... 30
Figure 4: ATP structure - Strategic transfer pricing ... 32
Figure 5: Decomposition of corporate tax revenues ... 62
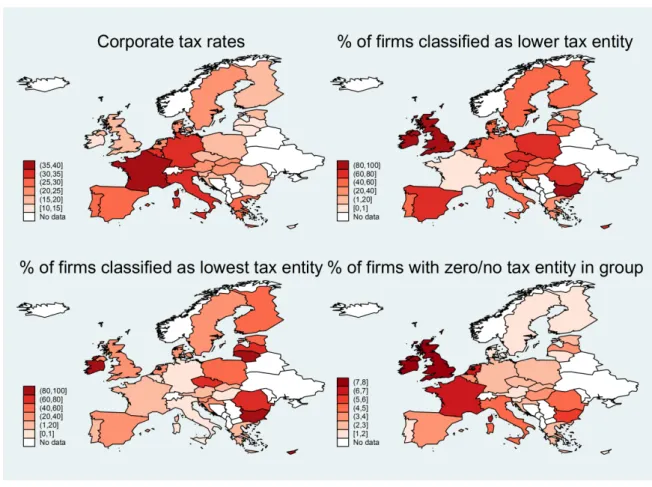
Figure 6: Corporate tax rates (2015) and MNE entities by relative tax rates ... 70
Figure 7: Distribution of consolidated ETRs by MNE status (2010-2015) ... 73
Figure 8: Distribution of profitability by MNE status (2010-2015) ... 78
Figure 9: Roles by Member States within ATP channel via interest payments ... 107
Figure 10: Roles by Member States within ATP channel via royalty payments ... 110
Figure 11: Roles by Member States within ATP channel via transfer pricing ... 111
Figure 12: Offshore loan ATP structure ... 129
Figure 13: Hybrid loan ATP structure (ZEW study) ... 130
Figure 14: Hybrid loan ATP structure (ATP study) ... 130
Figure 15: Hybrid entity ATP structure ... 131
Figure 16: Interest free loan ATP structure ... 132
Figure 17: Patent box ATP structures (ATP study) ... 132
Figure 18: Two-tiered intellectual property ATP structure ... 133
Figure 19: Cost contribution agreements ATP structure ... 134
Figure 20: Example ownership structure ... 147
List of abbreviations
ATP Aggressive tax planning
BEPS Base Erosion and Profit Shifting
CCCTB Common Consolidated Corporate Tax Base CFC Controlled Foreign Company
CI Corporate income CIT Corporate income tax CoC Cost of capital
EATR Effective average tax rate
EBIT Earnings before interest and taxation EBOPS Extended Balance of Payments Services ETR Effective tax rate
EU European Union
FATS Foreign affiliate statistics FDI Foreign direct investment FIN_PL Financial profit/losses GDP Gross domestic product IP Intellectual property MNE Multinational enterprise
MS Member State
PLBT Profit and loss before taxation OP Operating profit
SBS Structural Business Survey SPE Special purpose entity
ZEW Zentrum für Europäische Wirtschaftsforschung (Centre for European Economic Research)
List of country acronyms
Member State Acronym Member State Acronym
Austria AT Italy IT
Belgium BE Latvia LV
Bulgaria BG Lithuania LT
Croatia HR Luxembourg LU
Cyprus CY Malta MT
Czech Republic CZ Netherlands NL
Denmark DK Poland PL
Estonia EE Portugal PT
Finland FI Romania RO
France FR Slovakia SK
Germany DE Slovenia SI
Greece EL Spain ES
Hungary HU Sweden SE
Ireland IE United Kingdom UK
Abstract
The aim of this study is to provide economic evidence of the relevance of aggressive tax planning (ATP) structures for all EU Member States. The study relies on economic indicators available at macro-level and on indicators derived from firm-level data. The objective is indeed to look at the relevance of ATP for all Member States through these two complementary angles. For each indicator, the study identifies outliers based on a consistent methodology. None of the indicators provides per se an irrefutable causality towards aggressive tax planning. However, considered together, the set of indicators shall be seen as a "body of evidence". While there are some data limitation, the study provides a broad picture of which Member States appear to be exposed to ATP structures, and how it impacts on their tax base (erosion or increase).
The discussed ATP structures can be grouped into three main channels: i) ATP via interest payments, ii) ATP via royalty payments and iii) ATP via strategic transfer pricing.
In addition to general indicators assessing the overall exposure to ATP, we also derive specific indicators for each of the ATP channels. In combination, these indicators allow to classify entities within multinational enterprises (MNEs) into three types: i) target entities, where the tax base is reduced ii) the lower tax entities where the tax base is increased but taxed at a lower rate, and iii) conduit entities which are in a group with ATP activities but no clear effect on the tax base is observable.
Résumé
Le but de la présente étude est de fournir des éléments de preuve économique sur l’importance des structures de planification fiscale agressive (PFA) pour tous les Etats Membres de l’UE. L’étude utilise des indicateurs disponibles au niveau macroéconomique et des indicateurs dérivés de données à l’échelle des entreprises. L’objectif est ainsi de considérer l’importance de la PFA pour tous les Etats Membres à travers ces deux angles complémentaires. Pour chaque indicateur, l’étude identifie des valeurs anormales sur la base d’une méthodologie uniforme. Aucun des indicateurs en soi ne permet d’établir une causalité irréfutable quant à la présence de planification fiscale agressive.
Cependant, pris dans leur ensemble, ces indicateurs sont à voir comme des ‘éléments de preuves’. Malgré le caractère limité de certaines données, l’étude fournit une vue d’ensemble sur les Etats Membres qui apparaissent exposés aux structures de PFA, et sur leur impact sur les bases d’imposition (érosion ou croissance).
Les structures de PFA qui sont considérées peuvent être regroupées en trois canaux
principaux: i) PFA à travers le paiement d’intérêts; ii) PFA à travers le paiement de
royalties; et iii) PFA par une stratégie de prix de transferts. Outre les indicateurs
généraux évaluant l’exposition d’ensemble à la PFA, nous définissons des indicateurs
spécifiques pour chacun des canaux de PFA. Par combinaisons, ces indicateurs
permettent de classifier les entités faisant partie d’entreprises multinationales en trois
types: i) entités cibles, dont la base d’imposition est réduite; ii) entités plus faiblement
taxées, dont la base d’imposition est augmentée et taxée à un taux faible; et iii) entités
relais, qui font partie d’un groupe multinational pratiquant la PFA sans que des effets
clairs sur la base d’imposition soient observables.
Executive Summary
The international corporate tax system aims to tax the profits of multinational enterprises (MNE) where they arise. However, MNEs have in some instances exploited mismatches and loopholes in the international tax framework to reduce their overall tax burden. This entails substantial problems, such as revenue losses, unfair competitive advantages or lower tax morale. Therefore, the Commission has made it a priority to fight aggressive tax planning (ATP).
The aim of this study is to provide country-level indicators which potentially identify the relevance of ATP structures for all EU Member States, based on economic elements. This study builds on two previous studies by Ramboll and Corit (2015) and ZEW (2016) where typical ATP structures were identified and examined. These studies focused respectively on the tax rules (or absence thereof) that facilitate ATP, and the impact of ATP on the theoretical effective tax burdens. They did however not encompass any economic analysis based on observed empirical facts. The main objective of this study will therefore be to complement existing studies with empirical economic effects.
We focus on the economic substance of the ATP structures, identified in the Ramboll and Corit (2015) and ZEW (2016) studies and group them into three ATP channels.
ATP via interest payments
ATP via royalty payments
ATP via strategic transfer pricing
For each of these three ATP channels, we identify relevant economic measures which we link to publicly available data. We define a set of general indicators which can be indicative of exposure and general impact of ATP and a set of specific indicators which potentially yield information about a specific ATP channel. These indicators are used in two ways. First, we look at country-level distributions of these indicators to highlight the possible overall exposure and impact of ATP for each Member State. Secondly, we combine the specific indicators to clarify which "type" of entity within MNE groups is likely to be present in a country, according to the following three categories:
Target entity (firm within a MNE group, where the tax base is reduced)
Lower tax entity (firm within a MNE group, where the tax base is increased and taxed at a lower rate)
Conduit entity (firm within a MNE group, which seemingly engages in ATP, but where the tax base is not necessarily significantly affected) The label "conduit entity" may have a broader meaning than is generally understood in tax literature as it does not only encompass entities through which income flows transit.
The analysis of the relative prevalence of these three types of entities across Member States complements the results from the country-level distribution of the indicators.
The derived indicators can be grouped into four categories:
Country-level and bilateral indicators (Corporate tax rates and
revenues, foreign direct investment and market structure, royalty flows,
bilateral import prices and treaty shopping indicators)
MNE group-level indicators (MNE geographical structure and relative tax burden, consolidated tax burden and profitability)
Firm-level indicators by firm types (Specific indicators such as profitability, debt shares, interest payments, intangible assets, patent applications by relative tax rate situation)
Combination of firm-level indicators (Shares of firms classified as target, lower tax or conduit entities)
Methodology, data and caveats:
The study relies on indicators available at macro-level and on indicators derived from firm-level data. The objective is indeed to look at the relevance of ATP for all Member States through these two complementary angles. For each indicator, the study identifies outliers based on a consistent methodology (with thresholds based on standard deviations away from the mean). However, there are some clear data limitations, notably in terms of availability and quality, which affect the choice of the indicators and the interpretation of the results. The data limitations are particularly true for firm-level indicators. Furthermore, some indicators are clearly influenced by other factors (e.g.
general economic conditions) than ATP and none of the indicators provides therefore per se an irrefutable causality towards aggressive tax planning. Rather, considered together, the set of indicators shall be seen as a "body of evidence" that are consistent with the possible existence of an ATP structure. Being an outlier country for one (or several) indicators does therefore not suggest that the country is without any doubt used by MNEs in ATP structures. Instead, it indicates that such structure potentially exists. Another important limitation of the study is the impossibility to obtain reliable information to identify permanent establishments.
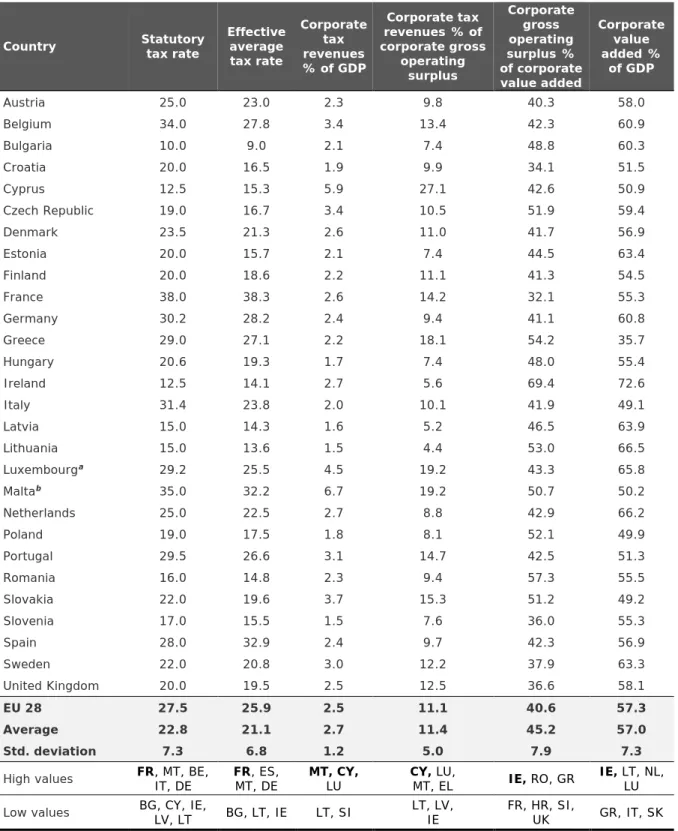
Corporate tax rate and revenues:
The statutory corporate tax burden varies substantially between the Member States, which implies scope for ATP practices. The corporate tax revenues only partly reflect the differences in the statutory rates and the data show that some small Member States like Cyprus, Malta and Luxembourg are able to raise more corporate tax revenues relative to their GDP than others. The decomposition of the corporate tax revenues into size, profitability and implicit tax burden of the corporate sector, reveals that some countries, in particular Ireland, seem able to attract substantial tax base. In other Member States, a profitability of the corporate sector well below the EU average, could indicate an erosion of the tax base owing to ATP, although other factors may of course be at play.
Profitability of the corporate sector is found to be particularly low in France, Croatia, Slovenia and the United Kingdom.
Foreign direct investment (FDI) and market structure:
The FDI stocks measured as a percentage of GDP shed some light on the importance of
MNE activities in the Member States and therefore can give a broad impression whether
a Member State is potentially exposed to ATP. In some countries, extraordinarily high
values could indicate that substantial ATP activities take place. Both inward and outward
FDI stocks are several times higher than GDP in Cyprus, Ireland, Luxembourg, Malta
and the Netherlands. Together with Hungary, those countries have actual FDI stocks
significantly above those predicted by our gravity model. These large numbers are
primarily due to FDI through special purpose entities (SPEs), which could also be an indication of ATP through the use of SPEs.
Large market shares of large corporations suggest that some Member States like Germany or the United Kingdom are more vulnerable to ATP because of high concentration among the corporate tax payers. The extraordinarily high share of foreign-controlled firms in Estonia and Luxembourg might possibly reflect some tax driven behaviour. Equally, the high share of gross operating surplus in foreign-controlled firms in Ireland, Hungary, Luxembourg and Romania can also be consistent with a high profitability of the corporate sector in these countries, which could in turn indicate ATP.
Royalty flows:
The country-level information of royalty payments and receipts draws a very clear picture. Ireland stands out as the Member State with the highest net royalty payments (as a percentage of GDP), which is consistent with a potential ATP channel using royalty payments. Other Member States with significant royalty inflows and outflows (and positive net outflows) are Luxembourg, Malta and the Netherlands. Sweden, Finland, Denmark and the United Kingdom have the highest net royalty receipts.
Bilateral import prices:
The analysis of bilateral import price anomalies shows that larger, and often higher tax countries, such as Germany and France tend to have more inexplicably high import prices than low ones. This might be an indication of transfer mispricing that erodes tax bases in those countries. Spain, the United Kingdom, the Netherlands and Italy also have a relatively high number of price anomalies, which suggests that strategic transfer pricing strategies could affect the base in these countries.
Treaty shopping indicators:
The treaty shopping indicators identify some countries like the United Kingdom, Luxembourg, Estonia and the Netherlands as central on dividend repatriation routes.
Overall, treaty shopping is of particular relevance for repatriation from outside the EU.
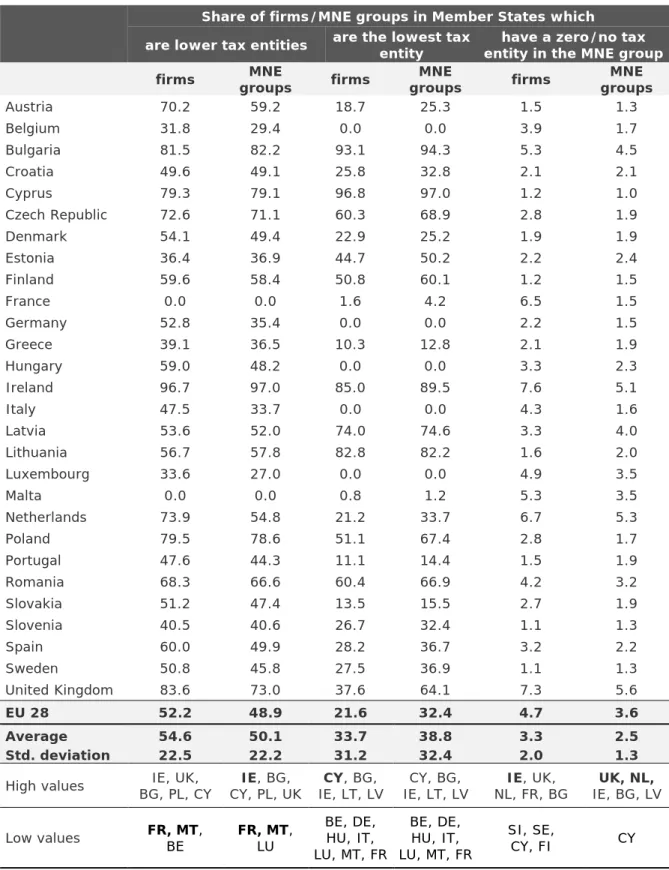
MNE geographical structure and relative tax burden:
In several European countries (Belgium, Germany, Hungary, Luxembourg and Italy) all MNE entities have at least one subsidiary in a country with a lower tax burden. This indicates that these Member States are potentially more vulnerable to ATP. Being exposed to ATP does however not necessarily mean that a country's tax base is eroded.
It can also be an indication that the country's tax rules are being used to shift profits
but with limited direct impact on the tax base. In comparison, in Bulgaria, Cyprus,
Ireland, Lithuania and Latvia, i.e. the countries identified among those having the lowest
statutory tax rates, the MNE entities are in most cases the lowest tax entities. This could
indicate that these Member States are more likely to benefit from ATP structures shifting
tax base into these entities. Furthermore, looking at the share of MNE entities which are
in MNE groups with a presence in a zero/no corporate tax country, the Netherlands,
France, Ireland, the United Kingdom, Bulgaria and Latvia stand out with the strongest
links which may be an indication that these countries are more exposed to ATP, albeit
in different ways.
Consolidated effective tax rates (ETR) and profitability:
The comparison of the consolidated ETRs finds a clearly higher ETR for MNEs than for domestic companies, which is at odds with the expectation of MNEs being able to reduce their tax burden through ATP. That said, looking at the profitability measures one can clearly see that MNE groups have a substantially higher operating profitability than domestic firms. In contrast, the consolidated pre-tax profitability of MNEs is comparable to the one of the domestic firms. This reflects the ability of MNE groups to reduce their tax base through financial losses (or other extraordinary deductions). The analysis of consolidated account does at the same time not reveal clear patterns across Member States.
ATP-Specific indicators at entity level:
The study looks a set of indicators (such as profitability, debt shares, interest payments, intangible assets, patent applications) which are relevant to understand which ATP structures may be more prevalent in a given Member State. These indicators are provided per Member State and for three types of entities: domestic companies, MNE entities located in relatively higher tax countries, and MNE entities located in relatively lower tax countries. Those indicators show patterns which are generally consistent with at least some ATP taking place. For 25 out of 28 Member States, we see a higher pre- tax profitability in MNE entities located in countries with a relatively low statutory tax burden. A similar picture for operating profitability indicates the importance of ATP structures using royalty payments or strategic transfer pricing. In a majority of countries, on average, MNE entities post financial losses. However, we see on average financial profits for the MNE entities in some Member States, including the Netherlands, Sweden, Austria and Denmark. This may suggest that some MNE groups relocate corporate tax base to their entities in these Member States via ATP structures using interest payments. The result of lower debt shares in lower tax MNE entities is broadly in line with the predictions of the ATP via interest payments which sees debt being allocated in higher tax entities. For a subset of companies where we can match patent ownership information we see a concentration of patent holdings in countries with patent boxes, most notable France, Belgium and the Netherlands, as well as Germany (that does not have a patent box).
Roles in ATP structures:
The study aims at identifying for each of the three ATP channels what is the function (if any) of a given entity in a given Member State. The objective was to confirm with firm- level information some pattern that emerges from macro-data. However, limited data availability means that the results need to be interpreted with caution. Furthermore, the statutory corporate tax rate of a country plays an important role in the classification, thereby possible over/under-stating the relevance of ATP.
The analysis of roles within the three different ATP channels find consistently that MNE entities in France, Belgium and Malta are most often classified as target entities. While this could partly be driven by the high tax rate in these Member States, this can also reflect that relative profitability in these MNE groups could be consistent with ATP taking place. The countries with the largest share of lower tax entities are consistently Bulgaria, Poland, Slovenia, Hungary and Latvia, which again may be driven by the low tax rates.
Additionally, we find a large share of conduit entities in Hungary, the Netherlands,
Ireland, the United Kingdom and Austria. This indicates that these Member States are likely to be more exposed to ATP. Since our definition of conduit entities implies that at least one entity of the MNE group is classified as a target entity, the classification as a conduit entity may also partly reflect incomplete information about lower/no tax entities outside the EU.
For the ATP channel using interest payments the number of entities classified as target
or lower tax entities is only moderate. This is partly driven by the combination of data
quality and requirements for the classification in the types of entities. In comparison,
for the ATP channel using royalty payments we are able to classify a larger share of the
MNE entities into roles within the ATP structures. This partly reflects better data quality
for operating profitability in comparison to the financial profitability, but also confirms
that the distribution of intangible assets at the firm level is broadly consistent with ATP
via royalty payments. The analysis of the role in strategic transfer pricing ATP channel,
finds for three quarters of the MNE groups that the firm-level distribution of pre-tax
profitability and operating profitability is consistent with tax-motivated relocation of
profits in some part of the MNE group.
Sommaire
Le cadre de la fiscalité internationale des entreprises vise à l'imposition des profits des entreprises multinationales là où ils sont générés. Cependant, les entreprises multinationales ont exploité dans certains cas les écarts et les lacunes du cadre fiscal international pour réduire leur charge fiscale globale. Des problèmes substantiels s’ensuivent, tels que pertes de revenu fiscaux, avantage compétitif déloyal ou diminution de la morale fiscale. La Commission européenne a par conséquent fait de la lutte contre la planification fiscale agressive (abrégé par la suite en PFA) une priorité.
Le but de la présente étude est de fournir des indicateurs à l’échelon national qui identifient potentiellement l’importance des structures de PFA pour tous les Etats Membres de l’Union européenne, en se basant sur des éléments de nature économique.
Cette étude s’appuie sur deux études précédentes, l’une par Ramboll et Corit (2015) et l’autre par ZEW (2016), où les structures types de planification fiscale agressive sont identifiées et examinées. Ces études mettent respectivement l’accent sur les règles fiscales (ou leur absence) facilitant la PFA et sur l’impact de la PFA sur les charges fiscales effectives théoriques. Ni l’une ni l’autre ne comprennent toutefois d’analyse économique basée sur des observations empiriques. L’objectif principal de la présente étude est donc d’apporter ce complément, à l’aide d’analyses de données économiques empiriques.
Nous nous concentrons sur les structures de planification fiscale agressive identifiées par les études de Ramboll et Corit (2015) et ZEW (2016), que nous regroupons en trois canaux:
PFA à travers le paiement d’intérêts
PFA à travers le paiement de royalties
PFA par une stratégie de prix de transferts
Pour chacun de ces trois canaux, nous identifions les indicateurs économiques pertinents et les mettons en lien avec des données publiquement disponibles. Nous définissons ainsi un ensemble d’indicateurs généraux qui peuvent mettre en lumière une possible exposition à la PFA et les impacts globaux, ainsi qu’un ensemble d’indicateurs spécifiques qui peuvent fournir des informations sur les canaux de PFA. Ces indicateurs sont utilisés de deux manières. Premièrement, nous considérons la distribution par pays de chacun de ces indicateurs afin de révéler l'exposition potentielle et l’impact potentiel de la PFA dans chacun des Etats Membres. Deuxièmement, nous combinons des indicateurs spécifiques afin d’identifier et de classifier les types d’entités de groupes multinationaux dont la présence dans l’une des trois catégories suivantes est probable:
Entité cible (entreprise d’un groupe multinational dont la base d’imposition est réduite)
Entité plus faiblement taxée (entreprise d’un groupe multinational dont la base d’imposition est augmentée et taxée à un taux faible)
Entité relais (entreprise d’un groupe multinational semblant impliquée dans la
PFA mais dont la base d’imposition n’est pas affectée de manière sensible; au-
delà de la compréhension courante de la littérature sur la fiscalité, l'entité relais
couvre d’autres entités que celles où des flux de revenus transitent)
L’analyse de la prévalence de ces trois types d’entités dans chacun des Etats Membres complète les résultats issus de la distribution des indicateurs par pays.
Les indicateurs définis pour les besoins des analyses peuvent être regroupés en quatre catégories :
Indicateurs nationaux et bilatéraux (Taux et revenus des impôts sur les sociétés, investissements directs étrangers et structure du marché, flux de royalties, prix des importations et indicateurs de « chalandage fiscal »)
Indicateurs au niveau des groupes multinationaux (Structure géographique des groupes multinationaux et charge fiscale relative, charge fiscale consolidée et rentabilité)
Indicateurs par types d’entreprises (Indicateurs spécifiques tels que rentabilité, distribution de l’endettement, paiement d’intérêts, immobilisations incorporelles, dépôts de brevets en fonction de la situation fiscale relative des entités)
Combinaison d’indicateurs de niveau entreprise (Proportion d’entreprises classifiées comme cible, plus faiblement taxée ou relais)
Méthodologie, données et réserves :
L’étude exploite aussi bien des indicateurs de niveau macroéconomique que des indicateurs à l’échelle des entreprises. L’objectif est en effet de considérer l’importance de la planification fiscale agressive pour tous les Etats Membres à travers ces deux angles complémentaires. Pour chaque indicateur, l’étude identifie des valeurs anormales sur la base d’une méthodologie uniforme (à l’aide de seuils basés sur les écarts types par rapport à la moyenne). Cependant, le caractère limité des données, notamment en termes de disponibilité et de qualité, affecte le choix des indicateurs et l’interprétation des résultats. Les limitations dues aux données sont particulièrement vraies pour les indicateurs à l’échelle des entreprises. De plus, certains indicateurs étant clairement influencés par d’autres facteurs (p.ex. les conditions économiques générales) que la PFA, aucun des indicateurs en soi ne permet d’établir une causalité irréfutable quant à la présence de planification fiscale agressive. Par contre, pris dans leur ensemble, ces indicateurs sont à voir comme des ‘éléments de preuves’ qui correspondent à l’existence possible de structures de PFA. Être identifié comme un cas particulier ("outlier") pour un ou plusieurs indicateurs n'indique ainsi pas qu'un pays est utilisé sans doute aucun par les multinationales pour des activités de PFA. Il s’agit plutôt de signaler l’existence possible de telles structures. Une autre limitation importante de cette étude est l’impossibilité d’obtenir des informations fiables qui permettent d’identifier les établissements stables.
Taux et revenus des impôts sur les sociétés :
Le taux d’imposition légal sur les sociétés varie de manière substantielle d’un Etat
Membre à l’autre, ouvrant la porte à des pratiques de planification fiscale agressive. Les
revenus de l’impôt sur les sociétés ne reflètent que partiellement les différences de taux
nominaux et les données montrent que certains Etats Membres de taille plus modeste,
comme Chypre, Malte ou le Luxembourg, sont capables de générer plus de revenus de
l’impôt sur les sociétés par rapport à leur PIB que d’autres. La décomposition des
revenus de l’impôt sur les sociétés selon la taille, la rentabilité et la charge fiscale
implicite des entreprises révèle que certains pays, en particulier l’Irlande, semblent
capables d’attirer une base fiscale considérable. Dans d'autres Etats Membres, une rentabilité des entreprises bien inférieure à la moyenne de l’Union européenne pourrait révéler une érosion de la base fiscale qui soit due à la PFA, même si d’autres facteurs peuvent bien entendu entrer en jeu. La rentabilité du secteur privé se trouve être ainsi particulièrement basse en France, en Croatie, en Slovénie et au Royaume-Uni.
Investissements directs étrangers (IDE) et structure du marché :
Les stocks d’IDE, mesurés en pourcentage du PIB, donnent une certaine vision de l’importance des activités des groupes multinationaux dans les Etats Membres et peuvent ainsi donner une impression générale de l’exposition d’un Etat Membre aux pratiques de PFA. Dans certains pays, des valeurs extraordinairement élevées pourraient potentiellement révéler une pratique substantielle de PFA. Aussi bien les stocks d’IDE depuis l’étranger que les stocks d’IDE vers l’étranger ont des valeurs qui sont plusieurs fois supérieures au PIB à Chypre, en Irlande, au Luxembourg, à Malte et aux Pays-Bas. Les stocks d’IDE observés dans ces pays et en Hongrie sont largement supérieurs aux stocks théoriques calculés à l'aide de notre modèle gravitationnel. Ces valeurs élevées sont principalement dues aux IDE réalisés par l’intermédiaire d’entités ad-hoc spécialisées, ce qui pourrait signaler la réalisation de PFA à l’aide de ces entités.
Des secteurs fortement concentrés, avec donc des grandes entreprises qui ont de fortes parts de marché, suggèrent que certains Etats Membres, comme l’Allemagne et le Royaume Uni, sont plus vulnérables à l’ATP; les revenus de l’impôt sur les sociétés étant très concentrés sur certaines entreprises contribuables. La proportion extraordinairement élevée d’entreprises contrôlées par des multinationales étrangères en Estonie et au Luxembourg pourrait refléter des comportements motivés par le système fiscal. Par ailleurs, le niveau élevé des excédents bruts d'exploitation des entreprises contrôlées par des multinationales étrangères en Irlande, en Hongrie, au Luxembourg et en Roumanie peut également coïncider avec une grande rentabilité du secteur privé dans ces pays, ce qui pourrait signaler des pratiques de PFA.
Flux de royalties :
Les informations disponibles à l’échelon national sur les paiements et la réception de royalties fournissent une image très claire. L’Irlande se démarque comme l’Etat Membre au volume de paiement net de royalties le plus élevé (en pourcentage du PIB), ce qui est potentiellement cohérent avec des pratiques de PFA utilisant ces royalties. Les autres Etats Membres à volume de royalties entrants et sortants significatifs (pour un volume net sortant) sont le Luxembourg, Malte et les Pays-Bas, tandis que la Suède, la Finlande, le Danemark et le Royaume-Uni ont les volumes nets de royalties entrants les plus élevés.
Prix des importations :
L’analyse des anomalies de prix des importations et exportations révèle que des pays
de grande taille et à haut niveau d’imposition, comme l’Allemagne et la France, sont
plus souvent confrontés à des prix d’importation inexplicablement élevés que confrontés
à des prix bas. Cette observation peut être une indication de manipulation des prix de
transferts destinés à réduire la base fiscale dans ces pays. L’Espagne, le Royaume-Uni,
les Pays-Bas et l’Italie sont également confrontés à un nombre relativement élevé
d’anomalies de prix, ce qui suggère que des stratégies de prix de transferts pourraient
affecter la base fiscale de ces pays.
Indicateurs de chalandage fiscal :
Les indicateurs de chalandage fiscal identifient quelques pays, comme le Royaume-Uni, le Luxembourg, l’Estonie et les Pays-Bas, comme étant centraux sur les parcours de rapatriement des dividendes. Dans l’ensemble, le chalandage fiscal apparait comme particulièrement important pour le rapatriement des dividendes venant de pays situés hors de l’UE.
Structure géographique des groupes multinationaux et charge fiscale relative : Dans plusieurs pays Européens (la Belgique, l’Allemagne, la Hongrie, le Luxembourg et l’Italie), tous les groupes multinationaux disposent d’au moins une filiale dans un pays où la charge fiscale est plus basse. Cela peut révéler une plus grande vulnérabilité de ces Etats Membres aux pratiques de PFA. Être exposé à la PFA ne veut cependant pas dire que la base fiscale du pays est réduite. Cela peut aussi être une indication que les règles fiscales sont utilisées pour déplacer des profits, tout en ayant un impact direct limité sur la base fiscale. En comparaison, en Bulgarie, à Chypre, en Irlande, en Lituanie et en Lettonie, c’est-à-dire dans les pays caractérisés par les taux d’impositions nominaux parmi les plus bas, les entités des groupes multinationaux sont dans la plupart des cas les entités les plus faiblement taxées. Cela pourrait révéler le fait que ces Etats Membres ont une plus grande chance de bénéficier des structures de PFA qui déplacent les bases fiscales des multinationales dans ces entités faiblement taxées. De plus, si on considère la proportion d'entités qui font partie d’un groupe multinational qui est présent dans des pays sans impôts sur les sociétés (ou avec un taux nul), les Pays-Bas, la France, l’Irlande, le Royaume-Uni, la Bulgarie et la Lettonie se démarquent par leur grand nombre de liens, ce qui peut être une indication que ces pays sont exposés de manière plus forte à la PFA, de façons toutefois différentes.
Taux d’imposition effectifs (TIE) consolidés et rentabilité :
La comparaison des TIE consolidés mène à un TIE clairement plus élevé pour les entreprises multinationales que pour les entreprises dont l'activité est nationale, contrairement aux attentes qu’il est possible d’avoir, les groupes multinationaux ayant en théorie moyen de réduire leur charge fiscale par des pratiques de PFA. Cependant, les mesures de rentabilité montrent que les groupes multinationaux ont une rentabilité opérationnelle qui est plus élevée que celle des entreprises dont l'activité est purement nationale et ceci de manière substantielle. Par contraste, la rentabilité consolidée avant impôt des groupes multinationaux est comparable à celle des entreprises dont l'activité est purement nationale. Cela reflète la capacité des groupes multinationaux à réduire leur base fiscale à l’aide de pertes financières (ou autres déductions extraordinaires).
L’analyse des comptes consolidés ne révèle toutefois pas de différences systématiques d’un Etat Membre à l’autre.
Indicateurs spécifiques à la PFA au niveau des entités :
L’étude considère un ensemble d’indicateurs (tels que rentabilité, distribution de
l’endettement, paiement d’intérêts, immobilisations incorporelles, dépôts de brevets)
qui sont pertinents pour comprendre quelles structures de PFA sont les plus présentes
pour un Etat Membre donné. Ces indicateurs sont produits pour chaque Etat Membre et
pour chacun des trois types d’entités suivants: entreprises dont les activités sont
uniquement nationales; entités multinationales situées dans des pays à charge fiscale
relativement plus élevée; et entités multinationales situées dans des pays à charge
fiscale relativement plus faible. Ces indicateurs révèlent des configurations qui en général peuvent permettre de mettre en évidence une certaine activité de PFA. Pour 25 des 28 Etats Membres on constate une rentabilité avant impôt plus élevée dans les entités multinationales qui se situent dans des pays dont les taux d’impositions nominaux sont comparativement plus faibles. Une configuration similaire pour la rentabilité opérationnelle montre l’importance des structures de PFA qui utilisent les paiements de royalties ou les stratégies de prix de transferts. Dans la majorité des pays, en moyenne, les entités multinationales affichent des pertes financières. Cependant, des profits financiers sont en moyenne visibles pour les entités multinationales dans quelques Etats Membres, incluant les Pays-Bas, la Suède, l’Autriche et le Danemark.
Cela peut suggérer que certains groupes multinationaux déplacent leur base d’imposition dans leurs entités qui se trouvent dans ces Etats Membres, à l’aide de structures de PFA basées sur les paiements d’intérêts. L'observation d’une part d’endettement plus faible des entités multinationales plus faiblement taxées correspond dans l’ensemble aux prédictions de structures de PFA basées sur les paiements d’intérêts qui allouent la dette aux entités taxées plus fortement. Pour la partie des entreprises où il est possible d’exploiter les informations sur les propriétaires de brevets se voit une concentration de la détention des brevets dans les pays où existent des régimes fiscaux favorables aux brevets (boîtes à brevets ou patent boxes), surtout en France, en Belgique et aux Pays-Bas, ainsi qu’en Allemagne (qui n’a pas de régime fiscal spécifique favorable aux brevets).
Rôles dans les structures de PFA :
Pour chacun des trois canaux de PFA, l’étude vise à identifier la fonction (si tant est qu'elle existe) d’une entité donnée dans un Etat Membre donné. L’objectif est de confirmer avec des données empiriques à l’échelle des entreprises certaines observations qui émergent des données à l’échelle macroéconomique. Toutefois, la disponibilité limitée de certaines données invite à la prudence dans l’interprétation des résultats. De plus, le taux d’imposition nominal sur les sociétés d’un pays joue un rôle important dans la classification, ce qui peut ainsi soit surestimer soit sous-estimer l’importance de la PFA.
L’analyse des rôles pour chacun des trois canaux de PFA montre de manière récurrente que les entités multinationales situées en France, en Belgique et à Malte sont le plus souvent des entités cibles. Bien que ce résultat puisse en partie être dû aux taux d’imposition élevés de ces pays, le résultat peut également refléter une rentabilité des entités relatives à leur groupe multinational qui correspondrait à des pratiques de PFA.
Les pays comprenant la part d’entités plus faiblement taxées la plus large sont de manière récurrente la Bulgarie, la Pologne, la Slovénie, la Hongrie et la Lettonie, ce qui là aussi peut être la conséquence de taux d’imposition faibles. Par ailleurs, nous observons une grande part d’entités relais en Hongrie, aux Pays-Bas, en Irlande, au Royaume-Uni et en Autriche. Cette observation indique une plus grande probabilité pour ces pays d’être exposés aux pratiques de PFA. Etant donné que notre définition des entités relais implique au minimum une entité cible dans le même groupe multinational, la classification comme entité relais pourrait en partie refléter un manque d’information sur les entités faiblement ou non taxées situées en dehors de l’UE.
Pour le canal de PFA basé sur le paiement d’intérêts, le nombre d’entités classées
comme des entités cibles ou des entités plus faiblement taxées est faible. Cet état de
fait est en partie dû à une combinaison de problèmes de qualité des données avec le
besoin des données nécessaire à une classification dans l’une des deux catégories. En
comparaison, pour le canal de PFA basé sur les paiements de royalties, il est possible
de classifier un plus grand nombre d’entités multinationales dans des rôles au sein des
structures de PFA. Cette observation reflète en partie une meilleure qualité des données
sur la rentabilité opérationnelle que sur la rentabilité financière, mais confirme
également le fait que la distribution des immobilisations incorporelles au niveau des
entreprises peut correspondre dans l’ensemble à des pratiques de PFA à base de
paiements de royalties. L’analyse des rôles dans le canal de PFA à base de prix de
transferts identifie dans trois quarts des groupes multinationaux, à l’échelle des
entreprises, une distribution de la rentabilité avant impôts et une distribution de la
rentabilité opérationnelle qui sont possiblement cohérents avec un déplacement de
profits au sein du groupe motivé par des considérations fiscales.
1 Introduction
1.1 Background
The notion that corporations, in line with all other taxpayers, should pay their fair amount of taxes is widely shared. At the same time, it is also evident that especially Multinational Enterprises (MNEs) have more opportunities to reduce their corporate tax burden. Under the term aggressive tax planning (ATP), defined as “taking advantage of the technicalities of a tax system or of mismatches between two or more tax systems”
the European Commission (2012) subsumes the excessive use of the opportunities to reduce the corporate tax burden. Widespread aggressive tax planning implies fewer revenues for countries and leads to unfair contributions by some taxpayers, thereby reducing tax morale and creating distortions of competition between companies.
These issues are increasingly recognised in the policy debate and the Commission has made it a priority to fight tax avoidance. Actions taken include the June 2015 Action Plan for a fair and efficient corporate tax system in the EU, the automatic exchange of information on tax rulings and advance pricing arrangements as well as of country-by- country reports, and the adoption of the Anti-Tax Avoidance Directives. The relaunch of the Common Consolidated Corporate Tax Base (CCCTB) further contributes towards the achievement of the goal of a fairer and simpler tax system for MNEs. Furthermore, in the context of the European Semester, the importance of fighting tax abuse has been repeatedly stressed, and a number of country reports have highlighted the risk that some Member States’ tax rules might be used in ATP schemes. There is also a much broader international policy debate, with initiatives like the Base Erosion and Profit Shifting (BEPS) of the G20/OECD.
A solid understanding of the extent and channels of ATP is fundamental to draw policy conclusion and recommendations for the fight against unfair tax practices. To this end the European Commission (DG TAXUD) has commissioned a study on Structures of Aggressive Tax Planning and Indicators (Ramboll Management Consulting & Corit Advisory (2015)), hereafter the “ATP study”. The ATP study provides a legal analysis of common ATP structures. The objectives of the study were threefold: (i) identification of model ATP structures; (ii) identification of ATP factors (i.e. critical tax rules and practices that facilitate or allow ATP); and (iii) individual assessment of the prevalence of such factors across Member States. Concretely, the study identifies seven legal structures that are most commonly used by MNEs that engage in ATP. These are: (1) Offshore loan ATP structure, (2) Hybrid loan ATP structure, (3) Hybrid entity ATP structure, (4) Interest-free loan ATP structure, (5) Patent box ATP structure, (6) Two-tiered IP ATP structure, and (7) ATP structure based on IP and cost contribution agreement.
A subsequent study by ZEW (2016), hereafter the “ZEW study”, uses three of the basic mechanisms of the ATP structures and calculates the effective tax burdens for hypothetical cross-border investment projects of MNEs in the European Union and the United States.
1This allows to theoretically quantify the potential tax savings of the different tax planning strategies. Both studies allow assessing all Member States in a
1
The two structures "offshore loan ATP structure" and "hybrid loan structure" of the ATP study
are combined in an ATP channel labelled "profit shifting via interest payments".
consistent manner and enable the identification of those tax rules, which could - potentially- be used in aggressive tax planning structures.
Both the ATP study and the ZEW study focus on a subset of national tax rules and practices and exclude issues such as international rules regarding the allocation of taxing rights.
1.2 Objectives
The overarching objective of this study is to complement the existing legal evidence base and theoretical considerations about ATP in the EU Member States with economic substance. The ATP study enhances the understanding of how countries’ tax rules can be used in ATP schemes and which Member States have tax rules which are most vulnerable to be used in ATP. The ZEW study uses the tax law provisions and calculates theoretical effective tax burdens incorporating ATP structures. Both studies focus on the possibilities of ATP but do not encompass any economic analysis based on observed empirical facts. The main objective of this study will be to substantiate the legal analysis of the ATP study and the results of the theoretical effective tax burdens in the ZEW study with economic evidence.
The economic importance of tax avoidance has been addressed in several recent studies (e.g. OECD, 2015 and the European Commission 2015b).
2However, examining the relevance of ATP in all EU Member States thanks to a set of comparable indicators largely remains an unresolved issue. Hence, the main objective of the study is to assess which Member States’ tax rules are effectively being used in ATP structures. Since ATP structures involve at least two countries, the Member States’ tax rules can be used in different ways in these structures. Therefore, another key aim of this study is to identify how Member States’ tax rules are used within ATP structures. Building on this information, this study furthermore has the goal to have a broad assessment as to whether Member States seem to gain or lose corporate tax base through these tax practices.
2
The terms aggressive tax planning and tax avoidance both describe behaviour against the spirit
of the law to reduce the tax liability and therefore may be used interchangeably for the purpose
of this report.
2 Characterising aggressive tax planning
Active management of the tax affairs by (multinational) corporations does not in itself result in aggressive tax planning. A number of Member States have actually implemented tax provisions which allow firms to lower their overall tax burden if they change their behaviour in the desired way (e.g. invest more in qualifying R&D expenditure). To separate these aspects from aggressive tax planning, this section first clarifies the boundaries of ATP used for this report. Based on this definition, we describe the main channels of tax planning and how model ATP structures relate to them.
Subsequently, we illustrate in which different ways the tax systems of the Member States can be used within the various ATP structures. Finally, we outline the potentially important role of third country jurisdictions.
2.1 Definition and boundaries of aggressive tax planning
In line with the ATP study (2015, p. 23), we start with the definition of the European Commission (2012), which describes aggressive tax planning as “taking advantage of the technicalities of a tax system or of mismatches between two or more tax systems for the purpose of reducing tax liability.”
While it is theoretically possible to draw a line between acceptable tax planning and aggressive tax planning, the boundaries will in reality be somewhat blurred.
Figure 1 presents some firm behaviour on a continuum of tax aggressiveness. The continuum ranges from activities, which are clearly in the spirit of the law e.g. claiming tax credits or using loss carry forwards etc., to behaviour which is clearly illegal, i.e. tax evasion.
Figure 1: Boundaries of ATP definition
Source: own illustration
The bracket in Figure 1 highlights the boundaries of ATP for the purpose of this study, i.e. behaviour of MNEs, which substantially reduces their tax burden and runs against the spirit of the law. Such a definition still aims to exclude tax planning by domestic or standalone companies and tax reductions, which are clearly intended by the policy makers. Furthermore, in line with the ATP study, it excludes all illegal measures to lower the tax burden.
The use of a continuum in Figure 1 highlights the difficulties of defining sharp boundaries
of ATP. This also implies that several of the indicators will partly include non-aggressive
tax planning and their outcome. Since we rely on publicly available information and are not always able to fully identify the underlying causes of reallocations or reductions of the corporate tax base, the proposed indicators are most likely to partly include non- ATP behaviour. That said, the current analysis provides a partial analysis of ATP, since we are necessarily excluding relevant issues in international taxation (e.g. lack of reliable coverage of permanent establishments in publicly available information), due to data constraints. In this light, the results of the study should be interpreted with some caution.
2.2 Main channels and defining features of aggressive tax planning The empirical economic literature identifies different channels used by MNEs to lower their corporate tax burden. A recent survey by Heckemeyer and Overesch (2017), identifies two main strategies: i) the use of both internal and external debt and ii) the use of transfer pricing and licensing of intellectual property.
3Overesch (2016) distinguishes along the same line, but also separates the relocation of intellectual property and the corresponding use of royalty payments from general strategic transfer pricing. Additionally, Overesch (2016) discusses tax reducing repatriation strategies as a part of tax planning by MNEs. The restructuring of the corporate group in order to benefit from bilateral tax treaties is also discussed under the term treaty shopping.
4Furthermore, the tax law literature has a stronger focus on more complicated ATP structures, and also stresses the importance of hybrid structures. The European Commission (2012) and consequently the ATP study also refer to this channel as
“mismatch” highlighting that the same transaction or entity is legally treated differently in two countries.
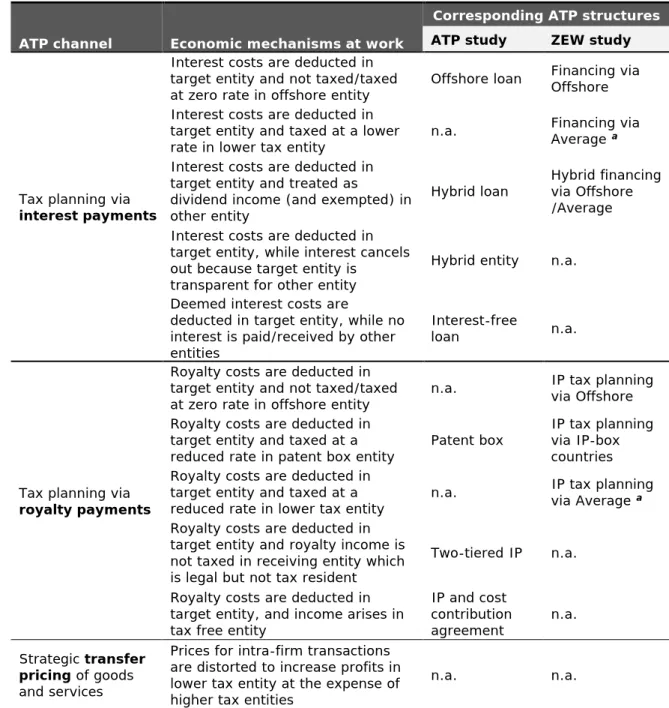
We group the channels into three broad categories based on the main mechanism at work. Broadly following the logic of the ZEW study, Table 1 summarises the relation between the three ATP channels and the specific ATP structures.
53
Dharmapala (2014) reviews similar empirical evidence with a focus on the BEPS initiative and has a much stronger focus on profit shifting.
4
See also Avi-Yonah and Panayi (2010) for a discussion about treaty shopping.
5
We present the main ATP channels and examples of specific ATP structures in the main text and
refer interested readers to the more detailed description in the Appendix A.
Table 1: ATP, main mechanisms and corresponding ATP structures
ATP channel Economic mechanisms at workCorresponding ATP structures ATP study ZEW study
Tax planning via
interest paymentsInterest costs are deducted in target entity and not taxed/taxed
at zero rate in offshore entity Offshore loan Financing via Offshore Interest costs are deducted in
target entity and taxed at a lower
rate in lower tax entity n.a. Financing via Average
aInterest costs are deducted in
target entity and treated as
dividend income (and exempted) in other entity
Hybrid loan Hybrid financing via Offshore /Average Interest costs are deducted in
target entity, while interest cancels out because target entity is
transparent for other entity
Hybrid entity n.a.
Deemed interest costs are
deducted in target entity, while no interest is paid/received by other entities
Interest-free
loan n.a.
Tax planning via
royalty paymentsRoyalty costs are deducted in target entity and not taxed/taxed
at zero rate in offshore entity n.a. IP tax planning via Offshore Royalty costs are deducted in
target entity and taxed at a
reduced rate in patent box entity Patent box IP tax planning via IP-box countries Royalty costs are deducted in
target entity and taxed at a
reduced rate in lower tax entity n.a. IP tax planning via Average
aRoyalty costs are deducted in
target entity and royalty income is not taxed in receiving entity which is legal but not tax resident
Two-tiered IP n.a.
Royalty costs are deducted in target entity, and income arises in tax free entity
IP and cost contribution
agreement n.a.
Strategic transfer
pricing of goodsand services
Prices for intra-firm transactions are distorted to increase profits in lower tax entity at the expense of higher tax entities
n.a. n.a.
Notes: a TheZEW study uses the average rates as a technical assumption. But without a lower tax rate the mechanism of this ATP channel does not deliver tax benefits. See also the higher average tax burden under this channel in Table 2.
Source: Own considerations based on ZEW study (2016) and ATP study (2015)
The ATP channel based on income shifting through interest payments is at the
heart of several ATP structures presented in the ATP study and the ZEW study. The most
obvious ATP structures falling into this category are the offshore loan ATP structure and
the corresponding financing via offshore/average structures. Additionally, we include
the hybrid loan ATP structures, the hybrid entity ATP structure and the interest free loan
ATP structure in the income shifting through interest payments channel. The main
reason is that the tax base in the target entity is reduced via the interest deduction. In
contrast to the offshore/average loan ATP structures the interest payments are not
received in a lower or no tax country. Due to a legal mismatch of the treatment of the interest payment in the receiving entity, the financial flow is exempted from taxation.
The ATP channel based on the income shifting through royalty payments have in common that the tax base in the target entity is reduced through a deduction of royalty costs. The tax saving in most ATP structures using this channel results from lower taxation of the royalty payments in the receiving lower tax entity. This lower tax burden on the royalty received is either due to a generally lower corporate tax rate or to a specific regime benefitting income from intellectual property (a patent box).
The ATP channel of using strategic transfer pricing of goods and services for internal transactions is not directly presented in any of the specific ATP structures in the ATP or the ZEW study. By mispricing internal transactions, corporate tax base is reallocated to jurisdictions where lower taxes are levied.
Finally, it is worth noting that treaty shopping is not included as separate ATP channel in this study. Under the term treaty shopping, we subsume the diverting of dividend flows with the aim to reduce/eliminate the tax burden on the repatriation of the profits.
Nevertheless, treaty shopping may remain an important part of offshore ATP structures since the repatriation of profits from non-Member States may still be subject to withholding taxation.
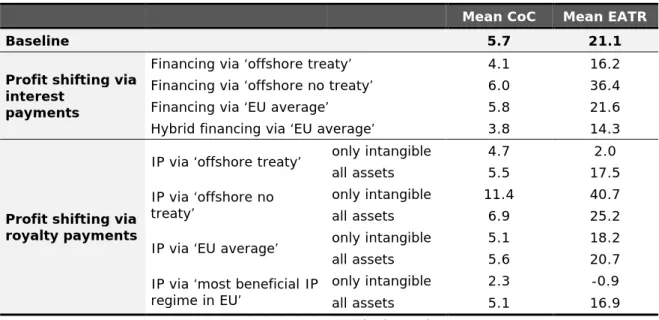
Before discussing the different channels in more detail Table 2 summarises the main findings regarding the impact of profit shifting on the Cost of Capital (CoC) and the Effective Average Tax Rate (EATR) of the ZEW study (2016).
Table 2: Cost of Capital and Effective Tax Rate in ZEW study (2016)
Mean CoC Mean EATR
Baseline 5.7 21.1
Profit shifting via interest
payments
Financing via ‘offshore treaty’ 4.1 16.2
Financing via ‘offshore no treaty’ 6.0 36.4
Financing via ‘EU average’ 5.8 21.6
Hybrid financing via ‘EU average’ 3.8 14.3
Profit shifting via royalty payments