S1
Supporting Information
Alginate-Phenylboronic Acid Based Hydrogels
S2
Table of Contents
page
1. Self-healing and stretchable hydrogels in literature……….. S3
2. NMR spectra………... S6
3. FT-IR spectroscopy……...………... S7
4. Additional SEM images...………... S8
5. Additional stimuli-responsive behavior of 7-35………... S9
6. Additional stretching experiments……… S10
7. Additional rheological measurements………. S13
8. Additional cell release images……….. S16
9. References……….……….. S17
S3
1. Self-healing and stretchable hydrogels in literature
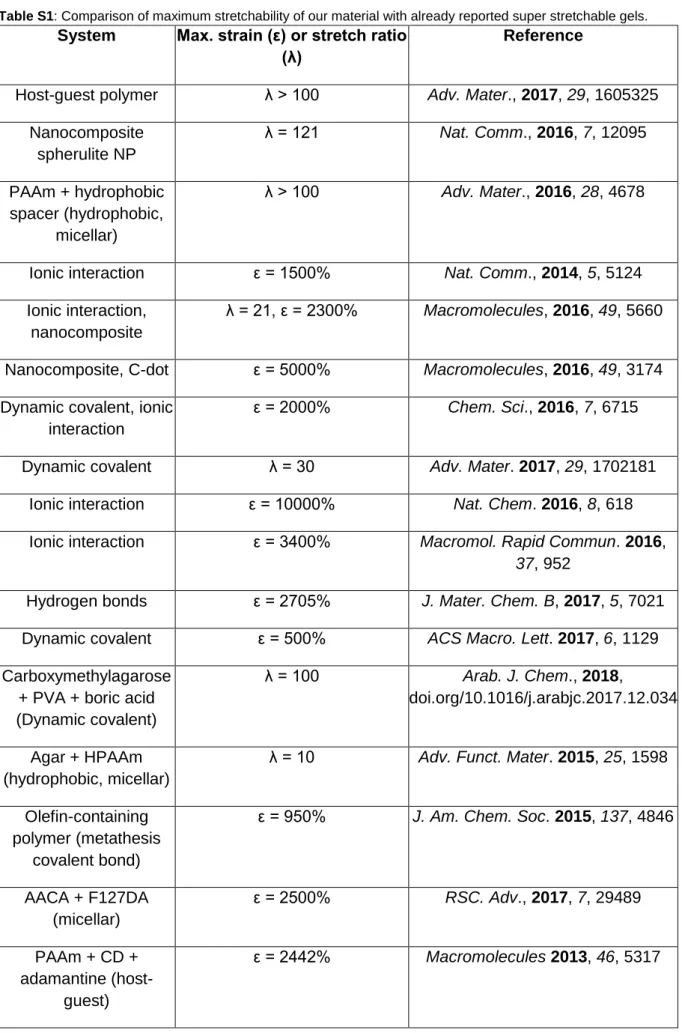
Table S1: Comparison of maximum stretchability of our material with already reported super stretchable gels.
System Max. strain (ε) or stretch ratio (λ)
Reference
Host-guest polymer λ > 100 Adv. Mater., 2017, 29, 1605325 Nanocomposite
spherulite NP
λ = 121 Nat. Comm., 2016, 7, 12095
PAAm + hydrophobic spacer (hydrophobic,
micellar)
λ > 100 Adv. Mater., 2016, 28, 4678
Ionic interaction ε = 1500% Nat. Comm., 2014, 5, 5124 Ionic interaction,
nanocomposite
λ = 21, ε = 2300% Macromolecules, 2016, 49, 5660
Nanocomposite, C-dot ε = 5000% Macromolecules, 2016, 49, 3174 Dynamic covalent, ionic
interaction
ε = 2000% Chem. Sci., 2016, 7, 6715
Dynamic covalent λ = 30 Adv. Mater. 2017, 29, 1702181
Ionic interaction ε = 10000% Nat. Chem. 2016, 8, 618 Ionic interaction ε = 3400% Macromol. Rapid Commun. 2016,
37, 952
Hydrogen bonds ε = 2705% J. Mater. Chem. B, 2017, 5, 7021 Dynamic covalent ε = 500% ACS Macro. Lett. 2017, 6, 1129 Carboxymethylagarose
+ PVA + boric acid (Dynamic covalent)
λ = 100 Arab. J. Chem., 2018,
doi.org/10.1016/j.arabjc.2017.12.034
Agar + HPAAm (hydrophobic, micellar)
λ = 10 Adv. Funct. Mater. 2015, 25, 1598
Olefin-containing polymer (metathesis
covalent bond)
ε = 950% J. Am. Chem. Soc. 2015, 137, 4846
AACA + F127DA (micellar)
ε = 2500% RSC. Adv., 2017, 7, 29489
PAAm + CD + adamantine (host-
guest)
ε = 2442% Macromolecules 2013, 46, 5317
S4
PAA + POSS (micellar) ε > 4200% Chin. J. Pol. Sci., 2016, 34, 185 PAAm + alginate (ionic) λ > 20 Nature 2012, 489, 133
PDMA + stearyl methacrylate (micellar)
λ =43 Eur. Polym. J. 2014, 59, 113
PNIPAm-PAM-clay (nanocomposite)
ε = 2000% Soft Matter, 2014, 10, 3506
Polyelectrolytes (ionic interaction)
ε = 800% Adv. Mater. 2015, 27, 2722
A6ACA with flexible side chains (hydrogen
bonds)
ε = 66% PNAS 2012, 109, 4383
PNAGA-PAMPS + PEDOT/PSS (hydrogen
bonds)
ε = 1710% Sci. Rep., 2017, 7, 41566
Alginate-catechol + borax (dynamic covalent chemistry)
ε = 400% ACS Appl. Mater. Interfaces 2017, 9, 15541
PAA + vinyl hybrid silica NPs (hydrogen bonds)
ε > 3700% Nat. Commun., 2015, 6, 10310
GO PAA
nanocomposite + Fe3+
(ionic interaction)
ε = 2980% J. Mater. Chem. B, 2015, 3, 4001
VSNP-PAA nano brush hydrogels + Fe3+ (ionic
interaction)
ε = 2300% Soft Matter, 2015, 11, 4235
Polyelectrolyte NaSS + MPTC (ionic
interaction)
λ = 25 Soft Matter, 2015, 11, 9355
PAA + Fe3+ (ionic interaction)
ε = 1500% Adv. Mater. 2017, 29, 1700533
GO-PAACA composite (ionic interaction, hydrogen bonds)
ε = 1190 % Chem. Mater. 2013, 25, 3357
Poly(N- acryloylgycinamide)
PNAGA (hydrogen bonds)
ε = 1400% Adv. Mater. 2015, 3566
S5 Polyelectrolyte MPTC +
NaSS (ionic interaction)
ε = 700% ACS Macro Lett. 2015, 4, 961
Polydopamine- polyacrylamide (PDA- PAM) (hydrogen bonds
+ pi-pi stacking)
λ = 31, ε = 3300% NPG Asia Materials, 2017, 9, 372 (adhesion property)
GO-P(AM-co-DAC) (ionic interaction, hydrogen bonds)
ε = 1700% ACS Appl. Mater. Interfaces 2017, 9, 38052
K-carrageenan/PAAm (sol-gel transition)
ε = 2000% ACS Appl. Mater. Interfaces 2017, 9, 26429
PEO with aldehyde or acylhydrazine (dynamic
covalent chemistry, hydrophobic/micellar
interaction)
λ = 117 ACS Macro Lett. 2017, 6, 881
Alginate with phenyl boronic acid derivative
ε >16000% Material reported in this thesis
S6 2. NMR spectra
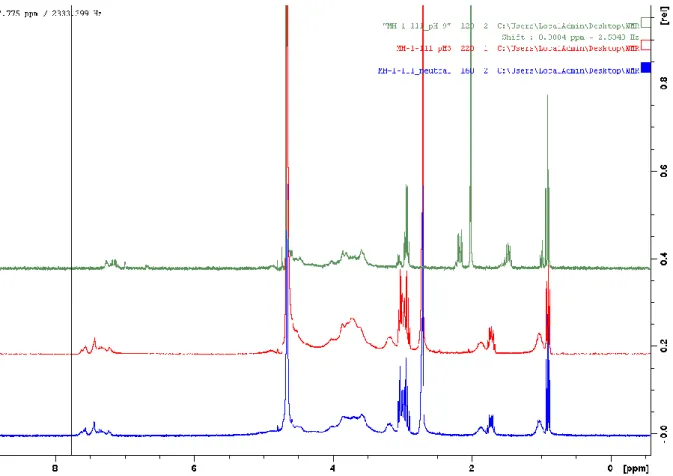
Figure S1. 1H NMR spectrum of Alg-PBA at different pH, blue: pH 7, red: pH 3, green: pH 10.
S7 3. FT-IR spectroscopy
4000 3500 3000 2500 2000 1500 1000 30
40 50 60 70 80 90 100
Tr an smitta nce
Wavenumber (cm-1) AlgPBAhydrogel7 AlgPBAsolid Algsolid 7Xerogel 3Xerogel PBA
1500 1000
70 80 90 100
Transmittance (%)
Wavenumber (cm
-1)
Alg-PBA alginate
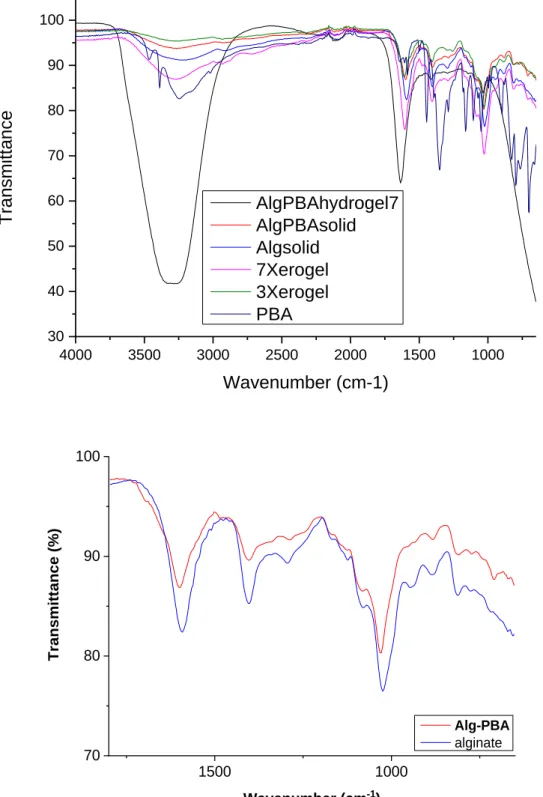
Figure S2. FTIR spectra of a) Alg-PBA hydrogel, solid and xerogel (3-75 and 7-35), unmodified alginate and 3-phenylboronic acid.
S8 4. Additional SEM images
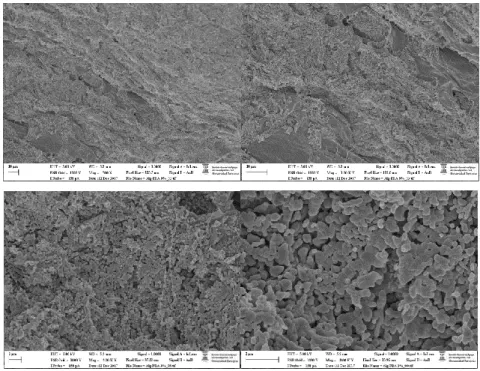
Figure S3. SEM images of the xerogel prepared by freeze-drying of the 3-75 hydrogel.
Figure S4. SEM images of the xerogel prepared by freeze-drying of the 7-35 hydrogel.
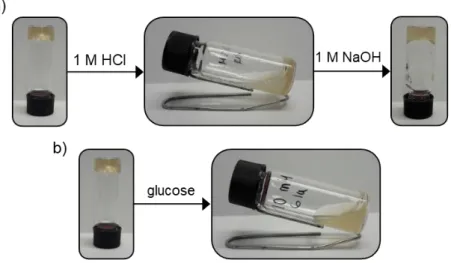
S9 5. Additional stimuli-responsive behavior of 7-35
Figure S5. Stimuli-responsiveness of 7-35, a) response to pH, b) response to glucose.
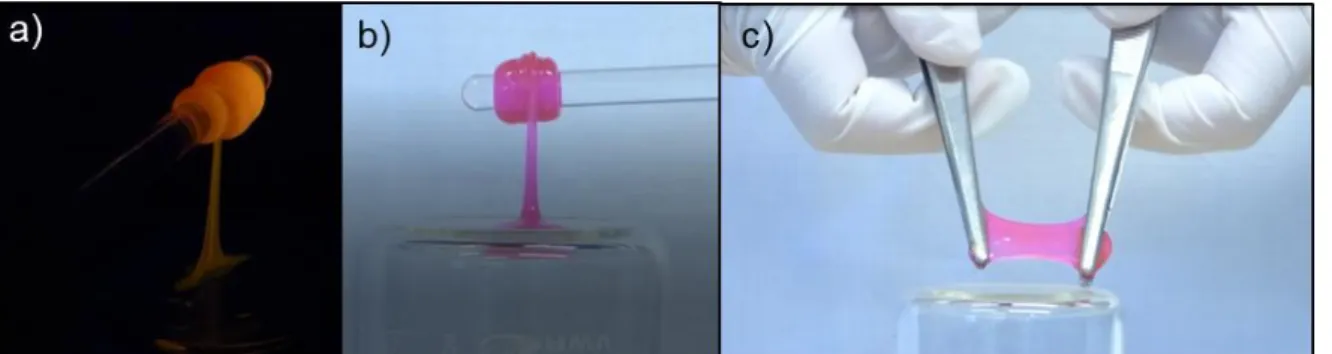
S10 6. Additional stretching experiments
Figure S6. Stretchability of 7-35 visualized after dye-doping with rhodamine B, a) under UV, b) under visible light.
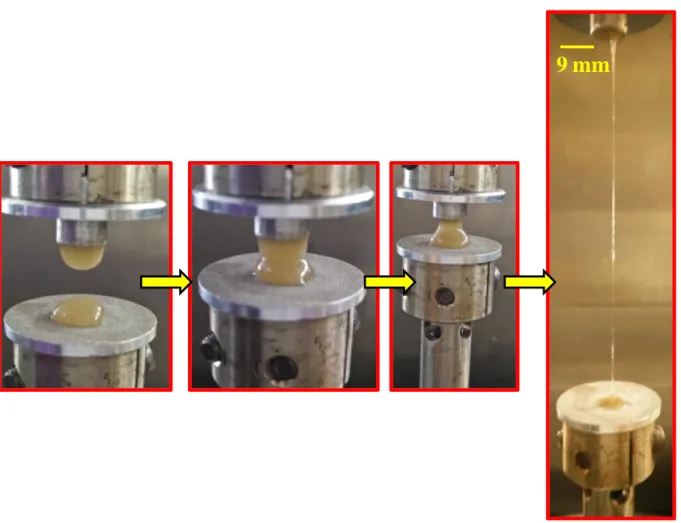
Figure S7. Photographs of stretching the 7-35 gel. The centre portion of the gel shows a significant reduction in the area due to necking.
S11
Figure S8. Plot of true stress as a function of stretch ratio (λ) scaled with a stretching rate dependent scale factor, 𝑎𝑅. 𝑎𝑅 values of 0.1, 1 and 10 mm s-1 strain rate curves are 1, 0.69 and 0.44 respectively.
Figure S9. Photographs of the self-healing experiment and stretching of the healed gel.
1 10 100
10
210
310
410
510
6 t (Pa )
a
R10 mm/s 1 mm/s 0.1 mm/s
9 mm
S12
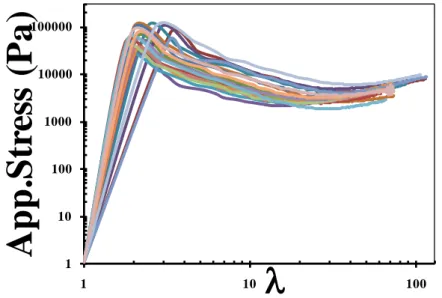
Figure S10. Self-healing of 7-35 gel. Tensile study on self-healed sample: the fresh gel and the gel self-healed for a minute showed almost similar extensional behavior.
Figure S11. Cyclic study on self-healed gel. Material did not show any failure even after 20 cycles of stretching to λ ~100.
1 10 100
10
110
210
310
410
5
t (P a)
Original
1 minute self healing
1 10 100 1000 10000 100000
1 10 100
A p p .S tr es s (P a )
S13 7. Additional rheological measurements
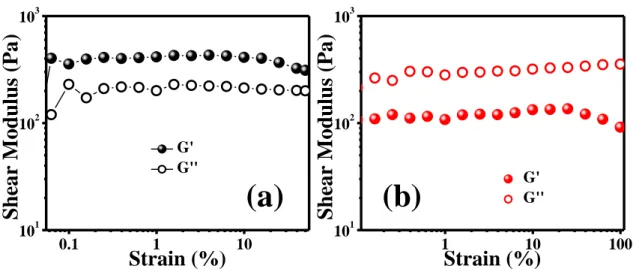
Figure S12. Strain sweep experiments on a) 3-75 gel and b) 7-35 gel. The experiments were performed at 1 rad s-1.
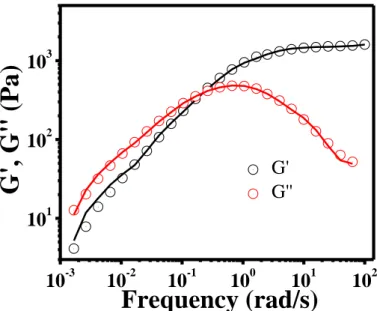
Figure S13. Linear viscoelastic response of the gels, a) frequency dependent G' and G" for different gel compositions. Solid moduli are plotted as filled symbols while loss moduli are plotted as open symbols, b) master curve obtained after normalizing the moduli using Gc and frequency using ωc.
The LVE data for all the gels are qualitatively similar and can be collapsed onto a single master curve by shifting along the modulus and frequency axes (Figure S12b). The horizontal and vertical shift factors, relative to the reference sample (3-75) are given Table S2. Excellent overlap is obtained, with vertical and horizontal shift factors varying by factors of 6.6 and 60, respectively, between 3-75 and 7-35 gels (Table S2). The master curve was fitted in Gʹ and Gʺ, spanning over four decades of frequency with a multiple mode Maxwell model:
𝐺
′= ∑ (
𝐺𝑘𝜔2𝜏𝑘21+𝜔2𝜏𝑘2
) and 𝐺
′′= ∑ (
𝐺𝑘𝜔𝜏𝑘1+𝜔2𝜏𝑘2
), (eq. S1) (𝐺
𝑘and 𝜏
𝑘are fitting parameters)
We observe that the master curve is fitted well with 4 modes (SI Table S3, Figure S14).
11 10 100
10
110
210
3Sh ear M odu lus (Pa)
Strain (%)
G' G''
0.1 1 10
10
110
210
3Sh ear M odu lus (Pa)
Strain (%)
G' G''
(a) (b)
S14
Table S2: Crossover frequency, frequency shift and modulus shift factors calculated for different gel formulations.
Sample name:
(Alg-PBA wt.%- NaOH amount in µl)
Crossover frequency,
ω
c(rad/s)
Crossover modulus,
𝐺
𝑐(Pa)
Shift parameters
Frequency shift Modulus shift
3-75 0.25 360 1 1
3-35 1 425 0.25 1.14
5-75 6 1100 0.0417 0.4
7-35 15 2550 0.0167 0.15
Figure S14. Maxwell fit on the master curve. The solid line represents the fit.
Table S3. Parameters obtained by fitting discrete relaxation spectrum function to the shear rheology data.
G
k(Pa) 𝝉
𝒌(s)
5162 0.02
2603 0.08
775 0.36
598 3.1
10
-310
-210
-110
010
110
210
110
210
3G', G' ' (Pa)
Frequency (rad/s)
G'
G''
S15
Note: Although the materials are termed “gel”, they can be classified as Maxwell fluids.
S16 8. Additional cell release images
Figure S15. Release of encapsulated HeLa cells after a) 24 h and b) 48 h of incubation.