A TLAS-CONF-2021-008 27 Mar ch 2021
ATLAS CONF Note
ATLAS-CONF-2021-008
March 23, 2021
Search for new phenomena in 𝒑𝒑 collisions in final states with tau leptons, 𝒃-jets, and missing transverse momentum with the ATLAS detector
The ATLAS Collaboration
A search for new phenomena in final states with hadronically decaying tau leptons, 𝑏 -jets, and missing transverse momentum is presented. The analyzed dataset comprises 𝑝𝑝 collision data at a center-of-mass energy of
√
𝑠 = 13 TeV with an integrated luminosity of 139 fb
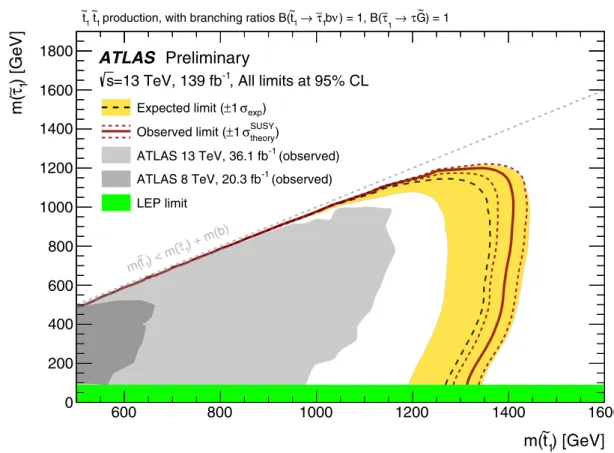
−1, delivered by the Large Hadron Collider and recorded with the ATLAS detector from 2015 to 2018. The observed data are compatible with the expected Standard Model background. The results are interpreted in simplified models for two different scenarios. The first model considers pair production of supersymmetric top squarks, each of which decays into a 𝑏 -quark, a neutrino and a supersymmetric tau slepton. Each tau slepton in turn decays into a tau lepton and a nearly massless supersymmetric gravitino. Within this model, top-squark masses of 1.4 TeV can be excluded at the 95 % confidence level over a wide range of tau-slepton masses. The second model considers pair production of scalar leptoquarks with decays into third-generation leptons and quarks. Depending on the branching fraction into charged leptons, leptoquarks with masses up to around 1.25 TeV can be excluded at the 95 % confidence level. In addition, model-independent upper limits are set on the cross section of processes beyond the Standard Model.
© 2021 CERN for the benefit of the ATLAS Collaboration.
Reproduction of this article or parts of it is allowed as specified in the CC-BY-4.0 license.
1 Introduction
The Standard Model (SM) of particle physics has been verified to high precision. Despite its success, several observations have been made which have exposed the theory’s shortcomings in various aspects and fostered new theoretical ideas. Supersymmetry (SUSY) [1–7] is a framework for models that extend the symmetries underlying the SM by introducing superpartners of the known bosons and fermions with the same quantum numbers but a spin difference of half a unit. These models can address the gauge hierarchy problem [8–11]. When conservation of 𝑅 -parity [12] is assumed, the lightest supersymmetric particle is stable and may provide a candidate particle for the cold dark matter component of the universe [13, 14].
The introduction of supersymmetric partner particles can also modify the renormalisation group equations in such a way that the coupling constants of the SM electromagnetic, weak and strong interaction meet in one point at some high energy scale as expected in a grand unified theory [15]. Another possibility to extend the SM is to embed the SM symmetry group in an overarching symmetry group, such as SU(5) [16]
in grand unification, which gives rise to a new class of bosons that carry non-zero baryon and lepton quantum numbers and are charged under all SM gauge groups. These hypothetical leptoquarks (LQ) appear in a variety of SM extensions [17–21] and would provide an explanation for the structural similarities of the quark and lepton sectors in the SM. Processes mediated by the exchange of LQs can violate lepton-flavor universality and have been proposed as an explanation [22–28] for the deviations from the SM predictions seen by many experiments in measurements of 𝐵 -meson decays [29–37].
In this note, a search for physics beyond that described in the Standard Model is conducted using events with final states with one or more hadronically decaying tau leptons, one or more 𝑏 -tagged jets and large missing transverse momentum. This is a signature that is sensitive to models in which the new particles preferentially decay into third-generation SM particles. Two benchmark signal models are studied. The first model considers the production of supersymmetric partner states of the third-generation SM particles, the second model foresees scalar leptoquarks that decay into third-generation SM particles. The full Run-2 dataset of proton–proton ( 𝑝 𝑝 ) collisions recorded with the ATLAS detector at the Large Hadron Collider (LHC) is analyzed. This dataset corresponds to an integrated luminosity of 139 fb
−1, taken from 2015 through 2018, at a center-of-mass energy of
√
𝑠 = 13 TeV.
The investigated SUSY signal model is motivated by gauge-mediated SUSY breaking (GMSB) [38–40]
and natural gauge mediation (nGM) [41]. In this 𝑅 -parity conserving scenario, only three SUSY particles are assumed to be sufficiently light to be relevant: the lighter scalar partner of the top quark ˜ 𝑡
1
(top squark or stop), the lighter scalar partner of the tau lepton e 𝜏
1
(tau slepton or stau), and the spin-3 / 2 partner of the graviton, the gravitino ˜ 𝐺 . The top squark is assumed to be the lightest squark [42, 43] and directly pair-produced through the strong interaction. The gravitino is assumed to be almost massless, making it the lightest SUSY particle (LSP) in this scenario. The search strategy is optimized using a simplified model [44–46] with this limited SUSY particle content, the model parameters being the scalar-fermion masses 𝑚 ( 𝑡 ˜
1
) and 𝑚 ( e 𝜏
1
) . The decay chain is illustrated in the left diagram in Fig. 1: a three-body decay proceeding through an off-shell chargino ˜ 𝑡
1
→ 𝑏 e
𝜏
1𝜈
𝜏followed by e 𝜏
1
→ 𝜏 𝐺 ˜ . This model is referred to as the “stop-stau” signal model in the following. When the LSP is the gravitino, direct decays of SUSY particles into the gravitino LSP (plus a SM particle) are very unlikely due to its weak coupling, except for the next-to-lightest supersymmetric particle, which in 𝑅 -parity conserving scenarios has no other option than to eventually decay into the gravitino LSP. Other SUSY models which instead assume the lightest neutralino ˜ 𝜒
01
to be the LSP are not studied here, as this would favor a high branching fraction of ˜ 𝑡
1
→ 𝑡 𝜒 ˜
0 1;
this case has been studied elsewhere [47–49].
˜ t
˜ t
˜ τ
˜ τ p
p
b ν
G ˜ τ
b ν
G ˜ τ
LQ
u3LQ
u3p
p
ν, τ t, b
ν, τ
t, b
LQ
d3LQ
d3p
p
ν, τ b, t
ν, τ
b, t
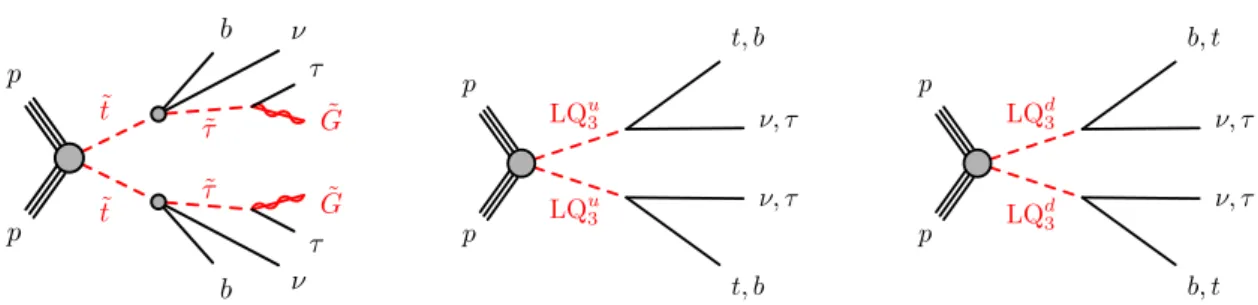
Figure 1: Diagrams illustrating the production and decay of particles considered in the simplified models for the supersymmetric scenario (left) and the scenarios with scalar leptoquarks of charge
23𝑒 (middle) and −
13
𝑒 (right).
Previous searches for this model have been conducted by the ATLAS collaboration using 20 fb
−1of
√
𝑠 = 8 TeV data taken in Run 1 [50] and 36.1 fb
−1of
√
𝑠 = 13 TeV data taken in Run 2 of the LHC [51].
No significant excess was observed in either of these searches, and thus limits were set on the masses of the top squark and tau slepton. These limits exclude top-squark masses of up to 1.16 TeV and tau-slepton masses of up to 1.0 TeV at the 95 % confidence level. The CMS collaboration has published a related search in a simplified model where the LSP is the lightest neutralino ˜ 𝜒
01
instead of the gravitino [52]. This search is based on an integrated luminosity of 77 . 2 fb
−1and sets exclusion limits at the 95 % confidence level on the top-squark mass of up to 1.1 TeV for a nearly massless neutralino.
The previous ATLAS Run-2 search in Ref. [51] made use of two event categories: events where one of the two tau leptons decays leptonically and the other hadronically were considered in addition to events where both tau leptons decay hadronically. While the branching fraction is the same for both categories, the leptonic decay of the tau lepton yields one neutrino more, which washes out the kinematic distributions and on average leads to a lower energy fraction carried by the lepton compared to the visible decay products from a hadronic tau-lepton decay. Both effects together significantly reduce the discriminative power of the selection requirements. As the sensitivity of the search is thus dominated by the category where both tau leptons decay hadronically, in this note only events with hadronically decaying tau leptons are considered.
These events are split in two event categories (channels): one category selects events with at least two hadronically decaying tau leptons but no lighter leptons, at least one 𝑏 -jet and large missing transverse momentum 𝐸
missT
(di-tau channel). The other category selects events with exactly one hadronically decaying tau lepton, no electrons or muons, at least two 𝑏 -jets and large 𝐸
missT
(single-tau channel). The latter channel extends the sensitivity by covering the signal parameter space where the tau slepton is relatively light and one of the soft tau leptons easily escapes detection. Importantly, it also provides good sensitivity to events with pair-produced leptoquarks that decay into third-generation particles, which corresponds to the second benchmark model.
The second benchmark model used for the interpretation of the search results considers pair production of scalar leptoquarks. It assumes that these only couple to third-generation quark–lepton pairs, following the minimal Buchmüller–Rückl–Wyler model [53]. In addition to the coupling to the third fermion generation that is probed in this analysis, leptoquarks would need to have cross-generational couplings in order to explain the anomalies observed in 𝐵 -meson decays. The couplings in the Yukawa-type interaction of the leptoquarks with the quark–lepton pair are determined by two parameters: a common coupling strength 𝜆 and an additional parameter 𝛽 , with the coupling to a quark and a charged lepton given by
√
𝛽𝜆 , and the coupling to a quark and a neutrino by √︁
1 − 𝛽𝜆 . The search is carried out for both up-type leptoquarks
with fractional charge 𝑄 ( LQ
u3) = + 2 / 3 𝑒 and decays LQ
u3→ 𝑡 𝜈
𝜏/ 𝑏 𝜏 , and down-type leptoquarks with
𝑄 ( LQ
d3) = − 1 / 3 𝑒 and decays LQ
d3→ 𝑏 𝜈
𝜏/ 𝑡 𝜏 . The production and decay of the leptoquarks are illustrated in
Fig. 1. The model parameters are the leptoquark mass 𝑚 ( LQ
u/d3) and the branching fraction 𝐵 ( LQ
u/d3→ 𝑞ℓ ) into a quark and a charged lepton, which, except for kinematic effects arising from the mass differences of the decay products, is equal to 𝛽 . For a branching fraction 𝐵 ( LQ
u/d3→ 𝑞ℓ ) ∼ 0 . 5, most of the decays of the pair of third-generation leptoquarks yield a final state with one tau lepton, two 𝑏 -jets and large 𝐸
missT
from the tau neutrino. This signature matches that of the second channel of the search presented in this note, which presents unique coverage of leptoquark masses at 𝐵 ( LQ
u/d3→ 𝑞ℓ ) ∼ 0 . 5, but also has good sensitivity to a wide range of smaller or larger branching fractions.
The LQ model is the same as was used in a previous ATLAS paper [54] detailing a search for third-generation leptoquarks based on 36.1 fb
−1of data taken at
√
𝑠 = 13 TeV. This earlier paper comprises a dedicated reoptimisation of the ATLAS search for di-higgs production as well as four reinterpretations of ATLAS SUSY searches, one of which is the previous iteration of the stop-stau search [51]. Leptoquark masses below at least 0.8 TeV are excluded at intermediate values of the branching fraction 𝐵 ( LQ
u/d3→ 𝑞ℓ ) , with the lower limit increasing at both small and large 𝐵 ( LQ
u/d3→ 𝑞ℓ ) up to 0 . 96 (1.02) TeV at 𝐵 ( LQ
u/d3→ 𝑞ℓ ) = 0 (1) for down-type (up-type) leptoquarks. Two recent ATLAS searches for top or bottom squark pair production have been reinterpreted in the same up-type or down-type leptoquark model, respectively [47, 55]. Another recent dedicated ATLAS search for pair-produced leptoquarks combines several event categories which all require at least one hadronically decaying tau lepton plus at least one electron or muon [56] and are complementary to the final states considered in this note. It targets the down-type leptoquark model and excludes leptoquark masses up to 1.43 TeV assuming 𝐵 ( LQ
u/d3→ 𝑞ℓ ) = 1 and up to 1.22 TeV assuming 𝐵 ( LQ
u/d3→ 𝑞ℓ ) = 0 . 5. The CMS collaboration has published a search for singly and pair-produced scalar and vector leptoquarks coupling to third-generation fermions based on the full Run-2 dataset [57], excluding scalar pair-produced leptoquarks with masses up to around 1.0 TeV, and several searches for third-generation leptoquarks based on 35 . 9 fb
−1of Run-2 data [58–62].
2 ATLAS detector
The ATLAS experiment [63–65] at the LHC is a multipurpose particle detector with a forward–backward symmetric cylindrical geometry and a near 4 𝜋 coverage in solid angle.
1It consists of an inner tracking detector surrounded by a thin superconducting solenoid providing a 2 T axial magnetic field, electromagnetic and hadronic calorimeters, and a muon spectrometer. The inner tracking detector covers the pseudorapidity range | 𝜂 | < 2 . 5. It consists of silicon pixel, silicon microstrip, and transition radiation tracking detectors.
Lead/liquid-argon (LAr) sampling calorimeters provide electromagnetic (EM) energy measurements with high granularity. A steel/scintillator-tile hadronic calorimeter covers the central pseudorapidity range ( | 𝜂 | < 1 . 7). The endcap and forward regions are instrumented with LAr calorimeters for EM and hadronic energy measurements up to | 𝜂 | = 4 . 9. The muon spectrometer surrounds the calorimeters and is based on three large superconducting air-core toroidal magnets with eight coils each. The muon spectrometer includes a system of precision tracking chambers and fast detectors for triggering. A two-level trigger system is used to select events. The first-level trigger is implemented in hardware and uses a subset of the detector information to accept events at a rate below 100 kHz. This is followed by a software-based
1
ATLAS uses a right-handed coordinate system with its origin at the nominal interaction point (IP) in the center of the detector and the 𝑧 -axis along the beam pipe. The 𝑥 -axis points from the IP to the center of the LHC ring, and the 𝑦 -axis points upwards. Cylindrical coordinates ( 𝑟 , 𝜙 ) are used in the transverse plane, 𝜙 being the azimuthal angle around the 𝑧 -axis.
The pseudorapidity is defined in terms of the polar angle 𝜃 as 𝜂 = − ln tan ( 𝜃 / 2 ) . Angular distance is measured in units of Δ 𝑅 ≡ √︁
( Δ 𝜂 )
2+ (Δ 𝜙 )
2.
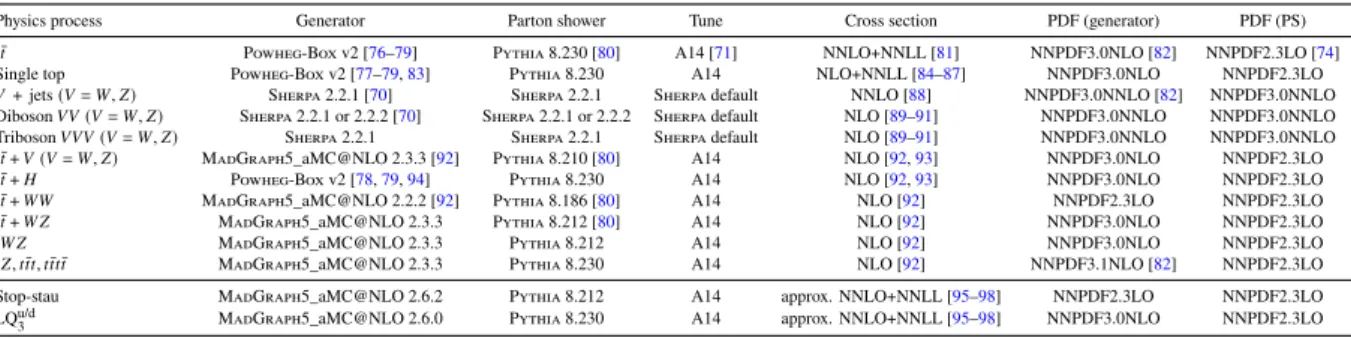
Table 1: Simulated background and signal samples with the corresponding matrix element and parton shower (PS) generators. Also, the cross-section order in 𝛼
S
used to normalize the event yield and the PDF sets used in the generator and PS simulation are given.
Physics process Generator Parton shower Tune Cross section PDF (generator) PDF (PS)
𝑡𝑡¯ Powheg-Box v2 [76–79] Pythia 8.230 [80] A14 [71] NNLO+NNLL [81] NNPDF3.0NLO [82] NNPDF2.3LO [74]
Single top Powheg-Box v2 [77–79,83] Pythia 8.230 A14 NLO+NNLL [84–87] NNPDF3.0NLO NNPDF2.3LO
𝑉+jets(𝑉=𝑊 , 𝑍) Sherpa 2.2.1 [70] Sherpa 2.2.1 Sherpa default NNLO [88] NNPDF3.0NNLO [82] NNPDF3.0NNLO
Diboson𝑉 𝑉(𝑉=𝑊 , 𝑍) Sherpa 2.2.1 or 2.2.2 [70] Sherpa 2.2.1 or 2.2.2 Sherpa default NLO [89–91] NNPDF3.0NNLO NNPDF3.0NNLO Triboson𝑉 𝑉 𝑉(𝑉=𝑊 , 𝑍) Sherpa 2.2.1 Sherpa 2.2.1 Sherpa default NLO [89–91] NNPDF3.0NNLO NNPDF3.0NNLO
𝑡𝑡¯+𝑉(𝑉=𝑊 , 𝑍) MadGraph5_aMC@NLO 2.3.3 [92] Pythia 8.210 [80] A14 NLO [92,93] NNPDF3.0NLO NNPDF2.3LO
𝑡𝑡¯+𝐻 Powheg-Box v2 [78,79,94] Pythia 8.230 A14 NLO [92,93] NNPDF3.0NLO NNPDF2.3LO
𝑡𝑡¯+𝑊 𝑊 MadGraph5_aMC@NLO 2.2.2 [92] Pythia 8.186 [80] A14 NLO [92] NNPDF2.3LO NNPDF2.3LO
𝑡𝑡¯+𝑊 𝑍 MadGraph5_aMC@NLO 2.3.3 Pythia 8.212 [80] A14 NLO [92] NNPDF3.0NLO NNPDF2.3LO
𝑡𝑊 𝑍 MadGraph5_aMC@NLO 2.3.3 Pythia 8.212 A14 NLO [92] NNPDF3.0NLO NNPDF2.3LO
𝑡 𝑍 , 𝑡¯𝑡 𝑡 , 𝑡¯𝑡 𝑡¯𝑡 MadGraph5_aMC@NLO 2.3.3 Pythia 8.230 A14 NLO [92] NNPDF3.1NLO [82] NNPDF2.3LO
Stop-stau MadGraph5_aMC@NLO 2.6.2 Pythia 8.212 A14 approx. NNLO+NNLL [95–98] NNPDF2.3LO NNPDF2.3LO
LQu/d3 MadGraph5_aMC@NLO 2.6.0 Pythia 8.230 A14 approx. NNLO+NNLL [95–98] NNPDF3.0NLO NNPDF2.3LO
high-level trigger that reduces the accepted event rate to 1 kHz on average depending on the data-taking conditions.
3 Data and simulated event samples
The dataset used in this analysis was collected with the ATLAS detector in proton–proton collisions provided by the LHC during its second run from 2015 to 2018 at a center-of-mass energy of
√
𝑠 = 13 TeV with a minimum separation of 25 ns between consecutive crossings of proton bunches from the two beams.
Events are selected with triggers on missing transverse momentum, and data-quality requirements are applied to ensure that all elements of the detectors were operational during data-taking. The total integrated luminosity amounts to 139 fb
−1with an uncertainty of 1.7 % [66], obtained using the LUCID-2 detector [67]
for the primary luminosity measurements.
Monte Carlo (MC) simulation is used to generate samples of collision events, which model the expected kinematics of the investigated signal and SM background processes. Table 1 gives a detailed summary of the generation of the different MC samples used in the analysis. It lists the generators, the order of the cross-section computation, the parton distribution function (PDF) sets, and the sets of tuned parameters for the parton-shower (tune). For background processes, the detector response is simulated using the full modeling of the ATLAS detector in Geant4 [68], while for the signal samples a faster variant of the simulation is used that relies on a parameterised response of the calorimeters [69]. Except for samples produced with Sherpa [70], which uses a dedicated parton-shower (PS) modeling and parameter tune developed by the Sherpa authors, the parton shower and hadronization simulation for all samples uses the A14 tune [71], and the EvtGen program [72] is used to model the decays of 𝑏 - and 𝑐 -hadrons in signal samples and background events. The effect of multiple interactions in the same and neighboring bunch crossings (pile-up) is modeled by overlaying simulated inelastic 𝑝 𝑝 events generated with Pythia8.186 [73]
using the NNPDF2.3LO set of PDFs [74] and the A3 tune [75] over the original hard-scattering event.
All simulated events are processed with the same trigger, reconstruction and identification algorithms as
the data, and are weighted to match the observed distribution of the pile-up in data. Dedicated correction
factors are applied to simulation to account for differences in efficiencies and energy calibrations. In this
analysis, data-driven methods are applied that improve the modeling of the dominant SM background
processes by normalizing their contributions to data. These are described in Section 6.
The production of top-quark pairs, with or without an associated Higgs boson, and of single top quarks in the 𝑠 - and 𝑡 -channel or associated with 𝑊 bosons is simulated with Powheg-Box [76–79], while associated production of top-quark pairs and a vector boson 𝑉 = 𝑊 or 𝑍 , as well as other top-quark-related processes (later denoted as “other top”) with smaller contributions ( 𝑡 𝑡 ¯ + 𝑊 𝑊 , 𝑡 𝑡 ¯ + 𝑊 𝑍 , 𝑡𝑊 𝑍 , 𝑡 𝑍 , 𝑡 𝑡 𝑡 ¯ and 𝑡 𝑡 𝑡 ¯ 𝑡 ¯ ) are simulated with MadGraph5_aMC@NLO [92]. The events are interfaced to Pythia [80] to model the parton shower, hadronisation, and underlying event, using the NNPDF2.3LO set of PDFs [74]. The production of single vector boson ( 𝑉 + jets), diboson ( 𝑉 𝑉 ) and triboson ( 𝑉 𝑉 𝑉 ) events is simulated with Sherpa using the NNPDF3.0NNLO PDF set [82].
Stop-stau signal samples are produced for varying values of 𝑚
˜ 𝑡
and 𝑚
e
𝜏
. The pair production of top squarks is simulated at leading order with up to two additional partons in MadGraph5_aMC@NLO. For the decays of the SUSY particles, the top squark and the tau slepton, MadSpin [99] is used to preserve spin correlation and finite-width effects. Both decays are assumed to be prompt, i. e. the SUSY particles have a negligible lifetime. The subsequent decays as well as the hadronisation are simulated in Pythia. Cross sections are calculated including approximate next-to-next-to-leading order (NNLO) supersymmetric quantum chromodynamics (QCD) corrections, with resummation of next-to-next-to-leading logarithmic (NNLL) soft gluon terms [95–98]. The matching of matrix element and parton shower was done with the CKKW-L prescription [100, 101], with the matching scale set to one quarter of the top-squark mass.
Simulated events with pair production of scalar third-generation leptoquarks LQ
u/d3were generated at next- to-leading order (NLO) in QCD with MadGraph5_aMC@NLO, using the LQ model of Ref. [102] that adds parton showers to previous fixed-order NLO QCD calculations [103, 104], and the NNPDF3.0NLO parton distribution function set with 𝛼
S
( 𝑚
𝑍) = 0 . 118. MadSpin is used for the prompt decays of the leptoquarks into spin-entangled quark-lepton pairs of the third generation. Parton showering and hadronisation are simulated in Pythia with the NNPDF2.3LO PDF set with 𝛼
S
( 𝑚
𝑍) = 0 . 130. The leptoquark signal samples are generated for various leptoquark masses 𝑚 ( LQ
u/d3) and with a fixed value of the parameter 𝛽 = 0 . 5, so that both decays of the leptoquarks, either to a neutrino and a quark or a charged lepton and a quark, are possible. These events can be reweighted to arbitrary branching fractions 𝐵 ( LQ
u/d3→ 𝑞ℓ ) to derive the interpretation of the analysis results in the plane of 𝑚 ( LQ
u/d3) vs. 𝐵 ( LQ
u/d3→ 𝑞ℓ ) . The coupling parameter 𝜆 is set to 0 . 3, close to the numeric value of the electromagnetic coupling, resulting in a LQ
u/d3width of about 0.2 % of its mass [53, 105]. The cross sections for direct top-squark pair production are used for LQ pair-production, as both involve massive, scalar, color-charged particles and the production modes are the same. These cross sections do not include the lepton 𝑡 -channel contributions possible for LQ pair-production, which are also neglected in Ref. [102] and may lead to corrections at the percent level [106].
4 Event reconstruction
All events are required to have at least one reconstructed interaction vertex with a minimum of two associated tracks with 𝑝
T
> 500 MeV. In events with multiple vertices, the one with the highest sum of squared transverse momenta of associated tracks is chosen as the primary vertex (PV) [107].
Jets are reconstructed from particle-flow objects [108] calibrated at the EM scale using the anti- 𝑘
𝑡algorithm with a radius parameter of 𝑅 = 0 . 4. As both signal models predict the production of particles with large masses, only jets in the central region within | 𝜂 | < 2 . 8 are used. The jets are calibrated following the procedure described in Ref. [109] and are required to have 𝑝
T
> 20 GeV and to pass the set of quality criteria defined in Ref. [110]. To suppress jets from pile-up interactions, candidates with 𝑝
T
< 60 GeV
and | 𝜂 | < 2 . 4 are required to pass the Tight working point of the jet vertex tagger [111]. Selected jets arising from the hadronisation of a bottom quark are flagged as 𝑏 -jets if they lie within | 𝜂 | < 2 . 5 and are tagged by the DL1r algorithm, a multivariate discriminant based on various inputs such as track impact parameters and displaced secondary vertices [112, 113]. The 𝑏 -tagging algorithm uses a working point with an efficiency of 77 %, with an approximate misidentification probability of 20 % for jets arising from charm quarks, 6.7 % for hadronically decaying 𝜏 -leptons, and 0.9 % for light-flavor jets in simulated 𝑡 𝑡 ¯ events.
Tau leptons which decay leptonically are not identified as such, but are instead reconstructed as a candidate for a prompt electron or muon. Therefore, in the context of reconstructed analysis objects, tau lepton will always refer to a hadronic tau lepton, i. e. a tau lepton that decays hadronically. The visible component of hadronically decaying tau leptons is reconstructed from anti- 𝑘
𝑡jets ( 𝑅 = 0 . 4) built from locally calibrated [114] topological clusters, with a distance parameter 𝑅 = 0 . 4 and requiring 𝑝
T
> 10 GeV and | 𝜂 | < 2 . 5 [115, 116]. The energy calibration applies a pile-up subtraction and a correction to the detector response. Information from the tracking system improves the energy resolution at low 𝑝
T
[116, 117]. Tau-lepton candidates are required to have 𝑝
T
> 20 GeV and lie outside the transition region 1 . 37 < | 𝜂 | < 1 . 52 between the barrel and endcap calorimeters. Furthermore, they must have either one or three charged tracks (“prongs”) with a charge sum of ± 1 in units of the elementary charge. A recurrent neural network algorithm [118] distinguishes hadronically decaying tau leptons from quark- and gluon-initiated jets based on a combination of discriminating variables as well as tracking and calorimeter measurements.
Its Medium working point is used to identify hadronic tau-lepton candidates, with an efficiency of 75 % and 60 % in simulated Drell-Yan events, and background-rejection factors of 35 and 240 in simulated di-jet events, for one-prong and for three-prong decays, respectively. Electrons misidentified as hadronic tau-lepton candidates are rejected using a dedicated boosted decision tree algorithm. Reconstructed tau leptons in simulated events are called “real” tau leptons if they can be geometrically matched to a tau lepton in the MC truth record, otherwise they are referred to as “fake” tau leptons.
As described in Section 5, events with electrons or muons are rejected in the analysis selections, and thus these only enter in the computation of missing transverse momentum and in the overlap-removal procedure, but are not considered otherwise. Electron candidates are reconstructed from energy deposits in the electromagnetic calorimeter that are matched to tracks in the inner detector (ID) [119]. They are required to have 𝑝
T
> 10 GeV and | 𝜂 | < 2 . 47 and pass the Loose identification requirement [120]. Muon candidates are reconstructed by combining information from the ID and the muon spectrometer. They are required to have 𝑝
T
> 10 GeV and | 𝜂 | < 2 . 7 and pass the Medium identification criteria [121]. The longitudinal impact parameter 𝑧
0
of both electron and muon candidates is required to be less than 0.5 mm.
An overlap-removal procedure is applied to all selected objects to resolve ambiguities in the reconstruction in several consecutive steps. First, if two electrons share the same track, the electron with lower transverse momentum is discarded. Tau-lepton candidates overlapping with an electron or a muon within Δ 𝑅
𝑦< 0 . 2 are removed, where Δ 𝑅
𝑦≡ √︁
(Δ 𝑦 )
2+ (Δ 𝜙 )
2is defined similarly to Δ 𝑅 but with rapidity 𝑦 instead of pseudorapidity 𝜂 for cases where the approximation that the mass can be neglected is not valid. If an electron shares an ID track with a muon, the electron is discarded unless the muon is tagged as a minimum-ionizing particle in the calorimeter, in which case the muon is discarded. Next, jets within Δ 𝑅
𝑦= 0 . 2 of an electron are removed. In order to suppress electrons from semileptonic heavy-flavor decays, electrons within Δ 𝑅
𝑦= 0 . 4 of a jet are removed. Any jet with less than three associated tracks is discarded if a muon is within Δ 𝑅 = 0 . 2 or if a muon can be matched to a track associated with the jet.
For the same reason as for electrons, muons within Δ 𝑅
𝑦= 0 . 4 of a jet are removed. Lastly, jets within
Δ 𝑅
𝑦= 0 . 4 of a tau-lepton candidate are removed.
The missing transverse momentum E
missT
is defined as the negative vector sum of the transverse momenta of all calibrated objects mentioned above, photons [120], and an additional soft term including all tracks associated with the PV but not matched to any reconstructed object [122, 123]. The magnitude of E
missT
is denoted by 𝐸
missT
.
5 Event selection
The analysis covers two different channels, the single-tau and the di-tau channels. In both channels, several different event selections (analysis regions) are defined based on object multiplicities and kinematic variables. All of these event selections start from a common preselection described in the next section.
The preselections in the single-tau and in the di-tau channel are identical except for the number of tau leptons and 𝑏 -tagged jets. The sets of events selected in the two channels are thus mutually exclusive and can therefore be statistically combined, as will be done in the interpretation of the results.
5.1 Preselection
The preselection requirements for the two channels are summarized in Table 2. Events are selected using an 𝐸
missT
trigger. In combination with the requirement of 𝐸
miss T> 250 GeV, this trigger is fully efficient in the phase space that the analysis targets. As no light leptons are expected from the benchmark signal models when only hadronically decaying tau leptons are considered, events with light leptons are rejected.
Events are required to have at least two jets, at least one of which must be 𝑏 -tagged. Additionally, events in the di-tau channel are required to have at least two reconstructed tau leptons, whereas exactly one tau lepton is required in the single-tau channel and the requirement on the 𝑏 -tagging multiplicity is tightened to two or more. The tight 𝐸
missT
and 𝑏 -tagging requirements efficiently suppress multi-jet events such that their contribution to the analysis regions is negligible. This has been verified with dedicated data-driven estimates for both channels.
5.2 Signal regions
Dedicated signal regions are defined for each channel, which have been optimized individually by maximizing the estimated discovery significance [124] for benchmark signal models close to the previous exclusion contours. The selection requirements for the signal regions are explained in the following, and a
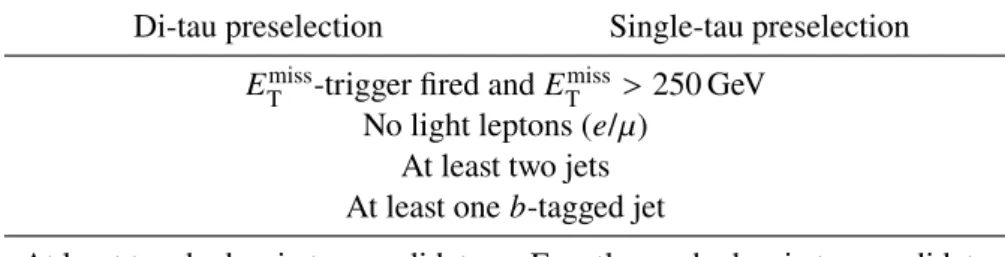
Table 2: Preselection of the di-tau and single-tau channels.
Di-tau preselection Single-tau preselection 𝐸
missT
-trigger fired and 𝐸
miss T> 250 GeV No light leptons ( 𝑒 / 𝜇 )
At least two jets At least one 𝑏 -tagged jet
At least two hadronic tau candidates Exactly one hadronic tau candidate
At least two 𝑏 -tagged jets
summary is included in the overview tables of the analysis regions in Table 3 for the di-tau channel and Table 4 for the single-tau channel. The signal region (SR) in the di-tau channel targets stop-stau signal models with low to modest mass differences between the top squark and the tau slepton. This SR is not used for the leptoquark model, as the final states for that model at 𝛽 = 0 . 5 on average only have one tau lepton, and the case of 𝛽 = 1 . 0 is not in the scope of this note. The single-tau channel employs two signal regions: a one-bin SR for the model-independent fit, and a multi-bin SR for the model-dependent fit, as will be discussed in Section 8. Both signal regions in this channel are optimized simultaneously for stop-stau signals with a large mass difference between the top squark and the tau slepton as well as for the leptoquark benchmark signal model.
Di-tau channel
The most discriminating variable in the di-tau channel is the stransverse mass variable [125, 126], which by itself already provides good separation between the signal and the background. The strans- verse mass 𝑚
T2
is a generalization of the transverse mass 𝑚
T
, which is computed as 𝑚
T
(p
T, E
missT
)
2= 2 𝑝
T
𝐸
missT
1 − cos Δ 𝜙 (p
T, E
missT
)
, from the transverse momentum of some given particle and the missing transverse momentum. It generalizes the transverse mass for event topologies where two identical particles each symmetrically decay into a visible and an invisible product. In this case the individual transverse momenta of the invisible particles can no longer be directly approximated by the measured missing transverse momentum, as the information about their individual contributions to the missing transverse momentum is lost. For the two leading tau leptons, i. e. the two tau leptons with the largest and second-largest transverse momentum, 𝑚
T2
( 𝜏
1
, 𝜏
2
) is computed as 𝑚
T2( 𝜏
1
, 𝜏
2
) = min
q𝑎 T+q𝑏
T=Emiss T
max
𝑚
T(p
𝜏1T
, q
𝑎T
) , 𝑚
T
(p
𝜏2T
, q
𝑏T
)
, (1)
where 𝑎 and 𝑏 refer to two invisible particles assumed to be produced with transverse momentum q
𝑎 , 𝑏T
. The minimum is taken over all possible assignments to q
𝑎 , 𝑏T
that sum to the measured E
missT
. The masses of the invisible particles are free parameters and are set to zero. For the dominant top-quark related backgrounds, the 𝑚
T2
( 𝜏
1
, 𝜏
2
) distribution features an endpoint near the 𝑊 -boson mass. By placing a lower bound at 70 GeV most of this background can be removed, while efficiently selecting signal events, for which the 𝑚
T2( 𝜏
1
, 𝜏
2
) distribution exhibits a tail towards much higher values. The sensitivity is further enhanced by raising the lower bound on 𝐸
missT
to 280 GeV and requiring the two leading tau leptons to carry electric charges with opposite signs, a criterion later denoted as 𝑂 𝑆 ( 𝜏
1
, 𝜏
2
) = 1.
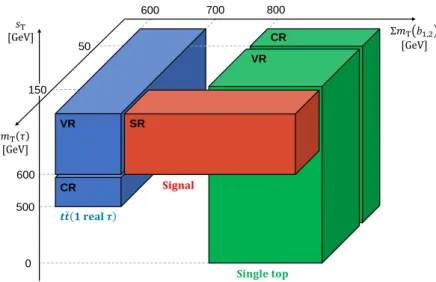
Single-tau channel
Both signal regions in the single-tau channel have a lower bound on 𝐸
missT
at 280 GeV and on the sum of the transverse masses of the 𝑏 -jets, Í
𝑚
T( 𝑏
1,2
) = 𝑚
T
( 𝑏
1
) + 𝑚
T
( 𝑏
2
) , at 700 GeV. In this expression and the following, 𝑚
T
( 𝐴 ) for a given particle 𝐴 should be read as 𝑚
T
( 𝐴 ) ≡ 𝑚
T
(p
𝐴T
, E
missT
) . The one-bin SR requires 𝑚
T
( 𝜏 ) > 300 GeV and 𝑠
T
> 800 GeV, where 𝑠
T
is defined as the scalar sum of transverse momenta of the tau lepton and the two leading jets, 𝑠
T
= 𝑝
T
( 𝜏 ) + 𝑝
T
( jet
1) + 𝑝
T
( jet
2) . While both the stop-stau and LQ
u/d3signals show relatively similar behavior in most kinematic variables, their 𝑝
T
( 𝜏 ) distributions differ. This is due to the large mass difference of the stop-stau target scenario, so that the tau leptons are softer compared to those produced in the LQ
u/d3decay. To account for the different shapes of the transverse momenta of the tau leptons, the second SR is defined with three bins in 𝑝
T
( 𝜏 ) . The first
two 𝑝
T
( 𝜏 ) bins cover 50 to 100 GeV and 100 to 200 GeV, and the last bin everything beyond 200 GeV. To maintain a sufficiently large number of events in each of the three 𝑝
T
( 𝜏 ) bins, two selection requirements are loosened with respect to the one-bin SR: the minimum 𝑚
T
( 𝜏 ) requirement is lowered to 150 GeV, and the minimum 𝑠
T
requirement to 600 GeV. As the one-bin SR is a subset of the multi-bin SR, they cannot be combined in the statistical interpretation of the results discussed in Section 8. A multi-bin SR based on 𝑠
Tinstead of 𝑝
T
( 𝜏 ) has also been tested, but was found to have lower sensitivity.
6 Background estimation
The background in the signal regions is dominated by 𝑡 𝑡 ¯ and single-top production, which can yield events with a final state similar to the signal processes. For these background processes dedicated control regions are defined. Top-quark production can contribute to the background in different ways. Events with 𝑡 𝑡 ¯ production, where both 𝑊 bosons arising from the top-quark decay into a hadronic tau lepton, have two real tau leptons. This process, denoted by 𝑡 𝑡 ¯ (2 real 𝜏 ), contributes to the di-tau channel if both hadronic tau leptons are correctly identified. If instead only one of the 𝑊 bosons from the 𝑡 𝑡 ¯ system gives a hadronic tau lepton which is correctly identified, and the second 𝑊 boson decays hadronically, the resulting jet from the second 𝑊 -boson decay can be misidentified as a tau lepton, and such an event can then still pass the di-tau channel selection criteria. While the mis-identification probability is of the order of a few percent, the larger branching fraction of hadronic 𝑊 decays and the less pronounced endpoint in the 𝑚
T2
( 𝜏
1
, 𝜏
2
) distribution for 𝑡 𝑡 ¯ events with one real and one fake tau lepton still leads to a significant contribution in the di-tau channel. This type of event can also enter the single-tau channel selection, if the jet from the second 𝑊 boson is not misidentified as a tau candidate. Di-tau 𝑡 𝑡 ¯ events in which only one of the two identified tau leptons is real, and single-tau 𝑡 𝑡 ¯ events with one real tau lepton are referred to as 𝑡 𝑡 ¯ (1 real 𝜏 ) events. Lastly, fully hadronic 𝑡 𝑡 ¯ decays, without any real tau leptons that pass the selections in either the single-tau or di-tau channel are referred to as 𝑡 𝑡 ¯ -fake events. Due to their different kinematics, the simulated 𝑡 𝑡 ¯ events are split into these three types of events, 𝑡 𝑡 ¯ (2 real 𝜏 ), 𝑡 𝑡 ¯ (1 real 𝜏 ), and 𝑡 𝑡 ¯ -fake, and treated as separate background components in the following.
Sub-dominant contributions to the SM background arise from singly produced vector bosons ( 𝑊 + jets and 𝑍 + jets events) and production of vector bosons in association with top-quark pairs ( 𝑡 𝑡 ¯ + 𝑉 ). In addition, multi-boson production, 𝑡 𝑡 ¯ production in association with a Higgs boson ( 𝑡 𝑡 ¯ + 𝐻 ) and other top-related processes yield small contributions. These sub-dominant processes are normalized according to their cross sections and the integrated luminosity measured in data.
The normalization of the MC predictions is extracted in a simultaneous maximum-likelihood fit to the observed data in the control regions (CRs). This fit, where no signal contributions are included, is referred to as the background-only fit. The CRs are designed to be enriched in a given background process and to be kinematically as similar to the SRs as possible, while maintaining sufficient purity, a high enough event yield and keeping the signal contamination negligible. In addition to the data yields in the CRs, the expected yields and statistical and systematic uncertainties from MC simulation, described in Section 7, are input to the background-only fit. The yields obtained from the background-only fit can then be extrapolated to dedicated validation regions (VRs) to assess the accuracy of the background estimate. All CR, VR and SR selections are mutually exclusive so that they are statistically independent as required for the fit.
The CR and VR selections are introduced in Sections 6.1 and 6.2 for the di-tau and single-tau channel,
respectively. The signal regions are used for limit setting as discussed in Section 8. All fit setups are
implemented using the HistFitter framework [127].
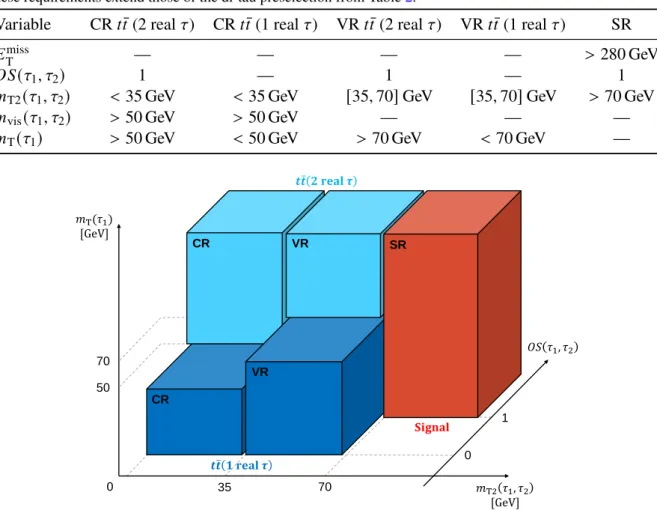
Table 3: Definitions of the 𝑡 𝑡 ¯ control and validation regions and the signal region in the di-tau channel. A dash signifies that no requirement on the given variable is applied, while brackets indicate an allowed range for the variable.
These requirements extend those of the di-tau preselection from Table 2.
Variable CR 𝑡 𝑡 ¯ (2 real 𝜏 ) CR 𝑡 𝑡 ¯ (1 real 𝜏 ) VR 𝑡 𝑡 ¯ (2 real 𝜏 ) VR 𝑡 𝑡 ¯ (1 real 𝜏 ) SR 𝐸
missT
— — — — > 280 GeV
𝑂 𝑆 ( 𝜏
1
, 𝜏
2
) 1 — 1 — 1
𝑚
T2( 𝜏
1
, 𝜏
2
) < 35 GeV < 35 GeV [ 35 , 70 ] GeV [ 35 , 70 ] GeV > 70 GeV 𝑚
vis( 𝜏
1
, 𝜏
2
) > 50 GeV > 50 GeV — — —
𝑚
T( 𝜏
1
) > 50 GeV < 50 GeV > 70 GeV < 70 GeV —
𝑚T2𝜏1, 𝜏2 [GeV]
𝑚T(𝜏1) [GeV]
35 𝒕 ҧ𝒕 𝟏 𝐫𝐞𝐚𝐥 𝝉
𝐒𝐢𝐠𝐧𝐚𝐥
CR VR SR
VR CR
70
0 1 𝒕 ҧ𝒕 𝟐 𝐫𝐞𝐚𝐥 𝝉
50 70
0
𝑂𝑆 𝜏1, 𝜏2
Figure 2: Overview of the selections defining the control, validation and signal regions in the di-tau channel in the phase-space spanned by the variables 𝑚
T2
( 𝜏
1
, 𝜏
2
) , 𝑚
T
( 𝜏
1
) , and OS ( 𝜏
1
, 𝜏
2
) , where OS ( 𝜏
1
, 𝜏
2
) = 1 means that the reconstructed charge of the two leading tau leptons has opposite sign. In addition to these variables 𝐸
missT
> 280 GeV is required for the signal region, and 𝑚
vis
( 𝜏
1
, 𝜏
2
) > 50 GeV for the control regions. The complete definitions are summarized in Table 3.
6.1 Di-tau channel
Table 3 summarizes the definitions of the control, validation and signal-region selections in the di-tau channel. One control region and one validation region are defined in this channel for each of the 𝑡 𝑡 ¯ (2 real 𝜏 ) and 𝑡 𝑡 ¯ (1 real 𝜏 ) processes. Their location in the phase-space spanned by 𝑚
T2
( 𝜏
1
, 𝜏
2
) , 𝑚
T
( 𝜏
1
) , and 𝑂 𝑆 ( 𝜏
1
, 𝜏
2
) is illustrated in Fig. 2. The CRs and VRs sit in the 𝑚
T2
( 𝜏
1
, 𝜏
2
) sideband below 70 GeV, above which the SR is located, and are divided at 35 GeV.
Top-quark pair-production events in which only one of the 𝑊 bosons decays leptonically, with one real tau lepton and one fake tau lepton, feature an endpoint in the 𝑚
T
distribution of the real tau lepton near the 𝑊 mass. The reason is that the dominant source of 𝐸
missT
is the tau neutrino from the 𝑊 decay. By contrast, for 𝑡 𝑡 ¯ events with two real tau leptons, two tau neutrinos contribute to the 𝐸
missT
and there is no distinct
endpoint in 𝑚
T
. This difference in the shapes of the 𝑚
T
distributions is exploited in the selection of 𝑡 𝑡 ¯ (2 real 𝜏 ) and 𝑡 𝑡 ¯ (1 real 𝜏 ) events. In the majority of 𝑡 𝑡 ¯ (1 real 𝜏 ) events in the di-tau channel, the real tau lepton corresponds to the leading reconstructed tau lepton. A requirement on 𝑚
T
( 𝜏
1
) at 50 (70) GeV is thus used to separate the 𝑡 𝑡 ¯ (2 real 𝜏 ) CR (VR) from the 𝑡 𝑡 ¯ (1 real 𝜏 ) CR (VR). By requiring the leading and subleading tau lepton in the 𝑡 𝑡 ¯ (2 real 𝜏 ) CR and VR selections to carry electric charges of opposite sign, 𝑂 𝑆 ( 𝜏
1
, 𝜏
2
) = 1, the purity is further increased. In addition, a lower bound on the invariant mass of the two tau leptons computed from the visible decay products, 𝑚
vis
( 𝜏
1
, 𝜏
2
) , at 50 GeV is applied to reduce the contribution from 𝑍 + jets events.
Distributions of the main discriminating variables 𝑚
T2
( 𝜏
1
, 𝜏
2
) and 𝐸
missT
in the control and validation
regions of the di-tau channel are shown in Fig. 3. The predictions for the top-quark backgrounds are scaled
with the normalization factors obtained from the background-only fit. From the plots it can be seen that the
background model describes the data very well.
0 20 40 60 80 100 120 140 160
Entries / 7 GeV Di-tau channel
) (2 real τ t CR t
ATLAS Preliminary
= 13 TeV, 139 fb-1
s
Data Total SM
) (2 real τ
tt tt(1 real τ)
V+jets Other
Single top
0 5 10 15 20 25 30 35
) [GeV]
τ2 1, (τ mT2
0.5 1 1.5
Data / SM
0 5 10 15 20 25
Entries / 11.7 GeV
Di-tau channel ) (2 real τ t VR t
ATLAS Preliminary
= 13 TeV, 139 fb-1
s
Data Total SM
) (2 real τ
tt tt(1 real τ)
Other V+jets
Single top
35 40 45 50 55 60 65 70
) [GeV]
τ2 1, (τ mT2
0.5 1 1.5
Data / SM
0 20 40 60 80 100 120 140
Entries / 50 GeV
Di-tau channel ) (1 real τ t CR t
ATLAS Preliminary
= 13 TeV, 139 fb-1
s
Data Total SM
) (1 real τ
tt tt(2 real τ)
V+jets Other
Single top
250 300 350 400 450 500 550
[GeV]
missT
E 0.51
1.5
Data / SM
0 10 20 30 40 50
Entries / 100 GeV
Di-tau channel ) (1 real τ t VR t
ATLAS Preliminary
= 13 TeV, 139 fb-1
s
Data Total SM
) (1 real τ
tt tt(2 real τ)
V+jets Single top
Other
250 300 350 400 450 500 550
[GeV]
missT
E 0.51
1.5
Data / SM
Figure 3: Distributions of 𝑚
T2
( 𝜏
1
, 𝜏
2
) and 𝐸
missT
in the di-tau channel. The left-hand plots show the control regions and the right-hand plots the validation regions, with 𝑚
T2
( 𝜏
1
, 𝜏
2
) in the 𝑡 𝑡 ¯ (2 real 𝜏 ) CR and VR in the top row and 𝐸
missT
in the 𝑡 𝑡 ¯ (1 real 𝜏 ) CR and VR in the bottom row. The CRs and VRs have different requirements on the transverse mass 𝑚
T
( 𝜏
1
) . The stacked histograms show the various SM background contributions. The hatched band
indicates the total statistical and systematic uncertainty of the SM background. The 𝑡 𝑡 ¯ (2 real 𝜏 ) and 𝑡 𝑡 ¯ (1 real 𝜏 )
as well as the single-top background contributions are scaled with the normalization factors obtained from the
background-only fit. Minor backgrounds are grouped together and denoted as “Other”. This includes 𝑡 𝑡 ¯ -fake, 𝑡 𝑡 ¯ + 𝑋 ,
multiboson, and other top. The rightmost bin includes the overflow.
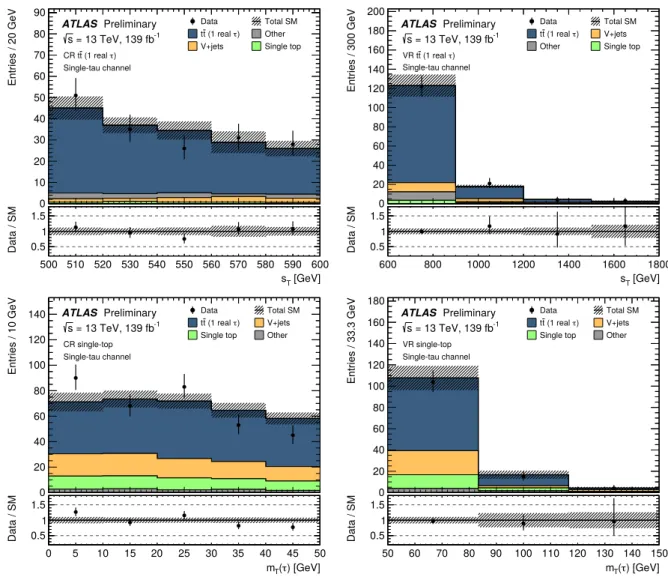
6.2 Single-tau channel
For the two dominant processes in the single-tau channel, 𝑡 𝑡 ¯ production with one real tau lepton and single-top production, again two pairs of control and validation regions are defined. The definitions are illustrated in Fig. 4 and summarized in Table 4. In contrast to the di-tau CRs and VRs, the larger available number of events in the single-tau channel allows the same lower bound on 𝐸
missT
to be used in the CR and VR selections as for the SR. The 𝑡 𝑡 ¯ (1 real 𝜏 ) control and validation regions in the single-tau channel are placed in the Í
𝑚
T( 𝑏
1,2
) sideband between 600 and 700 GeV. The control region is located in the 𝑠
T
window from 500 to 600 GeV, and the validation region covers the range above 600 GeV. The normalization of the 𝑡 𝑡 ¯ (1 real 𝜏 ) process is obtained from a simultaneous fit of both control regions for this process, one from each channel. The CR and VR for the single-top background sit in the 𝑚
T
( 𝜏 ) window from 0 to 50 GeV and 50 to 150 GeV, respectively. Additionally, lower bounds on Í
𝑚
T( 𝑏
1,2
) at 800 GeV and on 𝑝
T
( 𝜏 ) at > 80 GeV increase the purity of both the single-top CR and VR. Events from 𝑡 𝑡 ¯ (1 real 𝜏 ) are less likely to fulfill the 𝑝
T
( 𝜏 ) requirement, which favors high-energetic decay products. They also tend
𝑚T 𝜏 [GeV]
Σ𝑚T𝑏1,2
[GeV]
𝑠T
[GeV]
50
600 700 800
600 500 150
CR
VR SR
VR CR
𝒕 ҧ𝒕 𝟏 𝐫𝐞𝐚𝐥 𝝉
𝐒𝐢𝐧𝐠𝐥𝐞 𝐭𝐨𝐩 𝐒𝐢𝐠𝐧𝐚𝐥
0
Figure 4: Overview of the selections defining the control, validation and multi-bin signal region in the single-tau channel in the phase-space spanned by the variables Í
𝑚
T( 𝑏
1,2
) , 𝑚
T
( 𝜏 ) and 𝑠
T
. In addition to these variables, 𝐸
missT
> 280 GeV is required for the signal region, and 𝑝
T
( 𝜏
1
) > 80 GeV for the single-top control region and validation regions. The complete definitions are summarized in Table 4.
Table 4: Definitions of the 𝑡 𝑡 ¯ (1 real 𝜏 ) and single-top control and validation regions and the signal region in the single-tau channel. A dash signifies that no requirement on the given variable is applied, while brackets indicate an allowed range for the variable. In the last column, round brackets enclose the values and ranges used for the multi-bin SR. The binning in 𝑝
T( 𝜏 ) of the multi-bin SR, abbreviated with “binned”, is [ 50 , 100 ] , [ 100 , 200 ] , and > 200 GeV.
These requirements extend those of the single-tau preselection from Table 2.
Variable CR 𝑡 𝑡 ¯ (1 real 𝜏 ) CR single top VR 𝑡 𝑡 ¯ (1 real 𝜏 ) VR single top SR 𝐸
missT
> 280 GeV > 280 GeV > 280 GeV > 280 GeV > 280 GeV
𝑠
T[ 500 , 600 ] GeV — > 600 GeV — > 800 ( 600 ) GeV
Í 𝑚
T
( 𝑏
1,2
) [ 600 , 700 ] GeV > 800 GeV [ 600 , 700 ] GeV > 800 GeV > 700 GeV
𝑚
T( 𝜏 ) — < 50 GeV — [ 50 , 150 ] GeV > 300 ( 150 ) GeV
𝑝
T( 𝜏 ) — > 80 GeV — > 80 GeV — (binned)
0 10 20 30 40 50 60 70 80 90
Entries / 20 GeV
Single-tau channel ) (1 real τ t CR t
ATLAS Preliminary
= 13 TeV, 139 fb-1
s
Data Total SM
) (1 real τ
tt Other
V+jets Single top
500 510 520 530 540 550 560 570 580 590 600 [GeV]
sT
0.5 1 1.5
Data / SM
0 20 40 60 80 100 120 140 160 180 200
Entries / 300 GeV
Single-tau channel ) (1 real τ t VR t
ATLAS Preliminary
= 13 TeV, 139 fb-1
s
Data Total SM
) (1 real τ
tt V+jets
Other Single top
600 800 1000 1200 1400 1600 1800
[GeV]
sT
0.5 1 1.5
Data / SM
0 20 40 60 80 100 120 140
Entries / 10 GeV
Single-tau channel CR single-top ATLAS Preliminary
= 13 TeV, 139 fb-1
s
Data Total SM
) (1 real τ
tt V+jets
Single top Other
0 5 10 15 20 25 30 35 40 45 50
) [GeV]
(τ mT
0.51 1.5
Data / SM
0 20 40 60 80 100 120 140 160 180
Entries / 33.3 GeV
Single-tau channel VR single-top ATLAS Preliminary
= 13 TeV, 139 fb-1
s
Data Total SM
) (1 real τ
tt V+jets
Single top Other
50 60 70 80 90 100 110 120 130 140 150 ) [GeV]
(τ mT
0.51 1.5
Data / SM
Figure 5: Distributions of 𝑠
T
and 𝑚
T
( 𝜏 ) in the control regions and the validation regions of the single-tau channel.
The top row shows 𝑠
T
in the 𝑡 𝑡 ¯ (1 real 𝜏 ) CR (left) and 𝑡 𝑡 ¯ (1 real 𝜏 ) VR (right), the bottom row shows 𝑚
T
( 𝜏 ) in the single-top CR (left) and single-top VR (right). The stacked histograms show the various SM background contributions. The hatched band indicates the total statistical and systematic uncertainty of the SM background. The 𝑡 𝑡 ¯ (1 real 𝜏 ) and single-top background contributions are scaled with the normalization factors obtained from the background-only fit. Minor backgrounds are grouped together and denoted as “Other”. This includes 𝑡 𝑡 ¯ -fake, 𝑡 𝑡 ¯ + 𝑋 , multiboson, and other top. The rightmost bin includes the overflow.
to have lower Í 𝑚
T( 𝑏
1,2
) , as the transverse mass computed for the sub-leading 𝑏 -jet has a quite distinct endpoint around the top-quark mass.
Figure 5 shows the distribution of 𝑠
T
and 𝑚
T
( 𝜏 ) in the 𝑡 𝑡 ¯ (1 real 𝜏 ) CR and VR and in the single-top
CR and VR of the single-tau channel. The predictions for the top-quark backgrounds are scaled with
the normalization factors obtained from the background-only fit. These are consistent with unity for the
𝑡 𝑡 ¯ (2 real 𝜏 ) and 𝑡 𝑡 ¯ (1 real 𝜏 ) backgrounds, but much smaller than one for the single-top background as
discussed further in Section 8. Therefore, the contribution of scaled single-top events to the single-top CR
and VR in the figure is very low, whereas it is 43 % before applying the normalization factors. From the
plots it can be seen that the background model describes the data very well.
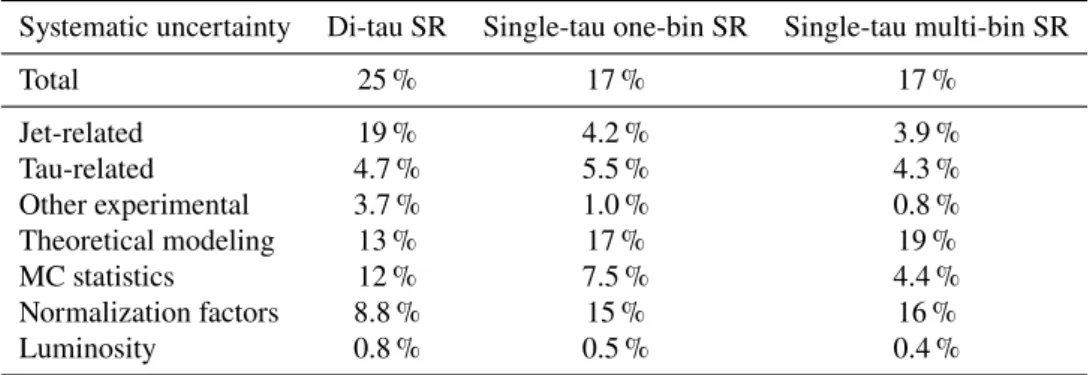
Table 5: Relative systematic uncertainties on the estimated number of background events in the signal regions. In the lower part of the table, a breakdown of the total uncertainty into different categories is given. For the multi-bin SR, the breakdown refers to the integral over all three 𝑝
T
( 𝜏 ) bins. As the individual uncertainties are correlated, they do not add in quadrature to equal the total background uncertainty.
Systematic uncertainty Di-tau SR Single-tau one-bin SR Single-tau multi-bin SR
Total 25 % 17 % 17 %
Jet-related 19 % 4.2 % 3.9 %
Tau-related 4.7 % 5.5 % 4.3 %
Other experimental 3.7 % 1.0 % 0.8 %
Theoretical modeling 13 % 17 % 19 %
MC statistics 12 % 7.5 % 4.4 %
Normalization factors 8.8 % 15 % 16 %
Luminosity 0.8 % 0.5 % 0.4 %
7 Systematic uncertainties
The expected yields for signal and background processes are subject to experimental and theoretical systematic uncertainties. They are treated as nuisance parameters with Gaussian probability densities in the likelihood fits.
Experimental uncertainties comprise systematic uncertainties in the reconstruction, identification, calibra- tion and corrections performed for the physics objects used in the analysis. Energy resolution and calibration uncertainties apply to all objects. For tau leptons additional experimental systematic uncertainties arise from the reconstruction and identification efficiencies. As events with electrons and muons are rejected at preselection level, the related uncertainties in the reconstruction and identification are negligible in the analysis regions. For jets, additional uncertainties from the pileup subtraction, pseudorapidity intercali- bration, flavor composition, and punch-through effects, as well as uncertainties in the flavor-tagging and jet-vertex tagging efficiencies are considered. Systematic uncertainties affecting the energy or momentum of calibrated objects are propagated to the 𝐸
missT
calculation, and an additional uncertainty due to the contribution of the soft-track term is considered. Common sources of experimental uncertainty are assumed to be correlated across all regions and between the background processes and the signal.
Uncertainties in the renormalisation and factorization scales are considered for all major background processes by separately varying the scales 𝜇
r
and 𝜇
f
up and down by a factor of two. Additionally, PDF and 𝛼
S
uncertainties are considered following the PDF4LHC15 prescription [128]. The PDF uncertainty is evaluated as the root mean square of a set of 100 variations, and the 𝛼
S
uncertainty is derived by taking the average difference between the up and down variations. Additional initial-state and final-state radiation uncertainties are considered for the 𝑡 𝑡 ¯ and single-top processes by varying generator settings, such as the simultaneous 𝜇
r
and 𝜇
f
variation and eigenvariations of the A14 tune [71]. Furthermore, theoretical uncertainties due to the hard-scatter and parton-shower simulation are estimated by comparing the corresponding nominal yields against those predicted with alternative generators, i. e. Powheg versus aMC@NLO and Pythia 8 versus Herwig 7, respectively. The impact of the interference between single-top 𝑊 𝑡 and 𝑡 𝑡 ¯ production is estimated by comparing samples produced with the nominal diagram-removal scheme to alternative samples generated with the diagram-subtraction scheme [129]. For 𝑉 + jets, additional uncertainties related to the resummation and CKKW matching scales [130, 131] are considered.
Uncertainties in the cross section and in the integrated luminosity of the data are applied for all simulated
processes except for 𝑡 𝑡 ¯ with one or two real tau leptons and single-top quark production, which are normalized to data.
Table 5 summarizes the total systematic uncertainties on the background expectation in the signal regions.
In the di-tau SR the largest sources of experimental uncertainty are the uncertainties in the jet energy resolution, whereas hard-scatter and parton-shower uncertainties dominate the uncertainty on the theoretical modeling. For the one-bin and multi-bin SRs in the single-tau channel, the theoretical uncertainties on the 𝑡 𝑡 ¯ final state radiation and interference with the 𝑊 𝑡 process take the leading role.
For the theoretical uncertainties on the signal acceptance an estimate of 20 % is used, which is derived from a study of the impact of variations in the renormalisation and factorization scales, the radiation and merging scales, the PDF, and the 𝛼
S
value for several stop-stau and LQ
u/d3signal points. Uncertainties on the signal production cross section are considered separately in the interpretation of the results discussed in Section 8.
8 Results
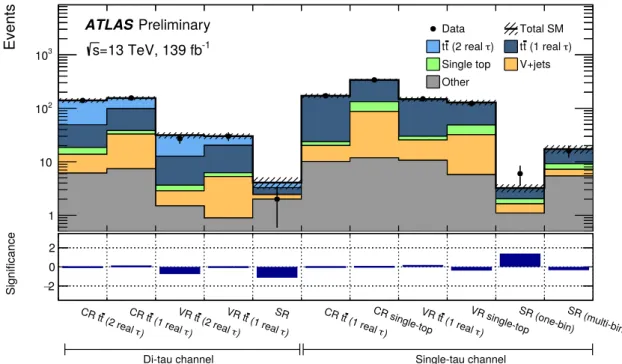
The predictions of the event yields from SM background processes obtained from the background-only fit to the control regions, as described in Section 6, and the observed data are shown in Table 6 for the signal regions in the di-tau and single-tau channel. Events with pair-produced top-quarks make up the largest contribution in all signal regions. The normalization factors obtained from the background-only fit are 0 . 93
−+00..3223for the 𝑡 𝑡 ¯ (2 real 𝜏 ) background, 0 . 84
−+00..2117for 𝑡 𝑡 ¯ (1 real 𝜏 ), and 0 . 18
−+00..1916for single-top production.
The normalization factor for single-top production is significantly smaller than one and strongly depends on
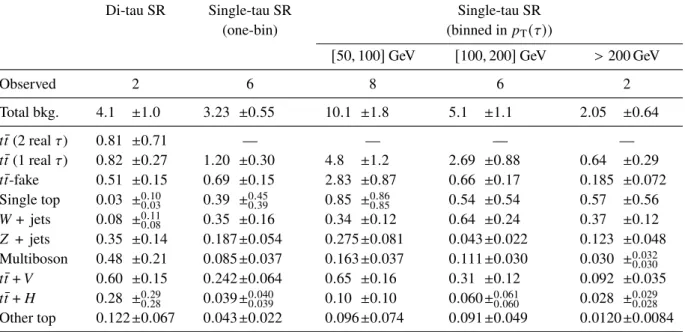
Table 6: Observed event yields in data (“Observed”) and expected event yields for SM background processes obtained from the background-only fit (“Total bkg.” and rows below) in the signal regions of the di-tau and single-tau channels.
The quoted uncertainties include both the statistical and systematic uncertainties and are truncated at zero. By construction no 𝑡 𝑡 ¯ (2 real 𝜏 ) events can pass the selections in the single-tau channel. As the individual uncertainties are correlated, they do not add in quadrature to equal the total background uncertainty.
Di-tau SR Single-tau SR Single-tau SR
(one-bin) (binned in 𝑝
T
( 𝜏 ) )
[ 50 , 100 ] GeV [ 100 , 200 ] GeV > 200 GeV
Observed 2 6 8 6 2
Total bkg. 4 . 1 ± 1 . 0 3 . 23 ± 0 . 55 10 . 1 ± 1 . 8 5 . 1 ± 1 . 1 2 . 05 ± 0 . 64
𝑡 𝑡 ¯ (2 real 𝜏 ) 0 . 81 ± 0 . 71 — — — —
𝑡 𝑡 ¯ (1 real 𝜏 ) 0 . 82 ± 0 . 27 1 . 20 ± 0 . 30 4 . 8 ± 1 . 2 2 . 69 ± 0 . 88 0 . 64 ± 0 . 29 𝑡 𝑡 ¯ -fake 0 . 51 ± 0 . 15 0 . 69 ± 0 . 15 2 . 83 ± 0 . 87 0 . 66 ± 0 . 17 0 . 185 ± 0 . 072 Single top 0 . 03 ±
0.100.03
0 . 39 ±
0.450.39
0 . 85 ±
0.860.85
0 . 54 ± 0 . 54 0 . 57 ± 0 . 56 𝑊 + jets 0 . 08 ±
0.110.08
0 . 35 ± 0 . 16 0 . 34 ± 0 . 12 0 . 64 ± 0 . 24 0 . 37 ± 0 . 12 𝑍 + jets 0 . 35 ± 0 . 14 0 . 187 ± 0 . 054 0 . 275 ± 0 . 081 0 . 043 ± 0 . 022 0 . 123 ± 0 . 048 Multiboson 0 . 48 ± 0 . 21 0 . 085 ± 0 . 037 0 . 163 ± 0 . 037 0 . 111 ± 0 . 030 0 . 030 ±
0.0320.030
𝑡 𝑡 ¯ + 𝑉 0 . 60 ± 0 . 15 0 . 242 ± 0 . 064 0 . 65 ± 0 . 16 0 . 31 ± 0 . 12 0 . 092 ± 0 . 035 𝑡 𝑡 ¯ + 𝐻 0 . 28 ±
0.290.28
0 . 039 ±
0.0400.039
0 . 10 ± 0 . 10 0 . 060 ±
0.0610.060
0 . 028 ±
0.0290.028
Other top 0 . 122 ± 0 . 067 0 . 043 ± 0 . 022 0 . 096 ± 0 . 074 0 . 091 ± 0 . 049 0 . 0120 ± 0 . 0084
) τ (2 real CR tt
) τ (1 real CR tt
) τ (2 real VR tt
) τ (1 real
VR tt SR
) τ (1 real
CR tt CR single-top ) τ (1 real
VR tt VR single-topSR (one-bin)SR (multi-bin) 1
10 102
103
Events
Data Total SM) τ(2 real tt )τ(1 real ttSingle top V+jets Other
=13 TeV, 139 fb
-1s
Preliminary ATLAS
) τ (2 real CR tt
) τ (1 real CR tt
) (2 real τ VR tt
) τ (1 real
VR tt SR
) τ (1 real
CR tt CR single-top ) τ (1 real
VR tt VR single-topSR (one-bin)SR (multi-bin) 2
− 0 2
Significance
Di-tau channel Single-tau channel
Figure 6: Comparison of expected and observed event yields (top panel) and the significance of their discrepancy (bottom panel) for all analysis regions of the di-tau and single-tau channel. The hatched band in the top panel indicates the combined statistical and systematic uncertainties in the expected SM background. The 𝑡 𝑡 ¯ (2 real 𝜏 ) and 𝑡 𝑡 ¯ (1 real 𝜏 ) as well as the single-top background contributions are scaled with the normalization factors obtained from the background-only fit. Minor backgrounds are grouped together and denoted as “Other”. This includes 𝑡 𝑡 ¯ -fake, 𝑡 𝑡 ¯ + 𝑋 , multiboson, and other top. The entries in the column labeled “SR (multi-bin)” are the sum of the three bins of the multi-bin signal-region.
how the interference between single-top production at next-to-leading order and leading-order 𝑡 𝑡 ¯ production is handled [129, 132, 133]. The value 0 . 18 is obtained from the samples generated with the nominal diagram-removal scheme. The alternative diagram-subtraction scheme gives a normalization factor larger than one with very large uncertainties due to the much smaller yields and thus insufficient purity in the control region. The difference in the CR yields can be attributed to the much softer 𝑏 -jet distribution for the diagram-subtraction scheme. However, the shape of 𝑚
T
( 𝜏
1