Redistribution
HOW VALUES, VOTERS AND INSTITUTIONS SHAPE THE SECONDARY DISTRIBUTION OF INCOMES
Malte Lübker, University of Bamberg
INAUGURAL DISSERTATION 2018
BAMBERG GRADUATE SCHOOL OF SOCIAL SCIENCES
Redistribution
How values, voters and institutions shape the secondary distribution of incomes
Kumulative Dissertation
zur Erlangung des akademischen Grades
eines Doktors der Sozial- und Wirtschaftswissenschaften (Dr. rer. pol.)
an der Fakultät Sozial- und Wirtschaftswissenschaften der Otto-Friedrich-Universität Bamberg
vorgelegt von Malte Lübker
Bamberg, 2018
1. Gutachter: Prof. Dr. Thomas Rixen
Otto-Friedrich-Universität Bamberg 2. Gutachter: Prof. Dr. Johannes Marx
Otto-Friedrich-Universität Bamberg Weiteres Mitglied der Promotionskommission:
Prof. Dr. Ulrich Sieberer
Otto-Friedrich-Universität Bamberg Tag der mündlichen Prüfung: 20. September 2017
Die Arbeit an dieser Dissertation wurde durch die Bamberg Graduate School of Social Sciences im Rahmen der Exzellenzinitiative des Bundes und der Länder gefördert (GSC1024).
URN: urn:nbn:de:bvb:473-opus4-503296 DOI: http://dx.doi.org/10.20378/irbo-50329
Table of Contents
Framework Paper. Redistribution. How values, voters and institutions shape the secondary distribution of incomes
Paper A. Redistribution policies
Paper B. Inequality and the demand for redistribution:
Are the assumptions of the new growth theory valid?
Paper C. Income inequality, redistribution, and poverty:
Contrasting rational choice and behavioral perspectives Paper D. Can the structure of inequality explain fiscal redistribution?
Revisiting the social affinity hypothesis
Framework paper Redistribution
How values, voters and institutions shape the secondary distribution of incomes
This is a previously unpublished paper that provides the thesis with an overall theoretical context.
The suggested citation is:
Luebker, Malte. 2018. Redistribution. How values, voters and institutions shape the secondary distribution of incomes. Doctoral Dissertation. Bamberg: University of Bamberg.
Redistribution
How values, voters and institutions shape the secondary distribution of incomes
Malte Luebker
Why does the extent of fiscal redistribution differ so dramatically across countries and time?
This thesis looks at the role that values, voters and institutions play in the complex causal chain that leads from inequality to redistribution. It argues that the institutions of modern democracies have been relatively successful in aligning public policy with voters’ preferences for redistribution. Understanding how these preferences are formed therefore holds part of the explanation for policy divergence across the developed world. Crucially, preferences for redistribution cannot be reduced to the individual cost-benefit calculations. Instead, they draw on people’s evaluation of income inequality: when electorates perceive income differences as too large, they are also more likely to call on policy-makers to reduce them through the tax and transfer system. Whether or not inequality is perceived as ‘too large’ is, of course, an inherently value-based judgement; it relies on normative concepts of what would constitute a fair and just distribution of incomes. Purely economic models of voting fail to account for systematic differences in inequity aversion between different types of welfare states, and hence arrive at unreliable predictions. A meaningful analysis of redistribution therefore has to take account of voters’ value orientations, how they influence their preferences, and how democratic institutions aggregate them into policy.
To make this argument, this thesis engages with a large body of literature from across the social sciences. This introductory framework paper systematizes how the literature has sought to conceptualize the causal links. It also translates an influential macro-level proposition that connects greater inequality to more redistribution into a model of system behaviour (Coleman, 1990). This makes the micro-foundations that underpin the model explicit and allows engag- ing with them in a systematic manner. This is the main objective of this thesis. It consists of four papers (see Table 1). Between them, they test the macro-level proposition and the micro- foundations by tracing each of the steps involved. The first paper provides a comprehensive
introduction to the topic, defines key terms, and introduces measurement approaches (Luebker, 2015; henceforth cited as Paper A).1 The second paper tracks the causal paths from macro- level inequality to voters’ evaluation of income differences, and how these in turn influence support for redistribution (Luebker, 2007; Paper B). The third paper discusses how the dependent variable, redistribution, should be defined and then tests both the macro-level proposition that links inequality to redistribution, and the micro-to-macro transition from support for redistribution to actual redistribution (Luebker, 2014; Paper C). Finally, the fourth paper investigates whether replacing the independent variable, the extent of inequality, by a measure for the structure of inequality offers a feasible alternative (Luebker, 2018; Paper D).
Table 1. List of papers that are part of the cumulative thesis
Paper A. Redistribution policies
Paper B. Inequality and the demand for redistribution:
Are the assumptions of the new growth theory valid Paper C. Income inequality, redistribution, and poverty:
Contrasting rational choice and behavioral perspectives Paper D. Can the structure of inequality explain fiscal redistribution?
Revisiting the social affinity hypothesis
Note: For full bibliographical references, please see cover pages for each chapter.
This framework paper will provide an overall theoretical context and show how the parts of the thesis complement each other and, as a whole, form a coherent research project. Its starts in Section 1 by introducing the macro-level proposition that greater inequality leads to more redistribution, an idea that was first advanced by Romer (1975) and Meltzer and Richard (1981) in the tradition of classical rational choice. The same section will also introduce Coleman’s (1990) model of system analysis that will be used as a theoretical foundation to structure the remainder of this framework paper. Sections 2 to 4 then outline how the independent and dependent variables – inequality and redistribution – can be defined, and whether the macro-level proposition that connects them holds. Following this, Section 5 discusses the reduced-form relationship between inequality and support for redistribution and Sections 6 to 8 then turn to each of the three elements of micro-foundations. Finally, Section 9 summarizes the main findings and concludes by highlighting the complexity of each of the steps that is involved in the long causal chain from inequality to redistribution.
1 Details on prior publication are and full bibliographical references are found on the cover pages for each chapter.
1. Macro-level propositions and their micro-foundations
Much of the literature on redistribution shares the notion that initial inequality holds the key to explain differences in redistribution. The most prominent example is the public choice model developed by Romer (1975) and Meltzer and Richard (1981) that has become a central reference point for the literature. Meltzer and Richard propose a simple model of redistribution where all individuals are taxed at a linear tax rate by government and the proceeds are redistributed as equal lump sums among all citizens. Following Hotelling (1929) and Downs (1957), they argue that the median voter casts the decisive vote and hence her or his preference for redistribution is decisive in democracies. Assuming that this voter strives to maximize her or his utility (as measured by material gain), they can then show that the median voter’s choice of the tax rate depends on two parameters: median pre-tax income (which, multiplied by the tax rate, gives the median voter’s tax payment) and mean pre-tax income (which, multiplied by the tax rate, gives her lump-sum receipt). However, as Romer (1975) had argued before, there is a constraint that keeps the tax rate from approaching unity: The higher the tax rate, the more people will prefer leisure over work. This shrinks the tax base, exposing an external constraint. The rational voter anticipates this effect and accordingly adjusts her preferred tax rate downwards (Meltzer and Richard, 1981: 918f.).
This gives rise to the conclusion that “[w]hen the mean income rises relative to the income of the decisive voter, taxes rise, and vice versa” (ibid.: 924). Since tax preferences are ordered by income, the decisive voter is the median voter (and her income is equivalent to the median income). In other words, the higher the ratio of mean income over median income is, the higher taxes and lump-sum benefits will be. Conveniently enough, the ratio of median over mean income is a common metric for inequality. Meltzer and Richard (1981) therefore propose that higher initial inequality will entail greater subsequent redistribution. This intuitive argument has become the most influential macro-level proposition in the literature on redistribution (henceforth RMR model, after Romer / Meltzer and Richard). It is not only a logical conclusion from a public choice perspective, but also intuitive from a broader stand- point of public policy. It implies that a greater intensity of the problem (an uneven primary distribution of income perceived as problematic) leads public policy to employ a bigger dose of the remedy (redistribution that produces a more egalitarian secondary distribution of income). The question is, of course, whether this simple and elegant model holds and provides us with an adequate understanding of the political dynamics of distributional conflict.
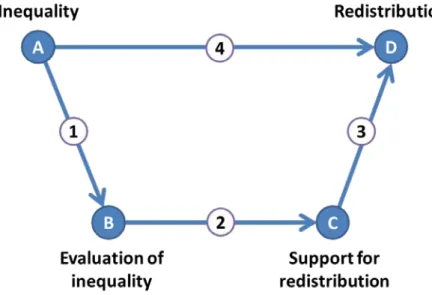
To engage with the macro-level proposition in a systematic manner, it can be translated into a model of system behaviour that makes its micro-foundations explicit (see Coleman, 1990:
Ch. 1). Figure 1 does this and links the independent variable inequality (Node A) and the dependent variable redistribution (Node D) both through a macro-level relationship (Arrow 4)
captures the situational mechanisms through which individuals perceive and evaluate income inequality (Node B). The micro-to-micro transition in Arrow 2 represents the action- formation mechanism that links these perceptions to support for redistribution (Node C).
Finally, the transformational mechanism in Arrow 3 aggregates these preferences into the macro-level outcome (for terminology, see Hedström and Ylikoski, 2010: 59f.).
Figure 1. Diagram of the macro- and micro-level propositions that link income inequality to fiscal redistribution
Source: Own adaptation, based on Coleman (1990: 10) andHedström and Ylikoski (2010: 59).
Using Coleman’s (1990) approach as an analytical frame naturally raises the question in how far this thesis accepts its underlying axioms, and how it positions itself towards methodo- logical individualism (ibid., 5). In agreement with Coleman, this thesis starts from the premise that the macro-level link from income inequality to fiscal redistribution needs a solid micro- foundation. It also shares one of the assumptions made by him and rational choice theory more generally: people, or more precisely voters, act purposefully to achieve their objectives (ibid.: 16). However, this thesis does not follow the classical rational choice literature in one important respect, namely in making the a priori assumption that humans are motivated by narrowly defined utility maximization. The framework paper instead argues in Section 6 that there are three main alternatives to explain human preferences for redistribution: (i) narrowly defined material gain, as assumed in the dominant rational choice model; (ii) insurance motives, which have been discussed as a distinct rationale in the literature; and (iii) altruism and the pursuit of social justice. So rather than fixing these crucial aspects of the action- formation mechanism by assumption, the objectives that humans pursue become a central analytical question that motivates Papers B and C.
Placing this thesis within the same broad frame of reference – as opposed to, say, adopting a structuralist perspective – also allows criticising the RMR model from within. If all the
assumptions of the RMR model are accepted, then how should it be tested against data? How should the dependent macro-variable be defined? Do the conclusions hold when we allow for other motivations besides material gain? Organizing the canonical rational choice model as a question of system behaviour also allows contrasting it with alternative explanations that focus on different sections of the (complex) causal chain, exposing weaknesses of the under- lying assumptions. From within the rational choice framework, these are entirely unproblem- atic: voters are fully informed (Meltzer and Richard, 1981: 924), the micro-to-micro transition is a simple utility maximization problem (ibid.: 920) and the transformational mechanism in Arrow 3 depends only on majority rule (ibid.: 916). While the transitions detailed in Figure 1 are perfectly consistent with the logic of the RMR model, the assumption of perfect infor- mation explains why Meltzer and Richard (1981) and much of the economic literature that followed them do not recognize the situational mechanism (Arrow 1) as a separate step that precedes the action-formation mechanism (Arrow 2). Hence, the literature often departs from the logic of Figure 1 and models support for redistribution as a direct function of inequality, combining Arrows 1 and 2 into a single step. As is argued in more detail in Paper B, the failure to consider the cultural specificity of the situational mechanism is a crucial weakness.
Table 2. Structure of the thesis and links to the analytical framework
Paper A. Introduction to the measurement of inequality and redistribution (Node A and D) Discussion of the theoretical justifications for redistribution
Comparative summary of recent trends in redistribution Paper B. Test of the reduced-form relationship from Node A to Node C
Test of the macro-to-micro transition (Arrow 1) Test of the micro-to-micro transition (Arrow 2)
Paper C. Deduction of the valid specification of redistribution (Node D) from RMR model Test of the micro-to-macro transition (Arrow 3)
Test of the macro-level proposition (Arrow 4)
Paper D. Replication of an alternative macro-level proposition (Arrow 4)
that redefines Node A as “Structure of inequality” (instead of “Level of inequality”) Note: For full bibliographical references, please see cover pages for each chapter.
The remainder of this framework paper uses Figure 1 as a heuristic device to organize the discussion of the broader theoretical and empirical literature on redistribution. The structure given by Figure 1 is also useful to demonstrate how the parts of this thesis contribute to the literature and complement each other (see Table 2). This is done cognizant of the fact that this analytical framework achieves clarity by sacrificing complexity. Importantly, Figure 1 is an
acyclic graph that starts at inequality and ends at redistribution. This presentation has three main shortcomings: (1) It treats the inequality in primary income distribution (Node A) as exogenous, something that we know to be wrong. Public policy does not only concern redistribution, but importantly also shapes the distribution of market incomes (Bradley et al., 2003; see also Paper D). (2) Likewise, the diagram does not allow for a feedback loop that runs from redistribution (i.e. system output) back to shared beliefs and cultural norms that shape the situational mechanisms of the macro-to-micro transition (Arrow 1). The component parts of this thesis therefore, at times, depart from the abstraction implied by Figure 1. For example, Papers A and D argue that public policy, notably labour market regulation, shapes the primary distribution of incomes (which then becomes endogenous to the political system).
Paper B borrows from Easton (1965) to argue that successful welfare states generate support for redistribution by shaping social justice orientations, whereas Paper C uses the notion of
“embedded preferences” (Brooks and Manza, 2007) to make a similar argument. (3) While this thesis argues that the macro-to-micro transition and the micro-to micro transition are best analysed separately, this position is (as mentioned above) not universally shared in the literature on redistribution. In order to reflect the contributions that model support for redistribution (Node C) as a direct function of the macro-level phenomenon inequality (Node A), the framework paper departs from the logical flow implied by Figure 1 to discuss results pertaining to the reduced-form relationship.
Before embarking on the detailed discussion of the public choice argument and its micro- foundations, it is useful considering briefly whether the endeavour is worthwhile. This concerns both the contribution of the thesis to the literature and its broader political relevance.
Meltzer and Richard (1981) are of course fully aware of the limitations of their assumptions.
Neither do they claimed that actual welfare states resemble the simplified version of the state used in their model (where inflation does not exist, governments provide no public goods, and their budget is always balanced; ibid.: 915). However, Meltzer and Richard do not propose their model as a mere thought experiment, but as an explanation for real-world phenomena (ibid.: 914f., 924f.). One could of course argue that their assumptions are so peculiar, and their conclusions so outlandish, that the RMR model is best ignored. There are, however, at least three reasons why their model of redistribution warrants discussion: Firstly, as far as classical rational choice theory is concerned, the underlying assumptions are widely shared and anything but extravagant (Green and Shapiro, 1996; Scott, 1999). Engaging with the details of the proposed causal links therefore holds lessons that extend beyond the study of redistribution. Secondly, the RMR model has been a central reference point for the literature on redistribution. Many of the subsequent contributions can be understood alternatively as attempts to extend and refine the model or as challenges to its basic premises. It is therefore a natural starting point to structure the discussion of the literature. Thirdly, having modified
Coleman’s model of system analysis by relaxing one of its central assumptions, it provides a sufficiently general framework to accommodate an alternative understanding that emphasizes the roles that values, voters and institutions play in shaping redistribution.
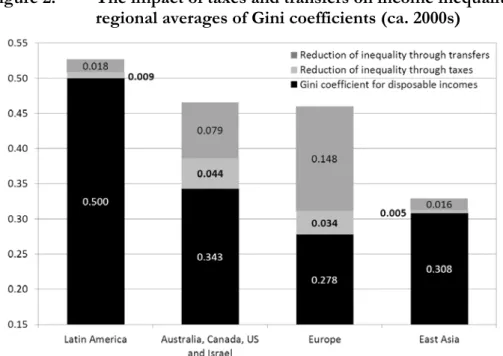
The question how differences in redistribution emerge has also substantial political relevance, given the impact that tax and transfer systems have on social outcomes such as poverty (see the data assembled by Thewissen, Nolan, and Roser, 2016). If there is a quasi-automatic link between rising inequality and more redistribution, the RMR model could be interpreted as a hopeful message for those interested in equity and poverty eradication (Paper C: 134). There then is neither room for political agency nor the need for political debate since the logic of electoral competition reliably produces a more equitable secondary income distribution. This benign view of redistribution is of course contested. The new growth theory is one area of study where the debate on the beneficial or detrimental effects of inequality and redistribution has been particularly heated. A common point of departure is the stylized fact that higher inequality goes hand-in-hand with lower growth; the contentious aspect is how the two are causally connected. One side of the debate has built on the RMR model and argued that higher inequality first leads to more redistribution, and that more redistribution then depresses growth (Alesina and Rodrik, 1994). A similar argument is already contained in in Meltzer and Richard (1981) who, however, apply it in a more limited way to constrain the choice of the tax rate by the decisive voter. In other words, the novelty of this strand of the new growth theory is to append a second macro-level proposition to the existing RMR model. The other side of the debate has argued, often from the perspective of development economics, that inequality in itself is detrimental to growth. For instance, lower growth in more unequal countries is attributed to capital market imperfections and subsequent under-investment by the poor (Aghion, Caroli, and García-Peñalosa, 1999: 1616). Depending on which side one takes, redistribution has the potential to foster growth by reducing income inequality – or it is itself the reason why inequality holds back growth (see also Ostry, Berg, and Tsangarides, 2014;
Thewissen, 2014; Jäntti, Pirttilä, and Rönkkö, 2016).
2. Inequality as an explanatory macro-level variable (Node A)
There are a number of conceptual choices that researchers face when measuring inequality (Node A), the main explanatory macro-variable of the RMR model and alternative explanations (see also Paper A: 218). The first choice concerns the income concept. The logic of Figure 1 implies that income inequality needs to be measured before fiscal redistribution has taken place (Milanovic, 2000: 370). In other words, the income concept for the indepen- dent variable must be market incomes (a terms that will be used interchangeably with primary or factor incomes). While this seems like a self-evident point, early contributions that extended the RMR model to study the impact of inequality on growth paid little attention to
underlying income concepts (see Alesina and Rodrik, 1994).2 Using post-tax and post-transfer incomes (a term used synonymously with secondary or disposable incomes) to explain redistribution leads to obvious endogeneity problems: all else being equal, more redistribution should be associated with greater equality in disposable incomes. A related question is whether to use earnings (i.e. labour income) or total household incomes (i.e. primary incomes from labour and capital). While the RMR model makes the assumption that individuals receive only labour income (Meltzer and Richard, 1981: 917f.), real-world distributional conflict concerns income from all sources (including from capital). Hence, as argued in greater detail in Paper D, the relevant income concept is total market household income.
A second choice is whether to capture the level or the structure of inequality. The overwhelming majority of the literature has settled on the level of inequality, generally using the Gini coefficient as the preferred metric. This is in contrast to the RMR model which, as noted above, refers to the ratio of mean over median income. However, this substitution is unproblematic since the latter is monotonically related to the Gini coefficient as long as the distribution of incomes is lognormal (see Aitchison and Brown, 1957; see also Paper C: 137).
The lognormal assumption is derived from the law of proportionate effect and is generally seen as an uncontroversial approximation for the distribution of incomes (see Lopez and Servén, 2006).3 By contrast, the measure for the structure of inequality proposed by Lupu and Pontusson (2011) relies on departures from the lognormal pattern and maps relative income distances from of the median income vis-à-vis the poor and the affluent in a metric called
“skew” (for details, see Paper D).
The third major choice concerns the reference population. Whereas a comprehensive coverage of the population is traditionally seen as a hallmark of data quality (Deininger and Squire, 1996: 568), some authors have deliberately restricted their data to households headed by a person within the main working-age bracket (Bradley et al., 2003: 208; Kenworthy and Pontusson, 2005: 449). The main argument made in favour of the latter approach is that the inclusion of pensioners “distorts the pre-tax and [pre]-transfer inequality” (Bradley et al., 2003: 208) in countries with public pension schemes. Here, people make fewer private provisions for retirement and frequently have low market incomes in old age, arguably
2 Alesina and Rodrik (1994) relied on Jain (1975) and Fields (1989) for their income distribution data.
Jain (1975: xi) compiled data without stating the income concept, advising readers to consult the original sources for details. However, the World Income Inequality Database (WIID 3.4) shows that Jain’s data included observations that variously referred to gross earnings, net incomes and gross incomes, along with data of unknown income concept. The same applies to Fields (1989) who, more- over, also included data based on consumption (see UNU-WIDER, 2017).
3 Note, however, that Paper D argues that the earnings distribution departs for the lognormal pattern where minimum wages and other labour market institutions compress the lower part of the earnings distribution.
inflating both initial inequality and subsequent redistribution. The main argument in favour of including the elderly is that public pension systems are politically contentious and have substantial redistributive impacts. As Mahler and Jesuit (2006) argue,
“it is in our view questionable simply to exclude from consideration the single social group that has made the greatest income gains over the last half century as a result of state redistribution, having been transformed from one of the most deprived groups in society to a group experiencing average levels of economic well-being” (ibid.: 499).
In a sense, the debate boils down to whether the effects of pension systems are noise or signal.
For reasons discussed in greater detail in Paper C (144f.), this thesis sides with the Mahler and Jesuit (2006) and treats pensions as a substantively interesting feature of welfare states (see also Korpi and Palme, 1998: 678f.). Hence, it uses the entire population as a reference when measuring income inequality in Papers A, B, and C. However, Paper D departs from this ap- proach to stay in line with the measurement preferences in Lupu and Pontusson (2011: 320).4
3. Redistribution as a dependent macro-level variable (Node D)
Apart from defining the explanatory macro-level variable, empirical work on the relationship between inequality and redistribution must also derive a theoretically valid measure for the main outcome variable (Node D). According to a common dictionary definition, to redistribute means to “alter the distribution of something”.5 Extending on this definition, Hicks and Swank (1984: 266f.) propose a typology of redistributive government interventions that encompasses all fiscal and regulatory policies that change the distribution of incomes.
Under this concept, labour market regulation qualifies as ‘direct normative redistribution’ due to its (intended) distributive impacts. Further, given that the configuration of property rights and contract law has long-term distributive consequences, Hicks and Swank include them under the heading ‘indirect normative redistribution’ (for further examples, see Paper A:
214f.). Likewise, by affecting growth and employment, fiscal policies can have indirect distributive consequences. As argued in Paper A (214f.), policy choices can have substantial impacts on the primary distribution of incomes (both with regard to the functional distribution and the inter-personal distribution). However, the redistributive consequences of trade liberalization or labour market de-regulation are notoriously difficult to measure. The literature on redistribution has therefore mostly confined itself to quantifying the redistributive outcomes of direct fiscal redistribution through the tax and transfer system (including Hicks and Swank, 1984, themselves).
4 Hence, it restricts measures of the independent and the dependent variable to the population to households with a household head in the main working-age bracket when measuring the structure of income inequality.
5 See, for instance, http://www.merriam-webster.com/dictionary/redistribute.
If one takes the paper “A Rational Theory of the Size of Government” by Meltzer and Richard (1981) as a point of departure, the title offers an easy clue on how the dependent variable should be measured: as the size of the government intervention into the income distribution. Since Meltzer and Richard are concerned with the tax rate that is levied on incomes, a natural indicator would be the share of primary incomes that households pay in taxes and social contributions. Recall that under the RMR model, all proceeds from taxation are disbursed as lump-sum transfers, so the size of government could equivalently be captured by measuring the size of benefits (an approach used in de Mello and Tiongson, 2006). As Paper A (227ff.) explains in greater detail, data for flows in both directions between house- holds and the state are available from the System of National Accounts (SNA).6 Beginning with the 1993 revision of the SNA, they are compiled in the Secondary Distribution of Income Account (Account II.2). Consulting the data reveals that, contrary to the assumptions of the RMR model, the tax take of real welfare states exceeds the amount of benefits disbursed (Paper A: 227). A natural solution, proposed in Paper A (229), is to construct a composite indicator for the size of government by adding both measures (or, alternatively, averaging them). Although they provide the most intuitive way to measure the size of government from the perspective of households, the SNA data have rarely been used in the literature on redistribution – possibly due to the evolution of national accounting into a highly insular branch of economics that is “relatively inaccessible to outsiders” (Bos, 1997: 174).
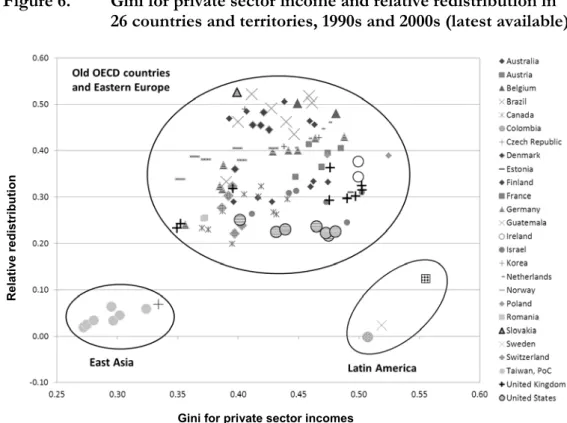
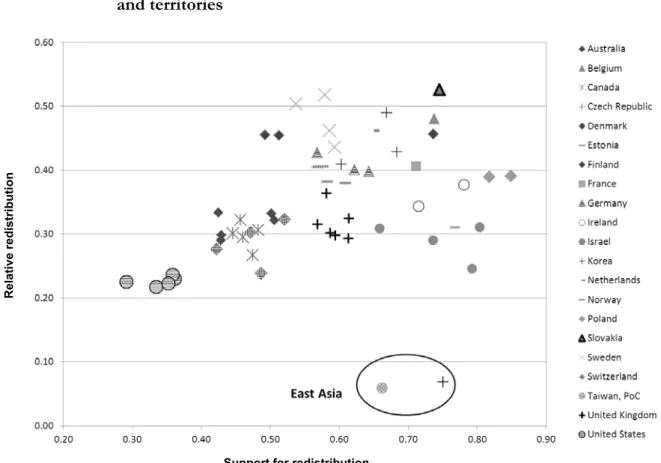
Instead of capturing the size of government directly, the literature has measured redistribution in terms of the impact that taxes and transfers have on income inequality. This approach relies on comparing the Gini coefficient for secondary incomes (i.e. after taxes and transfers) to the Gini coefficient for primary incomes (i.e. before taxes and transfers). The absolute difference gives a measure that is commonly called absolute redistribution, while the proportionate reduction in inequality is known as relative redistribution (and can be obtained by dividing the absolute measure by the Gini coefficient for market incomes; for details, see Paper A:
217). Both measures have been used to test the predictions of the RMR model. A well-known study that uses the relative measure is Bradley et al. (2003: 206), whereas examples for studies that use the absolute measure include Kenworthy and Pontusson (2005: 458) and Ostry, Berg, and Tsangarides (2014: 15). The choice of measure is often ad hoc and relies on arguments such as that absolute measures are “easier to interpret than relative measures and also more substantively sensible” (Kenworthy and Pontusson, 2005: 450).7 Even where the
6 In line with a common practice, this thesis cites the SNA by giving the year of the revision and the number of the relevant paragraph in the corresponding SNA manual.
7 They illustrate this argument by comparing Denmark and the United Kingdom, which both achieved a reduction of inequality of just under 0.11 Gini points through taxes and transfers (using the absolute measure). However, given that Denmark achieved this from a much lower initial Gini coefficient than
RMR model is a reference (ibid.: 456f.), the literature has not discussed explicitly what theory implies for the specification of the dependent variable when undertaking a formal test.
Paper C fills this gap and argues that the lack of attention to detail is surprising: One of the key advantages of the RMR model (and classical rational choice more generally) is that the theory is mathematically precise in its implications. Indeed, Coleman (1990) justifies the narrow concept of utility maximisation as necessary for the “mathematical modelling and for the quantitative research which makes use of these models” (ibid.: 18). Section 2 of Paper C therefore deducts what the premises of the RMR model imply for the specification of the dependent variable. Recall that Meltzer and Richard (1981) argue that the (linear) tax rate preferred by the median voter rises as the ratio of median over mean income grows (see Section 1). Accepting all their model assumptions (and making the additional assumption that incomes follow a lognormal distribution), it can be shown that the tax rate is equivalent to relative redistribution (for details, see Paper C: 137). By contrast, within the RMR model, absolute redistribution should rise as a function of the Gini coefficient for market incomes even when the tax rate is held constant (ibid.). This implies that the dependent variable must not be specified as absolute redistribution when testing the predictions of the RMR model.
Papers A, C and D therefore all use the relative measure for redistribution.8 Paper A (221ff.) provides descriptive statistics for level differences across countries and trends in redistribution over time.
The size measure of government intervention and the relative and absolute measures for redistribution have a common shortcoming: they limit themselves to monetary flows, and hence exclude the provision of public services (see e.g. Bradley et al., 2003: 211). Yet, the public provision of free healthcare and education (or the lack of such provision) clearly influences individual welfare. Moreover, universal provision of such services has distributive impacts that are akin to lump-sum transfers in the RMR model.9 Hence, the study of redistribution could be fruitfully extended to include non-cash benefits. While this point is almost universally acknowledged, measurement of tertiary incomes generally runs into severe problems (Paper A: 213). At the aggregate level, the SNA has extended the analysis of the redistribution process to the tertiary distribution under the Redistribution of Income in Kind Account (Account II.3; see also SNA-2008: 2.98-2.100). However, while the conceptual greater redistribution than its British counterpart. Kenworthy and Pontusson (2005: 467) conclude that
“it seems unfair to ‘penalize’ the welfare state for the high level of market inequality in the United Kingdom”. While such appeals to fairness are intuitively compelling, they are not a particularly convincing way to derive valid hypothesis tests from precise mathematical models.
8 Paper B does not use redistribution as a dependent variable, but support for redistribution.
9 Meltzer and Richard (1981: 915) themselves do not consider these but set that “[p]ublic goods are neglected”.
framework exists, few countries have implemented it.10 Measurement problems are even more daunting when it comes to household incomes, given the challenge of attributing consumption of public services to specific households and subsequently valuing these services. Hence, efforts to quantify this aspect of modern welfare states have remained as elusive as they are theoretically valid.
The three measures introduced above also have in common that they measure the outcome of government policy, rather than government output. As Castles (2011) has argued, this can be seen as an advantage since outcomes, and not outputs, are what matter to citizens. Likewise, from the perspective of the RMR model, this is unproblematic since the tax rate adopted by government (a policy output) can readily by substituted by relative redistribution (the outcome) as long as model assumptions are accepted (see Paper C: 137). However, it is poten- tially problematic when real welfare states diverge from the simplifying assumptions of the RMR model. Specifically, taxes are generally progressive (rather than linear) and transfers are targeted at households with low market incomes (and not disbursed in equal lump sums). This means that relative redistribution might automatically increase as market inequality grows, for instance when both are driven by upturns in unemployment. This automatic stabilization mechanism does not require any changes in underlying policy in response to shifting preferences of the median voter (the causal mechanism of the RMR model). Measuring policy outputs directly (and not outcomes) is one way to address this problem. To measure policy change and the progressivity of tax systems (see Ganghof, 2006), an accessible indicator is the top marginal tax rate on personal income from the OECD Tax Database (OECD, 2017).
Regarding the generosity of transfer policies, the most frequently used sources are the Comparative Welfare Entitlements Dataset (Scruggs, Jahn, and Kuitto, 2014) and unemployment replacement rates from the OECD Tax-Benefit Model (OECD, 2007).
At times, the literature on redistribution uses another traditional indicator of the welfare state literature: social spending or social transfer expenditure (see e.g. Huber, Ragin, and Stephens, 1993).11 The indicator neither captures the size of the government intervention into household incomes (since it omits taxes), nor does it capture the effect that transfers have on the income distribution. Given these drawbacks and the increasing availability of data on the distributive impact of taxes and transfers, the indicator has fallen out of favour in the literature on
10 The SNA uses “adjusted disposable incomes” as the balancing item in the Redistribution of Income in Kind Account. It is equivalent to the more common term “tertiary incomes”.
11 The main current data-sources are the OECD’s Social Expenditure Database (SOCX) and the IMF’s Government Finance Statistics (GFS) (series “Expenditure by Function of Government”).
redistribution.12 In any case, Paper D uses social spending as an alternative dependent variable to test the robustness of results obtained on relative redistribution.
4. Testing the macro-level proposition (Arrow 4)
Having discussed the appropriate definitions for both of the macro-level variables, a natural next step is to ask whether the macro-level relationship between more inequality and greater redistribution holds (Arrow 4). Empirical proof for the existence of a positive association between inequality and redistribution is a necessary, but not a sufficient condition towards confirming the causal mechanisms proposed by the RMR model. Since it presents a universal model of human motivation and government responsiveness, its predictions should be valid both within and between countries. The crucial condition for the model to hold is majority rule,13 and there are two parameters that drive change: shifts in the inequality of primary in- comes14 and (historically) the extension of franchise. Since all contemporary OECD countries have universal suffrage and majority rule, changes in primary income inequality remain as the only relevant explanatory variable to test the predictions of the RMR model.15 This section will provide a brief overview of how the literature has examined the macro-to-macro link from inequality to redistribution, and which contribution this thesis makes in Paper C and D.
The first generation of empirical tests of the RMR model relied heavily on inequality statistics from secondary data compilations (hence mixing observations with different income concepts).16 Many of the most influential early papers on inequality and redistribution did not actually test the macro-level proposition itself, but the extension of the RMR model that links higher inequality to lower subsequent growth (attributing the effect to distortions caused by redistributive taxes). Examples include Alesina and Rodrik (1994), Persson and Tabellini (1994) and Clarke (1995). They generally find that higher inequality and lower growth go hand-in-hand. Within this body of literature, Perotti (1996) was the first to test the link from
12 One of the more passionate defences of the social expenditure indicator holds that it is “less bad than its reputation” (see Jensen, 2011).
13 Meltzer and Richard (1981) are explicit that the build a model where “the size of government […] is determined by majority rule” (ibid.: 914). Their application of the median voter theorem does not presuppose a majoritarian electoral system, although some authors have interpreted this as an implicit condition (e.g. Houle, 2017: 3). See also the discussion in Section 8.
14 Meltzer and Richard (1981) use productivity, which corresponds to primary incomes if wages reflect productivity (a common but controversial assumption) and there are no capital incomes (from which the RMR model abstracts).
15 Note, however, that some contributions to the new growth literature extended the argument to non- democracies (Clarke, 1995: 415). See also the discussion in Section 8.
16 The most frequently used sources are Jain (1975), Fields (1989), Deininger and Squire (1996) and later the World Income Inequality Database (WIID) maintained by UNU-WIDER (2017).
inequality to redistribution, using both social spending and direct measures for tax policy as the dependent variable. His results upset the prevailing consensus: He found a “very weak, or even non-existing, negative relationship between equality and fiscal variables” and, contrary to expectations, also a “positive association between fiscal policy variables and growth” (ibid.:
172). Likewise, de Mello and Tiongson (2006) found a negative association between inequality and redistributive government spending, measured alternatively as government transfers to households from the SNA and as social spending from the IMF’s Government Finance Statistics (GFS).
Given the shortcomings of the inequality data from secondary sources (Atkinson and Brandolini, 2001), the second generation of empirical papers has turned to micro-data from household surveys. By far the most widely used source for cross-national studies is the Luxembourg Income Study (henceforth LIS). The LIS harmonizes household income datasets and makes them accessible to researchers. The data have the key advantage that they allow extracting measures for primary and secondary income inequality that are in line with the theoretical requirements outlined in the two preceding sections. The first large and rigorous test of the macro-level proposition based on the LIS is Milanovic (2000). He uses the Gini for factor incomes as the explanatory variable and runs a set of fixed-effects regressions, finding that greater inequality is associated with a greater gain in the income shares of the bottom half and the bottom quintile (ibid.: 384). Since the regressions refer to changes within countries and do not control for cyclical effects, one cannot infer whether the association is due to automatic stabilization effects or due to policy changes made in accordance with the shifting preferences of the median voter. Milanovic (ibid.: 391) points to another oddity in his data, namely that redistribution generally leaves the median voter worse off (only the three lowest deciles gain in absolute terms). Against the assumptions of the RMR model, tax and transfer systems apparently do not maximize the utility of the median voter. Milanovic (ibid.: 395f.) advances two potential explanations, namely that the preferences of the median voter also reflect insurance motives (see Section 7 below) and that the process through which preferences are aggregated diverges from the median-voter model (see Section 8 below).