Market concentration in the banking sector:
Evidence from Albania
Arjan Tushaj
Working Paper No. 73 April 2010
k*
b
0 k
BA M
AMBERG CONOMIC
ESEARCH ROUP
BE RG
Working Paper Series BERG
on Government and Growth
Bamberg Economic Research Group on Government and Growth
Bamberg University Feldkirchenstraße 21
D-96045 Bamberg Telefax: (0951) 863 5547 Telephone: (0951) 863 2547 E-mail: public-finance@uni-bamberg.de http://www.uni-bamberg.de/vwl-fiwi/forschung/berg/
ISBN 978-3-931052-81-2
Reihenherausgeber: BERG Heinz-Dieter Wenzel Redaktion
Felix Stübben∗
∗ felix.stuebben@uni-bamberg.de
Market concentration in the banking sector:
Evidence from Albania
1A
RJANT
USHAJ2,
Department of Economics,
Faculty of Business Administration and Economics, University of Tirana, Albania
Abstract
The market structure can be described by concentration ratios based on the
oligopoly theory or the structure – conduct – performance paradigm. Measures of concentration and also competition are essential for banks conduction in the banking industry. Several researchers have proved concentration level to be major determinants of banking system efficiency. Theoretical characteristics of market concentration measures are illustrated with empirical evidence. The market
structure of the Albanian Banking Sector has changed dramatically in recent years.
On 1990s, our country has experienced deregulation, foreign bank penetration, and an accelerated process of consolidation and competition in the banking sector.
Particularly, the working paper examines the nature and the extent of changes in market concentration of Albanian banking sector. It focused primarily on a
descriptive and dynamic analysis of change in the concentration indices in banking sector from year to year. Also it examines how the inherited structure of the
banking system affects the way of the distribution of market shares amongst the different banks that comprise on the banking sector.
Key Words: Bank Concentration, Concentration ratios, HHI index, Market Structure JEL Classification: A20, G09
1 I would like to thank Prof. Dr. H.-Dieter Wenzel for his assistance and comments. This working paper was prepared during my stay in Bamberg from 20th of November to 20th of December 2009. The stay was financed by University of Bamberg through the DAAD (Stability Pact for South Eastern Europe).
2 Any comment or suggestion is welcomed. Contact e-mail: arjantushaj@hotmail.com
Content
1 Introduction ... 3
2 Literature review ... 4
2.1 Controversial results: Pro and cons banking concentration ... 4
2.2 Relationship between market concentration and banking competition... 6
3 Structural changes in Albanian banking sector ... 8
3.1 The first phase 1992-1997: Banks under "State Monopoly"... 8
3.2 Second phase 1997–2002: Banks under Privatization ... 8
3.3 Third phase 2003 - 2007: Privatization of the whole banking system ... 9
4 Measures of banking concentration... 10
4.1 Literature review on measures of concentration in banking industry ... 10
4.2 Measures of market concentration in Albanian banking sector ... 14
4.2.1 Market concentrations on banking assets ... 14
4.2.2 Market concentrations on banking deposits... 15
4.2.3 Market concentrations on banking credits ... 16
4.2.4 Market concentrations on Treasure bills... 18
4.3 Concentration and ownership in Albanian banking sector... 19
5 Conclusions ... 21
6 Literature ... 23
ARJAN TUSHAJ
Market concentration in the banking sector:
Evidence from Albania
1 Introduction
The changes in the market structure of firms could be examined through various measures. In order to analyze the market structure on banking industry, sometimes we focused on banking concentration. Market concentration is one of the most im- portant determinants of competitiveness (Nathan and Neavel, 1989). There are nu- merous ways of measuring banking concentration. While Rose (1999: 687) states:
“the degree of concentration in a market is measured by the proportion of assets or deposits controlled by the largest banks serving that market”, Demirgüç -Kunt and Levine (2000) measure banking system concentration via the fraction of bank loans controlled by the three largest banks in a banking system. According to Bonin (2004), former centrally planned economies used to be characterized by a notice- able structural segmentation (i.e. large specialty banks monopolizing specific mar- ket segment), state ownership of a significant proportion of banking assets and high concentration ratios.
First of all, we have to present the development of banking sector in Albania. Bank- ing sector in Albania has undergone a deep transformation since 1992 and wit- nessed an impressive growth over recent years. The banking industry remains the largest and the most development segment of the Albanian financial market. The banking sector plays an important role in economy but it cannot be considered iso- lates from historical political and economic environment.
The banking sector before the ’90 was a mono bank. Bank deposits were the only
officially available savings / investment instruments for individuals in socialist Al-
banian economy. The exclusive source of external financing for the enterprise sec-
tor was credit provided on the basis of investment and production decisions by cen-
tral planning bodies. State Bank of Albania the only bank that functioned did not
take credit allocation decisions and did not need to evaluate credit risk. State Bank
of Albania performed both central bank and the commercial bank functions. As a
central bank, it was responsible for issuance of currency, supervision of monetary
policy and it assisted the needs of state enterprises for credit and money depositing
by keeping their accounts. Another bank that operated in agricultural sector was the Agrarian Bank like depositing and lending institution.
The first important step in the reformation of the Albanian banking system was the creation of a two-tier banking system. This transformation was only made possible in Albania through the law of the Bank of Albania passed by the parliament in April 1992. The law of 1992, installed from the independent point of view, a broad autonomy for the Bank of Albania. This bank retained all traditional functions of the Central Bank (direction of the monetary policy, credits, interest rates, exchange rates and emission), while the new commercial banks recently born, were in charge of all transactions of credit allocation and acceptance of deposits from businesses and individuals.
So the approval of new legal framework of banking system on 1992 marked the establishment a new banking system. It acclaimed Bank of Albania as a central bank as the existence of three state- owned banks; Saving Bank (SB), National Commercial Bank (NCB) and Agriculture Commercial Bank (ACB). The second level banks inherited the activity of formers bank (two banks and one saving – insurance institute).
After two decades of transition process, Albanian financial sector belongs to the type of model that is “The financial sector dominated by the bank sector”.
The paper is organized as follows. The following section provides a review of the relevant literature. Section 3 gives an overview of dynamic changes on Albanian banking sector. Section 4 presents the relevant literature on the measures of con- centration in banking industry. Also it presents and discusses the empirical results of market concentration in Albanian banking sector. And finally Section 5 con- cludes the working paper.
2 Literature review
2.1 Controversial results: Pro and cons banking concentration
The degree of banking market structure matters for competition and performance has been a “hotly debated topic”. The outcomes of numerous researches have re- sulted in the existence of numerous bank concentration theories in the literature.
These theories could be classified into pro-concentration and cons concentration
theories. Concentration refers to the degree of control of economic activity by large
firms (Sathye, 2002: 10). The increase in concentration levels could be due to con-
siderable size enlargement of the dominant firm(s) and/or considerable size reduc-
tion of the non-dominant firm(s). Conversely, reduction in concentration levels
could be due to considerable size reduction of the dominant firm(s) and/or consid- erable size enlargement of the non-dominant firm(s) (Athanasoglou et al., 2005:
25).
Proponents of banking sector concentration argue that economies of scale drive bank mergers and acquisitions (increasing concentration), so that increased concen- tration goes hand-in-hand with efficiency improvements (Demirgüç -Kunt and Le- vine, 2000: 1). Some theoretical arguments and country comparisons suggest that a less concentrated banking sector with many small banks is more prone to financial crises than a concentrated banking sector with a few large banks. This is partly be- cause reduced concentration in a banking market results in increased competition among banks and vice-versa. Proponents of this ‘‘concentration-stability’’ view argue that larger banks can diversify better so that banking systems characterized by a few large banks will be tend to be less fragile than banking systems with many small banks (Allen and Gale, 2003). Concentrated banking systems may also en- hance profits and therefore lower bank fragility. High profits provide a buffer against adverse shocks and increase the franchise value of the bank, reducing in- centives for bankers to take excessive risk. Furthermore, a few large banks are eas- ier to monitor than many small banks, so that corporate control of banks will be more effective and the risks of contagion less pronounced in a concentrated bank- ing system (Beck, Demirgüç -Kunt and Levine, 2003: 1).
Cons concentration, there is evidence linking increase in banking concentration to
reductions in credit supply. In the United States, Berger et al (1995) find evidence
that the increase in the proportion of banking industry assets controlled by the larg-
est banking organizations in the 1990s, due to the liberalization of geographic re-
strictions on banking in the United States, may have been responsible for part of the
credit crunch observed in 1989-92. It has also been argued that the higher the con-
centration in the local bank market; the higher prices are for financial services, and
consequently the higher the banks’ profits. This is because banks in less competi-
tive environments charge higher interest rates to firms. If concentration is positively
associated with banks having market power, then concentration will increase both
the expected rate of return on bank assets and the standard deviation of those re-
turns (Beck, Demirgüç-Kunt and Levine, 2004: 2). The policy implication is that
higher market concentration is associated with lower socio-economic welfare and,
therefore, higher concentration is undesirable. Another cons concentration position
is that a more concentrated banking structure enhances bank fragility. Advocates of
this “concentration-fragility” view note that larger banks frequently receive subsi-
dies through implicit ‘‘too big to fail’’ policies that small banks do not enjoy (Boyd
and Runkle, 1993). Proponents of the concentration-fragility view disagree with the
proposition that a few large banks are easier to monitor than many small banks. If size is positively correlated with complexity, then large banks may be more opaque than small banks, and therefore more difficult to monitor. This would tend to pro- duce a positive relationship between concentration and fragility.
Theoretical results demonstrate that monopolistic market power of banks raises the opportunity costs of capital and thus, tends to make financing more expensive (Smith, 1998). Lack of adequate competition in banking could thus, adversely af- fect economic development.
2.2 Relationship between market concentration and banking competition
The literature on the measurement of competition may be divided into two main- streams, called the structural and the non-structural approach. The structural ap- proach to model competition includes the Structure-Conduct-Performance (
SCP) paradigm and the efficiency hypothesis, as well as a number of formal approaches with roots in Industrial Organization theory. The
SCPparadigm investigates whether a highly concentrated market causes collusive behavior among larger banks resulting in superior market performance; whereas the efficiency hypothesis tests whether it is the efficiency of larger banks that makes for enhanced perform- ance. In reaction to the theoretical and empirical deficiencies of the structural mod- els, non-structural models of competitive behavior have been developed: the Iwata model, the Bresnahan model, and the Panzar and Rosse model. These New Empiri- cal Industrial Organization approaches measure competition and emphasize the analysis of banks’ competitive conduct without using explicit information about market structure.
If we accept the theoretical proposition according to which a more concentrated market implies a lower degree of competition due to undesirable exercise of market power by banks. Other theories (e.g. contestability theory) maintain that, under par- ticular conditions, competition and concentration can coexist.
To analyze competitiveness in any sector, an in-depth analysis of the structure of the market is essential. While highly concentrated markets do not necessarily imply lack of competitive behavior, it is generally agreed that market concentration is one of the most important determinants of competitiveness (Nathan and Neavel, 1989).
For banking sector, the relationship between market concentration and competi-
tiveness has been examined in detail for many countries and the results indicated
that a high concentration tends to reduce competitiveness in this sector (Gilbert,
1984).
Given the current wave of mergers in the EU banking market and the expectation of continued or even accelerating consolidation, concerns have been voiced as to competitive conditions in the EU banking markets, especially in some market seg- ments, such as local and retail markets. More precisely, the question emerges whether market concentration might affect the conduct of banks or the degree of competition. Theoretically, the existence of a relationship between market structure and banks’ behavior is indicated by, among others, the Panzar-Rosse model.
Where, in the literature, the impact of the banking market structure on bank per- formance has been examined exhaustively - employing the Structure-Conduct- Performance (SCP) paradigm - the relevance of market structure for conduct or competitive conditions has been almost entirely ignored
1. This section aims at pre- senting this disregarded relationship and seeks to assess a possible impact of the number of banks and the banking market concentration on competition. However, as a description of the market structure, the number of banks is a rather limited concept. Empirical studies concerning the impact of market structure on banks’
conduct are rare. In order to investigate this relationship, the estimated
H-values
2indicating competition are used as proxies of conduct and are related both to the concentration indices considered and to the absolute number of banks operating in these markets, acting together as a proxy of the market structure. The impact of both market structure measures on competition appears to be significant, most markedly so when the
k-bank concentration indices are used. The latter confirms the observation that a few large (cartel) banks can restrict competition and that a multitude of fringe competitors is unable to engender competition. Casu and Girar- done (2006) examine banking markets for 15 European Union countries over the period 1997-2003 and find no evidence that their calculated H-statistics are related to concentration measures. Similar results are found by Claessens and Laeven (2004) in a study of 50 countries over the period 1994-2001.16 Yildirim and Philippatos (2007) find no significant link between concentration and competition (using the H-statistic) for eleven Latin American countries for the period 1993- 2000, but do find evidence that openness to foreign entry increases competition.
1 See Calem and Carlino (1991) for an example of the empirical approximation of conduct.
2 See Bikker and Haaf, 2001b.
3 Structural changes in Albanian banking sector
3.1 The first phase 1992-1997: Banks under "State Monopoly"
In this phase, banking sector was associated with several shortcomings and positive developments but however fragile. The most important evolution was the creation of a two-tier banking system. This transformation was only made possible in Alba- nia through the law of the Bank of Albania passed by the parliament in April 1992.
The law of 1992, installed from the independent point of view, a broad autonomy for the Bank of Albania. The new legal framework acclaimed Bank of Albania as a central bank as the existence of three state- owned banks; Saving Bank (SB), Na- tional Commercial Bank (NCB) and Agriculture Commercial Bank (ACB). The second level banks inherited the activity of former bank (two banks and one saving –insurance institute). But the level of financial intermediation was limited. State banks that dominate about 90% in the deposit market, carry out limited functions of financial intermediaries, while new private banks were limited in number (only 4) and uninterested to attract deposits in leks. The lowest level of crediting to the economy (only for state enterprises) was a expression of low-level mediation in addition to the low level of payments’ system. For example, at the end of 1996, the implementation of payments for transactions through accounts in different branches of the same bank required on the average of 5-6 days, while transactions between different banks required over 15 days. Because of it, the levels of money outside banks were extremely high. The numbers of banks were growing up 3 to 6 respec- tively till 1992 to 1996.
3.2 Second phase 1997–2002: Banks under Privatization
Privatisation of the banking system means, weakening the role of the state in exis- tent banks, creating new private banks, and also increasing competition. Privatiza- tion of the state-owned banks can contribute to this restructuring. In 2002 after 10 years of privatisation the Albanian Banking sector was still dominated by the last state-owned bank, Saving Bank. Saving Bank was dominant in the overall perform- ance of the Albanian banking system, network extension, deposit market and T- bills market. Some of the main indicators of the SB in that period were (Bank of Albania, 2003):
•
Territorial expansion with over 200 branches and agencies
•
About 60% of total deposit of banking system
•
About 75% of T-bills market
•
Over 70 % of the retiree payments
•
Over 90 % of the payments volume for state budget accounts
•
The total of assets was 170 billion leks. (1 euro = 143 leks)
The financial crisis of 1997 caused of pyramid schemes lie ahead to be solve the
dilemma: Liquidation – Reconstruction – or Privatization for the state owned capi- tal banks.Agricultural Commercial Bank went into liquidation and part of its assets was distributed to other state –owned banks while bad loans, were transferred to the Agency of Credit Restructuring. After a long discussion to be liquidated or to be privatized, lastly was decided that the other state-owned banks National Commer- cial Bank to privatized too. The inefficiency of these banks showed that the first steps of restructuring the system were inadequate. So Saving Bank before privatiza- tion underwent a structuring process. Reforms on financial sector had recorded sig- nificant progress related to the privatization of state banks, thus reducing their dominance in the market. In 1997-2002, the composition of banking sector was formatted
according to ownershipand presents as following:
•
state - owned bank, Albanian Savings Bank (G1)
•
joint -venture banks (G2)
•
private banks (G3)
Banking activity expanded to the expansion of banks in the market, through in- creasing assets, financial intermediation and quality of banking services. A positive trend was improving credits’ market as a steady increase of lending to the private sector. It was associated with the reduction of “bad” credits to total credits which it was 6.4 % in the September 2002 compared with 32.7 % in 1999
3. This phase re- lated to the entry of various private banks, particularly foreign banks. The number of second tier banks went to 14 or two more times compare to the end of 1996.
3.3 Third phase 2003 - 2007: Privatization of the whole banking system
After the privatization of the second bank of G1, National Commercial Bank (NCB) in 1999, Saving Bank (SB) was the last representative of state–owned banks. SB (actually Raiffeisen Bank) continued to keep its domination on deposit market, was competing with private banks which were raising significantly their market share, by involving more risk and profitable assets. So versus the biggest bank in the system were the private banks that had bolstered competition in the
3 Source: Bank of Albania, 2003.
market and contributed to an increase in the range and quality of financial services in the country.
In 2003-2007, the composition of banking sector was formatted
according to asset share owned by banksin percentage. Thus, we distinguish three main peer groups:
•
Banks that have less than 2 % of assets volume (G1);
•
Banks that have less more than 2 % of assets volume but less than 7% (G2);
•
Banks that have more than 7 % of assets volume (G3);
During this period happened privatization of the state's largest bank, the Savings Bank which it purchased by a large international bank as Raiffeisen International.
This transaction turned entirely banking sector into private ownership. It would have the direct effects on banking competition. However the moment of privatiza- tion of the Savings Bank coincided with the entry into force of Law no. 9121 "On protection of competition", which does not prevent possession of a dominant posi- tion, but only abuse this dominant position. Meanwhile, three new private banks:
Credins, People's Bank and Union Bank with Albanian ownership entered into banking system. Thus they reduced the foreign shareholders into banking system which it was dominated by them until now. From an oligopolistic market structure in the last decade, it went towards market of monopolistic competition. Banking sector is associated with several mergers of foreign banks during 2007. These de- velopments have had a major impact on market concentration and threaten domes- tic capital ownership. In recent years, the Albanian banking system is characterized by a continued increased trend, both in terms of number of banks and in the expan- sion of banking activity. These trends are accompanied by an increase of lending activity and expansion of the range of products offered by banks, too. At the end of 2007, there were 17 second level banks on banking market.
4 Measures of banking concentration
4.1 Literature review on measures of concentration in banking industry
The concept of industrial concentration has been comprehensively treated and de-
batable in the economic literature. Structure – Conduct – Performance (SCP) para-
digm can be based on any concentration ratio. Two formal derivations of the com-
petition – concentration relationship based on oligopoly theory each exactly define
the relevant concentration ratios. The significance of concentration ratios comes
due to their ability to capture structural features of the market. Concentration ratios
are also able to reflect changes in concentration as a result of the bank’s entry into
the market or its exit from it, or caused by a merger. Despite the several various approaches related to its measurement, the principal elements of concentration measures are number of banks and the distribution of bank size in a given market.
Like indices of inequality, various concentration indices put different weights over different parts of the distribution of market shares across firms and may give am- biguous results. Let there be
nfirms in an industry with market shares
s1, s2,.. , sn.A simple but general linear form of an index of industrial concentration (
IC) is:
1 n i i i
CI s w
=
=
∑
whereby
wi(
i=1,2, …, n) are the weights attached to the market share.
Marfels (1971) and Dickson (1981) discussed the weighting schemes of a number of concentration ratios. Following the taxonomy of Marfels (1971), there could be four broad classes of weighing schemes: (i) unity to top
kfirms and zero to the rest, (ii) individual ranks of firms, (iii) firms’ own market shares or their power, and (iv) the negative of the logarithm of market shares. The weighing scheme reflects dif- ferent assessment regarding the relative impact of larger and smaller firms. De- pending upon the weighing scheme, the individual measures may vary, but they may lead to similar orderings.
There are several indicators to concentration ratio of k-banks. Amongst of them emphasize
4: the concentration ratio
(CRk); Herfindahl - Hirschman index
(HHI); Hall - Tideman index
(HTI); Rosenbluth index
(RI); Comprehensive Industrial Concentration Index
(CCI); Hannah and Kay index
(HKI); The index
(U); mul- tiplikativ Haus index
(Hm); additive index Hausa
(ha)and the entropy measure
(E). The most common measure used in the literature on market concentration has been a simple concentration index, aggregating such shares of a few top firms (say,
k).
These measures for banking firms are called
k-Bank Concentration Ratios. There is no rule for choosing an appropriate value of
k. So, the number of firms included in the concentration index is an
ad hocand an arbitrary decision. The index ranges from zero to unity. The index approaches zero for an infinite number of equally sized banks and it equals unity, if the firms included in the calculation of the con- centration ratio make up the entire industry. It takes the forms:
1 n
k i
i
CR s
=
=
∑
4 See Bikker and Haaf, 2001a
This indicator ignores many small banks in the market. If the industry consists of
"
k" banks with the same size,
1 1
n n
k i
i i
CR s i k
n n
= =
=
∑ ∑
= =,
which is an ascending function of the banks’ number in the market, from which flows an equivalent number:
ne = k/CRk(White, 1982).
Another popularly used measure is the Hirfendahl-Hirschman index (HHI). In the United States, HHI plays a significant in the enforcement process of antitrust law in banking sector. It often called the full-information index because it captures fea- tures of the whole distribution of bank sizes. For
nfirms in an industry with market shares
si, (
i=
1,2, ... , n), the HHI is defined as:
2 1 n i i
HHI s
=
=
∑
By definition (1/
n) <HHI <1, where
nis the number of banks in banking industry.
The maximum concentration of unity occurs in the case of monopoly
.Minimum of concentration (
1/n) occurs when each bank has an equal share of
1/n. Despite its popularity, HHI suffers from a few limitations. A major limitation is that distribu- tions of market shares with radically different tail properties may have HHI of simi- lar magnitude (Rhoades, 1995). Recently, Maasoumi and Slottje (2002) have ar- gued that common economic phenomena like mergers between a strong and a weak bank or entries and exits only change certain parts of the distribution of market share – often the tails only. Indices based solely on “dispersion’’ or variance, (e.g., HHI, Gini,
etc.) may miss such changes.
Davies (1979) analyzed the sensitivity of HHI into two compound parts: the num- ber of banks in the market and the inequality in market shares among the different banks. He found that the index becomes less sensitive to changes in the number of banks, to the larger number of banks in the industry.
HHI can be written as an increasing function of the population variance of market shares.
Various authors propose connecting the Herfindahl-Hirschman Index to distribu-
tional theories by presenting it in terms of the moments of the underlying bank size
distribution. The first attempt to present the HHI in terms of distribution’s mean
and variance has been undertaken by Adelman (1969). Kwoka (1985) rewrote the
Herfindahl-Hirschman Index as:
( )
21 n i i
HHI s s s
=
= +
∑
−by defining the mean market share as s = 1 n .
Re-arranging yields the HHI as an inverse function of the banks’ number in the in- dustry and a direct function of the market shares’ variance about the mean:
1
2HHI n
n
σ
= +
This presentation picks up two features of the Herfindahl-Hirschman Index. First, the relation between the number of banks and HHI value is not a simple one. For given number of the banks in the market, the HHI increases with the variance, which it is itself a function of the number of banks in the market (Adelman, 1969).
Secondly, it is ambiguous because of a variety of combinations of the number and size of banks can produce the same HHI (Kwok, 1985).
In the context of the hypothetical market analysis, Rhoades (1995) argued that ine- quality of market shares to banks can change substantially in different markets and keeps the same value of HHI. It is possible to compute an equivalent number of HHI as:
1
ne= HHI
per value of HHI (since
2 2
1
1 1
n
i
HHI i n
n n n
=
⎛ ⎞ ⎛ ⎞
= ∑ ⎜ ⎟ ⎝ ⎠ = ⎜ ⎟ ⎝ ⎠ = proving evidence that at least two different bank size distributions can generate the same HHI).
Hart (1975) took a somewhat different approach to insert the HHI into distribu- tional theory. He emphasized that there are some cases where the exact number of banks in an industry is unknown, but information is available about both the bank- ing market size and banks’ size classification. He proposed to separate the total dis- tribution of banks sizes into classes and to calculate the parameters of the original distribution from the parameters of the first moment of distribution if the relation- ship between the distributions is known. He obtained a definition of HHI given by:
2
1
HHI n
η
+=
where η
2is the coefficient of variation of the original distribution. As long as the
coefficient of variation does not change, an increase in n will result in a decrease of
HHI. Hart considered the sensitivity to the entrance of the smallest banks in a oli- gopolistic market as the greatest disadvantage of the index.
4.2 Measures of market concentration in Albanian banking sector
The dynamic developments in banking sector have had a major impact on market concentration. Let’s analyze the empirical results of banking concentration in the Albanian banking market, referring to the concentration ratios, CR
3and CR
5and the Herfindahl-Hirschman Index during 2000-2008. Concentration indices are cal- culating for four components of banking activity: assets, deposits, credits, treasure bills.
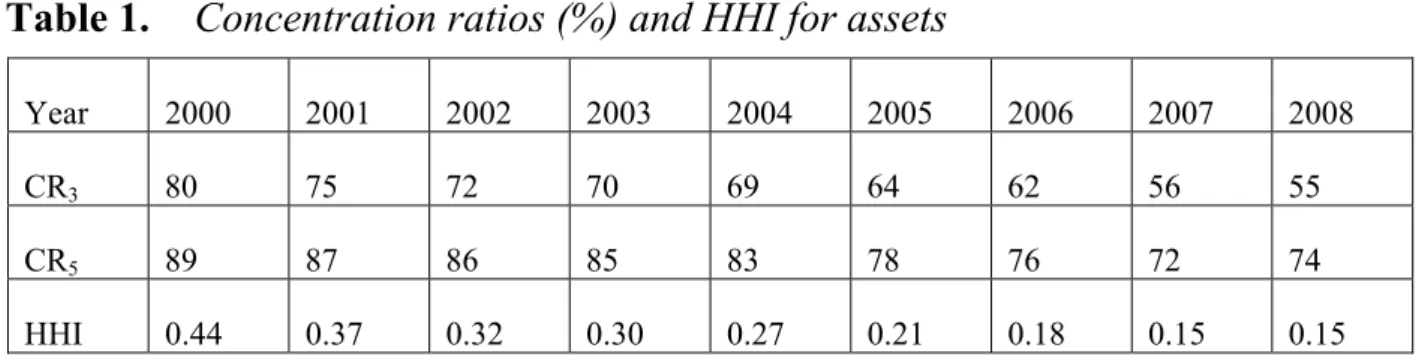
4.2.1 Market concentrations on banking assets
The banking sector in Albania has generally been described by the dominating po- sition of the large five banks. An important indicator for measuring the concentra- tion level is the CR
5-Concentration ratio-calculating the weight of 5 largest banks in the system to total assets of the system. The share of these 5 banks in overall assets of banking system was 83 percent by the end of 2004 - a year when SB began to act as private bank-to 74 percent in the end of 2007. During the last years, this indica- tor has shown a continuous falling trend, with a deviation in 2008, due to the merger of two banks. The structure of banking sector has evolved substantially. The increase in number of banks and expansion of activities has slightly reduced the dominance of banking system by G3 banks, although the market share of this group continued to be high. In December 2008
5, the shares of peer bank groups to total assets of the system are 3.9 percent, 31.0 percent, 65.1 percent for G1, G2 and G3, respectively, versus 3.6 percent, 30.3 percent and 66.1 percent at the end of the third quarter of the year; and 3.4 percent, 27.9 percent and 68.7 percent at the end of 2007.
However the Herfindahl-Hirschman Index to total assets showed stable levels. In recent years, there has been great progress towards optimal concentration level, al- though still far from it. Despite the incident trend of concentration indicators during this period, assets’ market in the Albanian banking sector continues to be highly concentrated. Table 1 presents the empirical results for banking assets during 2000- 2008. HHI calculations for all components are based on Kwoka version (1985). See subsection 4.1.
5 Bank of Albania, Supervision Annual Report, 2008.
Table 1.
Concentration ratios (%) and HHI for assets
Year 2000 2001 2002 2003 2004 2005 2006 2007 2008
CR3 80 75 72 70 69 64 62 56 55
CR5 89 87 86 85 83 78 76 72 74
HHI 0.44 0.37 0.32 0.30 0.27 0.21 0.18 0.15 0.15 Source: Bank of Albania, 2000-2008, own calculations
4.2.2 Market concentrations on banking deposits
Saving Bank had a dominant position in the deposit market too, holding about 60 % of it. There was the largest concentration in the deposits market. It is important to mention that private banks were more active in foreign currency deposits market and current account deposits, where SB had no dominance. At the same time SB had monopole position in leks deposits. It has about 80 % of them. After the priva- tization of Saving Bank, the dominant position of SB in the deposits market substi- tuted by the dominating position of the 5 largest banks. During the last years of this period, we see that deposits structure, expectations and preferences of clients changed as a result of increasing competition among banks of G1 and G2. Analyz- ing deposit concentration by number of depositors, we note that G1 small-sized banks have the highest number of depositors. The Albanian banking system shows a high degree of deposit concentration, where the 5 largest banks in the system comprised 78 percent of total deposits, at end-December 2008.
After 2003, according to the HHI for deposits continued to be high that it indicates the market is more concentrated on G3, otherwise the trend is decreasing. The main reason was the inherited structure of banking sector. Table 2 presents us a view on banking deposits concentration in the market.
Table 2.
Concentration ratios (%) and HHI for deposits
Year 2000 2001 2002 2003 2004 2005 2006 2007 2008
CR3 84 80 77 75 73 68 65 60 62
CR5 92 90 88 87 85 81 79 76 78
HHI 0.50 0.43 0.37 0.35 0.31 0.24 0.20 0.17 0.17 Source: Bank of Albania, Supervision Annual Report, 2000-2008, own calculations
Deposit market remains concentrated compared with the assets market. Although
the level of concentration of deposits among the years has fallen, the figures are
greater than optimal value, which shows a high concentration of market deposits in the banking sector. This may come as a result of a combination of several factors:
use of high levels of capital and disengagement of deposits as a source of funds by some banks (mostly new banks); preferences of customers; facility in access of cus- tomers if we take into account the geographical distribution of bank branches and agencies.
The Herfindahl-Hirschman Index is correlated to the number of banks and mone- tary aggregate, M2. This relationship relies on an econometric estimation. The econometric analysis gives the following linear model:
dHHI = 4.675 – 0.684 * M2 – 0.036 * nr
Results are significant (because R
2= 0.97), but the coefficients of variables are sig- nificant, too (p<0.05). Meanwhile the effect of the number of banks on HHI for de- posits is consistent to the theory. As we see in the model, the sign of number of banks is negative. That means a negative relationship between HHI for deposits and the number of banks. If we refer to the effect of monetary aggregate, M2, is also negative. That means the increasing of M2 which compounded by several kinds of deposits, associated with decreasing of HHI for deposits. Growing up of deposits volume linked to the prospect of depositors to put down their deposits in different banks.
4.2.3 Market concentrations on banking credits
Analysing the concentration ratios for total credits we conclude that SB had a dominant position like as on the other activities. At 2001-2002 SB not only had dominant position but its percentage of credits represents minimal figures. What’s happened?
During the last decade, lending activity from banking sector depended by political
and economic factors as well as by other phenomena characteristic for transition
period in Albania. During 1993-1999 Bank of Albania (Central Bank) applied di-
rect instruments of monetary policy, establishing limitations on lending from bank-
ing system. But this instrument had not prevented the banks from crediting of
economy. Till end of 1996, credit market was dominated by three state owned
banks. In views of various factors, these banks did not select efficiently their clients
and bad loans occupied the credits system. In 1997 it reached to 60%. For this rea-
son Bank of Albania suspending lending activity of banks whose bad loan ratio was
above 20%. In this period SB was impeded to extend credits till its privatisation
and had no influence in credits market. Its dominant position from 1997- 2000 has
been results of inherited excess of credits.
Analysing the concentration index for total credits, we conclude that till of end 2007, 5 banks of G3 that we mentioned above have a dominant position like as in the other activities. During this period H-index has been almost the same, with some small changes. The credit indicators have not evidenced any change, reflect- ing the greatest stability in years. Table 3 presents the empirical results on concen- tration of credits market.
Table 3.
Concentration ratios (%) and HHI for credits
Year 2000 2001 2002 2003 2004 2005 2006 2007 2008
CR3 78 69 62 54 46 43 43 45 47
CR5 91 86 83 79 69 63 64 66 68
HHI 0.27 0.20 0.17 0.15 0.11 0.10 0.11 0.11 0.12 Source: Bank of Albania, Supervision Annual Report, 2000-2008, own calculations
The lending activity is less concentrated in Albanian banking market, also showing the incident on the concentration trend. Credit market is characterized by a moder- ate level of concentration during the years 2002 - 2008, with HHI within border 0.1-0.18, which corresponds to a moderate level of concentration. Although, the low values of concentration indicators of credit market, in 2008; put a slight in- crease of these indicators compared to 2006 and 2007.
Herfindahl-Hirschman Index is correlated to the number of banks and the annual interest rate of credit. The econometric analysis presents the estimation of follow- ing linear model:
cHHI = 0.438 – 0.023 * nr + 0.50 * cr
Results are significant (because R
2= 0.96), but the coefficients of variables are sig-
nificant, too (p<0.05). In the meantime, the effect of the number of banks on HHI
for credits is consistent to the theory. As we see in the model, the sign of number of
banks is negative. That means a negative relationship between HHI for credits and
the number of banks. If we refer to the effect of the annual interest rate for credits is
positive. That means the increasing of annual interest rate of credits associated with
rising of HHI for credits. Growing up of annual interest rate for credits linked to the
prospect of banks’ behavior in the market. The impact of their behavior inclined to
the market concentration, referring to SCP paradigm.
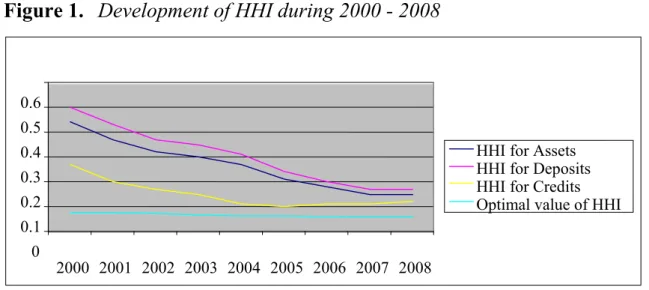
Source: Supervision Annual Report of Bank of Albania, 2000-2008, own calculations
Figure 1.
Development of HHI during 2000 - 2008
Let us see the problem from another point of view. The figure 1 presents the graph of HHI for assets, deposits and credits compare to optimal value of HHI during 2000 – 2008. As we see, we conclude the trend of HHI for assets and deposits is the same, while the trend of HHI for credits is different from assets and deposits. The tendency of these indices is towards optimal concentration level
6(that means the competition market), though the latter one is still far from being achieved. Reduced banking system concentration level is attributed to reorganization of this sector.
Banks of G2 peer group are benefiting from loss of terrain of large banks of G3 peer group. The Albanian banking market comparing to the optimal value of HHI (as we see in figure 1, it is approximately straight line) is considered to be highly concentrated in terms of assets and deposits, and moderately concentrated, close to perfect competition, in terms of lending.
4.2.4 Market concentrations on Treasure bills
Because of missing data for T-bills in the same period of other components, we are going to make the comparative analysis of H-index just for three years from two terms of period. In Albania Tirana Stock exchange doesn’t exist and is still one of the main challenges of the financial system. The attempts to develop this market have been focused on the formulation of laws and constructions of institutions that will participate in it. The result is: there are no shares listed in the stock market and an official stock market doesn’t exit. The only securities that are trading are T-bills.
In absence of stock exchange T-bills are traded from Bank of Albania .Thus T-bills activity evaluates as indicator of competition. From the data according to the distri-
6 Market share of each bank is equal to others, equal to 1/n (n- number of banks). This reduces HHI=1/n because market share of each bank and the mean market share are equal. See subsection 4.1
0 0.1 0.2 0.3 0.4 0.5 0.6
2000 2001 2002 2003 2004 2005 2006 2007 2008
HHI for Assets HHI for Deposits HHI for Credits Optimal value of HHI
bution of T-bills portfolio, results that SB had dominant position. HHI-index was high continuously, the nearest 1, and it means that SB had monopole position in this market. Market structure of T-bills in Albanian banking sector was monopoly.
This dominant position at 2007 belongs to 5 banks. Also treasury bills market is accompanied by very high concentrations ratios, but the trend is incident. CR
3and CR
5values are respectively 90% and 96% in 2003, while in 2007; CR
3and CR
5are 69% and 76%. Table 4 presents the empirical results.
Table 4.
Concentration ratios (%) for treasure bills
Year 2003 2005 2007
CR3 90 82 69
CR5 96 86 76
Note: Seri is smaller than the other components due to lack of data for treasure bills by BoA Source: Supervision Annual Report of Bank of Albania, 2003, 2005, 2007.
If we refer to table 5, the value of HHI is 0.86, the nearest 1, in 1999. High values of concentration indicators speak for the more concentrated of treasury bills market, this comes as a result of the inherent structure of the banking sector where the Sav- ings Bank (now Raiffeisen Bank) dominated the market of treasury bills (before its privatization). Recently noticed a diversification of treasury bills market between the banks of the sector, but still remains a market with high concentration. This situation demonstrates again the concentration in favor of G3 banks. HHI for treas- ure bills is decreasing significantly until 2007, but it notes a slight increasing at 2008 due to occurring of several mergers of foreign banks during 2007 and their impacts on concentration showed in 2008.
Table 5.
Value of HHI for treasure bills
Year 1999 2000 2007 2008 HHI 0.86 0.76 0.55 0.62 These calculations of HHI for T-Bills are calculating by dividing banks into peer group: G1, G2, G3 but the composition of banking sector has a different formatting for period 1999-2000 and 2007-2008. HHI is calculated to consider each group and then apply Kwoka version (1985). Source: BoA.
4.3 Concentration and ownership in Albanian banking sector
Despite the pre-transition historical differences, during the past decade the banking
systems in SEE-6 have been transformed by three major trends - privatization, con-
solidation and the entry of foreign banks on a large scale (Turner, 2006). The role
of foreign-owned banks has become dominant in Central and Eastern Europe, in-
cluding in the SEE-6 countries. Foreign banks penetrated these markets either di- rectly by establishing Greenfield operations or by participating in privatization of domestic state owned banks. During this period, Albanian banking sector is charac- terized by domination of foreign capital. In recent years it has emerged a new trend of ownership changes or control to banks’ shareholders through stocks’ transac- tions.
During 2008, the banking system’s capital incurred important structural changes, which brought about the increase of foreign capital domination in the system. With regard to Credins Bank, the sale of common shares, owned by a private Albanian shareholder, to two foreign investors raised the share of foreign capital in this bank to 33.34 percent, as compared to 5 percent in 2007. Regarding ProCredit Bank, two of its shareholders, FEFAD (domestic capital) and IFC (capital from the USA) sold all their shares, 25 percent and 11.25 percent respectively, to Procredit Holding, thus turning this bank into a bank entirely owned by foreign capital originating from the European Union. At Union Bank, during 2008 the European Bank for Re- construction and Development purchased 12.5 percent of the shareholders’ capital.
This development marks the entry of foreign capital to the last bank of the system that was entirely owned by domestic capital, thus decreasing the share of domestic capital in our banking system.
At end-December 2008
7, foreign capital in the system was ALL 50.3 billion, or 91.8 percent (versus 88.8 percent in 2007), while domestic capital was ALL 4.5 billion, or 8.2 percent of the total capital. Domestic state-owned capital represents 40 percent of shares owned by the Albanian Government in the United Bank of Al- bania (see figure 11). Based on a peer-group analysis, the large banks of G3 group continue to be supported by permanent foreign resources. The capital structure of G2 medium-sized banks and G1 small-sized banks includes both foreign and Alba- nian capital, where foreign capital has the highest share-88 percent and 76 percent of total capital, respectively.
7 Source: Annual Supervision Report, 2008.
Figure 2.
Paid-in Capital of the System by country of origin in 2008
Domination of foreign capital and its increasing tendency is also characteristic of other banking systems in the region. Comparing and contrasting our banking sys- tem with those of the region (table 6 ), we notice that foreign capital in our banking system has a higher share to total capital, than in any other country of the region, except for Croatia.
Table 6.
Share of foreign capital in some regional countries
No. of banks Foreign capital share (in %)
Country 2005 2006 2007 2005 2006 2007
Albania 16 17 17 86.3 85.7 88.8
Bosnia-Herzegovina 24 23 22 70.2 75.5 74.2
Bulgaria 34 32 29 74.9 72.8 72.8
Croatia 38 38 38 81.7 86.6 90.8
Slovenia 25 25 27 34.9 37.7 37.7
Serbia 40 37 35 53.8 73.1 77.2
Moldova 16 15 16 50.6 62.7 71.9
Romania 40 39 42 68.9 78.8 79.4
Source: BSCEE REVIEW 2007
5 Conclusions
After 1997 crisis, the macroeconomic environment led to important changes in Al-
banian banking sector which was involved in liquidation, restructuring, privatiza-
tion and acquisition activities of some banks. The estimation results provide consis-
tent evidence that as concentration in banking increases, the bank lending channel
weakens, causing monetary policy to be less effective. Transmission mechanism of monetary policy demonstrates low efficiency. The monetary policy outcomes fade in the lights of two factors such as:
SB monopoly in Leks deposits market Limited activity of interbank market .
The dominant position of Saving Bank, with over 60% of the total of deposits and the total of assets brought up distortion of banking market. The dominance of the Saving Bank in banking market resulted as the highest interest rates in the credits market too. In compliance with credits market, SB was impeded to extend credits till its privatisation and so had no influence in credits market, while loans from G2 and G3 represented only 6.1 % of total of assets of banking system. So loans repre- sented minimal figure, hence banks had chosen easy ways to make profits while minimizing risk. This situation brought up high interest rates. These highest costs of loans meant the highest costs of good and services, which were becoming one of the most important barriers to the competitiveness of Albanian goods. After the privatisation of Saving Bank, the credits market will be developed faster. Decreas- ing trend of concentration in banking sector is attributed to reorganization of the sector. Banks of G2 group are benefiting from losing ground to major banks of G3 group. The market concentrations have linked to banks consolidation. The paper finds a strong evidence of change to the market structure in Albanian banking sec- tor. Albanian banking sector has been recently characterized by important structural developments. The most important of them are:
• The enlarged number of banks
• Restructuring and privatization of state-owned banks
• Establishment of domestic capital banks
• Entrance of powerful foreign banks through acquisitions of the existing ones which have changed the Albanian banking sector into a dynamic environment.
There are more and more efforts made by banks to be better positioned in the mar-
ket.
6 Literature
Al-Karasneh, I., Cadle, P. and J. Ford (1997), Market Structure, Concentration and Performance: Jordanian Banking System, 1980-1993, Department of Eco- nomics Discussion Paper 97-12, University of Birmingham.
Angelini, P. and Cetorelli, N. (2000), Bank competition and regulatory reform: The case of the Italian banking industry, Federal Reserve Bank of Chicago, Working Paper Series, Research Development, WP. 99-32.
Balcerowicz, E. (1997), Privatization and Restructuring of State-owned Banks in Poland, Paper presented at the Conference on “The restructuring and pri- vatisation of banks, bad loans portfolios, and their impact on enterprise re- structuring in early transition” December, 1997, Tirana.
Baleta, Kallfa, File, Baholli, Bokshi, Abazi, (2000), The Domination of Banking System: Case of Albania, Discussion paper, Published by BoA.
Bank of Albania, Annual Report : 1998 – 2008.
Bank of Albania, Banking Supervision Annual Report : 1998 – 2008.
Beck, T., Demirgüç -Kunt, A., Levine, R. (2006a), Bank Concentration, Competi- tion, and Crises: First Results, Journal of Banking and Finance 30:5, 1581-1603.
Beck, T., Demirgüç-Kunt, A., and Levine, R. (2003), Bank Concentration and Cri- ses, NBER Working Paper (9921).
Berger, A. N., Demirgüç-Kunt, A., Levine, R. and Joseph G. Haubrich, (2004), Bank Concentration and Competition: An Evolution in the Making, Jour- nal of Money, Credit and Banking , Vol. 36, No. 3, pp. 434–450.
Bhattacharya, K. and Das, A. (2003), Dynamics of Market Structure and Competi- tiveness of the Banking Sector in India and its Impact on Output and Prices of Banking Services, Reserve Bank of India Occasional Papers, Vol. 24, No. 3, Winter 2003.
Bikker J. A. and Haaf, K. (2001a), Measures of Competition and Concentration: A Review of Literature. De Nederlandsche Bank, Amsterdam.
Bikker J. A. and Haaf, K. (2001b), Competition, Concentration and Their Relation-
ship: An Empirical Analysis of the Banking Industry, De Nederlandsche
Bank (DNB) Staff Reports, No. 68.
Bikker, J. A. and Groeneveld, J. M. (1998), Competition and concentration in the EU banking industry, De Nederlandsche Bank, Research Series Supervi- sion, No. 8, June.
Bikker, J. A. and Groeneveld, J. M. (2000), Competition and Concentration in the EU Banking Industry. Kredit und Kapital, Heft 1/2000, pp. 62-98.
Bikker, J. A., and Haaf, K. (2000), Measures of Competition and Concentration, a review of the literature, De Nederlandsche Bank, Directorate Supervision, research Series Supervision no. 30.
Bikker, J. A., Haaf, K. (2002), Competition, Concentration and Their Relationship:
An Empirical Analysis of the Banking Industry, Journal of Banking and Finance 26:11, 2191-2214.
Brumbulli, Tomini, Bokshi, (1997), Privatisation of State –owned Banks. The Case of NCB bank, Paper presented at the Conference on “The restructuring and privatisation of banks, bad loans portfolios, and their impact on enter- prise restructuring in early transition” December, 1997 , Tirana.
Carletti, E., and Hartmann, P. (2002), Competition and Stability: What's Special about Banking. European Central Bank (Working Paper No. 146).
Casu, B., and Girardone, C. (2006), Bank competition, concentration and efficiency in the single european market, Manchester School 74 (4):441.
Claessens, S., and Laeven, L. (2004), What Drives Bank Competition? Some Inter- national Evidence. Journal of Money Credit and Banking 36 (3 (2)):563- 583.
Cetorelli, N. (2004), Bank Concentration and Competition in Europe, Journal of Money, Credit, and Banking .
Cetorelli, N., Hirtle, B., Morgan, D., Peristiani, S., Santos, J. (2007), Trends in Fi- nancial Market Concentration and Their Implications for Market Stability.
Federal Reserve Bank of New York Policy Review, 33-51.
Davis, K. (2007), Banking Concentration, Financial Stability and Public Policy, prepared for Reserve Bank of Australia Conference, August, 2007.
De Bandt, O. and Davis, E. P. (1999), A Cross-Country Comparison of Market
Structures in European Banking, Working Paper No. 7, European Central
Bank.
Duka, R., Hashorva, A. (1997), Bad Loans and Non Performing Loans: case of the banking system in Albania; Paper presented at the Conference on “The re- structuring and privatisation of banks, bad loans portfolios, and their im- pact on enterprise restructuring in early transition” December, 1997, Ti- rana.
EBRD, Transition Report: 2005 – 2009.
Gruda, S., Hashorva, A. (2002), Privatization of Albanian Saving Bank and Com- petition Policies, published in “Economy and Business” No. 1(9) 2002.
Hashorva, A., Tushaj, A., Borici, A. (2009), The Effect of Market Inherited Struc- ture on Competition between Banks. The Case of Albanian Banking Sys- tem, AESCU Conference, May, 2009.
Jansen, D. and DeHaan, J. (2003), Increasing concentration in European banking:
A macro-level analysis, De Nederlandsche Bank, Research Memorandum WO, No. 743, September.
Košak, M. , Čok, M. (2008), Ownership structure and profitability of the banking sector: The evidence from the SEE region, Zb. rad. Ekon. fak. Rij., 2008, vol. 26, sv. 1, 93-12293.
Lehner, M. & M. Schnitzer (2006), Entry of Foreign Banks and their Impact on Host Countries, University of Munich, Discussion paper 2006-29, Sep.
2006.
Levine, R. (2000), Bank concentration: Chile and International comparisons, Cen- tral Bank of Chile, Working Papers N° 62 , Enero 2000.
Mahmood-ul-Hasan Khan (2009), Concentration and Competition in Banking Sec- tor of Pakistan: Empirical Evidence SBP, Working Paper Series No.28, March, 2009.
Mishkin (1998), The Economics of Money, Banking and Financial Markets.
Molyneux, P. (1999), Increasing concentration and competition in European bank- ing: The end of anti-trust? EIB Papers , 4(1).
Northcott, C. A. (2004), Competition in Banking: A Review of the Literature, Bank of Canada Working Paper (2004-24).
Note, S. (2006), Competition in the Albanian banking system, Bank of Albania, January 2006.
Rhoades, S. (1977), Structure-performance studies in banking: A summary and
evaluation, US Federal Reserve Board, Staff Economic Papers, 92.
1 Mikko Puhakka and Jennifer P. Wissink, Multiple Equilibria and Coordination Failure in Cournot Competition, December 1993
2 Matthias Wrede, Steuerhinterziehung und endogenes Wachstum, December 1993 3 Mikko Puhakka, Borrowing Constraints and the Limits of Fiscal Policies, May 1994 4 Gerhard Illing, Indexierung der Staatsschuld und die Glaubwürdigkeit der Zentralbank in
einer Währungsunion, June 1994
5 Bernd Hayo, Testing Wagner`s Law for Germany from 1960 to 1993, July 1994
6 Peter Meister and Heinz-Dieter Wenzel, Budgetfinanzierung in einem föderalen System, October 1994
7 Bernd Hayo and Matthias Wrede, Fiscal Policy in a Keynesian Model of a Closed Monetary Union, October 1994
8 Michael Betten, Heinz-Dieter Wenzel, and Matthias Wrede, Why Income Taxation Need Not Harm Growth, October 1994
9 Heinz-Dieter Wenzel (Editor), Problems and Perspectives of the Transformation Process in Eastern Europe, August 1995
10 Gerhard Illing, Arbeitslosigkeit aus Sicht der neuen Keynesianischen Makroökonomie, September 1995
11 Matthias Wrede, Vertical and horizontal tax competition: Will uncoordinated Leviathans end up on the wrong side of the Laffer curve? December 1995
12 Heinz-Dieter Wenzel and Bernd Hayo, Are the fiscal Flows of the European Union Budget explainable by Distributional Criteria? June 1996
13 Natascha Kuhn, Finanzausgleich in Estland: Analyse der bestehenden Struktur und Ü- berlegungen für eine Reform, June 1996
14 Heinz-Dieter Wenzel, Wirtschaftliche Entwicklungsperspektiven Turkmenistans, July 1996
15 Matthias Wrede, Öffentliche Verschuldung in einem föderalen Staat; Stabilität, vertikale Zuweisungen und Verschuldungsgrenzen, August 1996
16 Matthias Wrede, Shared Tax Sources and Public Expenditures, December 1996
18 Heinz-Dieter Wenzel, Turkmenistan: Die ökonomische Situation und Perspektiven wirt- schaftlicher Entwicklung, February 1997
19 Michael Nusser, Lohnstückkosten und internationale Wettbewerbsfähigkeit: Eine kriti- sche Würdigung, April 1997
20 Matthias Wrede, The Competition and Federalism - The Underprovision of Local Public Goods, September 1997
21 Matthias Wrede, Spillovers, Tax Competition, and Tax Earmarking, September 1997 22 Manfred Dauses, Arsène Verny, Jiri Zemánek, Allgemeine Methodik der Rechtsanglei-
chung an das EU-Recht am Beispiel der Tschechischen Republik, September 1997 23 Niklas Oldiges, Lohnt sich der Blick über den Atlantik? Neue Perspektiven für die aktu-
elle Reformdiskussion an deutschen Hochschulen, February 1998
24 Matthias Wrede, Global Environmental Problems and Actions Taken by Coalitions, May 1998
25 Alfred Maußner, Außengeld in berechenbaren Konjunkturmodellen – Modellstrukturen und numerische Eigenschaften, June 1998
26 Michael Nusser, The Implications of Innovations and Wage Structure Rigidity on Eco- nomic Growth and Unemployment: A Schumpetrian Approach to Endogenous Growth Theory, October 1998
27 Matthias Wrede, Pareto Efficiency of the Pay-as-you-go Pension System in a Three- Period-OLG Modell, December 1998
28 Michael Nusser, The Implications of Wage Structure Rigidity on Human Capital Accu- mulation, Economic Growth and Unemployment: A Schumpeterian Approach to En- dogenous Growth Theory, March 1999
29 Volker Treier, Unemployment in Reforming Countries: Causes, Fiscal Impacts and the Success of Transformation, July 1999
30 Matthias Wrede, A Note on Reliefs for Traveling Expenses to Work, July 1999
31 Andreas Billmeier, The Early Years of Inflation Targeting – Review and Outlook –, Au- gust 1999
32 Jana Kremer, Arbeitslosigkeit und Steuerpolitik, August 1999
34 Heinz-Dieter Wenzel (Herausgeber), Aktuelle Fragen der Finanzwissenschaft, February 2000
35 Michael Betten, Household Size and Household Utility in Intertemporal Choice, April 2000
36 Volker Treier, Steuerwettbewerb in Mittel- und Osteuropa: Eine Einschätzung anhand der Messung effektiver Grenzsteuersätze, April 2001
37 Jörg Lackenbauer und Heinz-Dieter Wenzel, Zum Stand von Transformations- und EU- Beitrittsprozess in Mittel- und Osteuropa – eine komparative Analyse, May 2001
38 Bernd Hayo und Matthias Wrede, Fiscal Equalisation: Principles and an Application to the European Union, December 2001
39 Irena Dh. Bogdani, Public Expenditure Planning in Albania, August 2002
40 Tineke Haensgen, Das Kyoto Protokoll: Eine ökonomische Analyse unter besonderer Berücksichtigung der flexiblen Mechanismen, August 2002
41 Arben Malaj and Fatmir Mema, Strategic Privatisation, its Achievements and Chal- lenges, Januar 2003
42 Borbála Szüle 2003, Inside financial conglomerates, Effects in the Hungarian pension fund market, January 2003
43 Heinz-Dieter Wenzel und Stefan Hopp (Herausgeber), Seminar Volume of the Second European Doctoral Seminar (EDS), February 2003
44 Nicolas Henrik Schwarze, Ein Modell für Finanzkrisen bei Moral Hazard und Überin- vestition, April 2003
45 Holger Kächelein, Fiscal Competition on the Local Level – May commuting be a source of fiscal crises?, April 2003
46 Sibylle Wagener, Fiskalischer Föderalismus – Theoretische Grundlagen und Studie Un- garns, August 2003
47 Stefan Hopp, J.-B. Say’s 1803 Treatise and the Coordination of Economic Activity, July 2004
48 Julia Bersch, AK-Modell mit Staatsverschuldung und fixer Defizitquote, July 2004 49 Elke Thiel, European Integration of Albania: Economic Aspects, November 2004
51 Holger Kächelein, Capital Tax Competition and Partial Cooperation: Welfare Enhancing or not? December 2004
52 Kurt A. Hafner, Agglomeration, Migration and Tax Competition, January 2005
53 Felix Stübben, Jörg Lackenbauer und Heinz-Dieter Wenzel, Eine Dekade wirtschaftli- cher Transformation in den Westbalkanstaaten: Ein Überblick, November 2005
54 Arben Malaj, Fatmir Mema and Sybi Hida, Albania, Financial Management in the Edu- cation System: Higher Education, December 2005
55 Osmat Azzam, Sotiraq Dhamo and Tonin Kola, Introducing National Health Accounts in Albania, December 2005
56 Michael Teig, Fiskalische Transparenz und ökonomische Entwicklung: Der Fall Bos- nien-Hercegovina, März 2006
57 Heinz-Dieter Wenzel (Herausgeber), Der Kaspische Raum: Ausgewählte Themen zu Politik und Wirtschaft, Juli 2007
58 Tonin Kola and Elida Liko, An Empirical Assessment of Alternative Exchange Rate Regimes in Medium Term in Albania, Januar 2008
59 Felix Stübben, Europäische Energieversorgung: Status quo und Perspektiven, Juni 2008 60 Holger Kächelein, Drini Imami and Endrit Lami, A new view into Political Business
Cycles: Household Expenditures in Albania, July 2008
61 Frank Westerhoff, A simple agent-based financial market model: direct interactions and comparisons of trading profits, January 2009
62 Roberto Dieci and Frank Westerhoff, A simple model of a speculative housing market, February 2009
63 Carsten Eckel, International Trade and Retailing, April 2009
64 Björn-Christopher Witte, Temporal information gaps and market efficiency: a dynamic behavioral analysis, April 2009
65 Patrícia Miklós-Somogyi and László Balogh, The relationship between public balance and inflation in Europe (1999-2007), June 2009
2009
67 György Jenei, A Post-accession Crisis? Political Developments and Public Sector Mod- ernization in Hungary, December 2009
68 Marji Lines and Frank Westerhoff, Effects of inflation expectations on macroeconomic dynamics: extrapolative versus regressive expectations, December 2009
69 Stevan Gaber, Economic Implications from Deficit Finance, January 2010
70 Abdulmenaf Bexheti, Anti-Crisis Measures in the Republic of Macedonia and their Ef- fects – Are they Sufficient?, March 2010
71 Holger Kächelein, Endrit Lami and Drini Imami, Elections Related Cycles in Publicly Supplied Goods in Albania, April 2010
72 Annamaria Pfeffer, Staatliche Zinssubvention und Auslandsverschuldung: Eine Mittel- wert-Varianz-Analyse am Beispiel Ungarn, April 2010
73 Arjan Tushaj, Market concentration in the banking sector: Evidence from Albania, April 2010