AUS DEM LEHRSTUHL FÜR HUMANGENETIK
PROF. DR. RER.NAT. BERNHARD WEBER DER FAKULTÄT FÜR MEDIZIN DER UNIVERSITÄT REGENSBURG
FUNCTIONAL ANALYSIS OF SELECTED ABCA4 AND CNGB3 VARIANTS IDENTIFIED IN RETINAL DEGENERATION PATIENTS
Inaugural – Dissertation zur Erlangung des Doktorgrades
DER MEDIZIN
der
Fakultät für Medizin der Universität Regensburg
vorgelegt von
JENNIFER LOEWEN-HORSCH
2019
AUS DEM INSTITUT FÜR HUMANGENETIK
PROF. DR. RER.NAT. BERNHARD WEBER DER FAKULTÄT FÜR MEDIZIN DER UNIVERSITÄT REGENSBURG
FUNCTIONAL ANALYSIS OF SELECTED ABCA4 AND CNGB3 VARIANTS IDENTIFIED IN RETINAL DEGENERATION PATIENTS
Inaugural – Dissertation zur Erlangung des Doktorgrades
DER MEDIZIN
der
Fakultät für Medizin der Universität Regensburg
vorgelegt von
JENNIFER LOEWEN-HORSCH
2019
Dekan: Prof. Dr. Dr. Torsten E. Reichert
1. Berichterstatter: Prof. Dr. rer.nat. Bernhard Weber
2. Berichterstatter: Prof. Dr. Horst Helbig
Tag der mündlichen Prüfung: 02.Oktober 2019
3
T ABLE OF C ONTENTS
1 Introduction ... 6
1.1 Stargardt Disease (STGD) ... 6
1.2 Background ... 10
1.3 CNGB3 ... 11
1.4 Cone-Rod Dystrophy ... 11
1.5 Splicing Regulation and Disease ... 12
1.6 ABCA4 Variants and Effect on Splicing ... 16
1.7 In Silico Programmes to Predict Variant Effect on Splicing ... 17
1.8 Purpose of Study ... 18
2 Material ... 19
2.1 Analyzed variants, sources, and characteristics of construct ... 19
2.2 Patients... 20
2.3 Oligonucleotides/Primer ... 20
2.4 Organisms and Cell Types ... 21
2.5 Plasmids ... 21
2.6 Enzymes... 21
2.7 Kits... 21
2.8 Chemicals/Substances ... 22
2.9 Solutions/Buffers/Medium ... 23
2.10 Laboratory Material ... 24
2.11 Instruments and Appliances ... 24
2.12 Software ... 25
3 Methods ... 26
3.1 Polymerase Chain Reaction (PCR)... 26
3.2 Agarose gel electrophoresis and documentation ... 26
3.3 Gel purification ... 27
3.4 Spectrophotometry... 27
3.5 Cloning ... 27
Ligation ... 27
Transformation ... 28
4
Screening positive clones ... 28
3.6 Plasmid DNA purification ... 28
3.7 Sequencing... 29
Sequencing PCR products directly ... 30
3.8 Exon Trapping ... 30
Preparation of pSPL3b vector ... 32
Digestion of Plasmid DNA ... 32
Ligating into pSPSL3b ... 33
3.9 Transfection of HEK 293 EBNA Cells ... 33
Splitting and sowing HEK 293 EBNA cells ... 34
Transfection reaction ... 34
Harvesting of HEK 293 EBNA cells... 35
3.10 RNA Isolation ... 35
3.11 cDNA Synthesis via Reverse Transcriptase PCR ... 36
3.12 cDNA PCR ... 36
4 Results ... 38
4.1 Results of bioinformatic predictions of variants’ effect on splicing ... 38
4.2 Canonical site variants ... 40
In vitro splicing effect of the ABCA4 c.5312+1G>A variant ... 40
In vitro splicing effect of the ABCA4 c.5018+2T>C variant ... 41
In vitro splicing effect of the ABCA4 c.1239+1G>C variant ... 43
4.3 Intronic variants ... 45
In vitro splicing effect of the ABCA4 c.4773+3A>G variant ... 45
In vitro splicing effect of the CNBG3 variant c.991-3T>G ... 47
4.4 Exonic variants ... 48
In vitro splicing effect of the ABCA4 variant c.4919G>A ... 48
In vitro splicing effect of the ABCA4 variant c.4354G>T ... 51
In vitro splicing effect of the ABCA4 variant c.4457C>T ... 53
In vitro splicing effect of the ABCA4 variant c.6732G>A ... 55
4.5 Summary of Results... 56
5
5 Discussion ... 58
5.1 In silico - in vitro analyses ... 59
5.2 ABCA4 topology and domains affected by aberrant splicing ... 60
5.3 Considerations for splicing and disease ... 62
5.4 Current efforts focusing on ABCA4 variants and spliceogenic effects ... 63
6 Summary ... 66
7 Figure Index ... 67
8 Table Index ... 70
9 Appendix ... 72
10 References ... 88
11 Other References ... 96
6
1 I NTRODUCTION
Retinal dystrophies comprise a class of eye diseases displaying broad clinical and genetic heterogeneity. Common to all is the degeneration of photoreceptors and/or retinal pigment epithelium in the posterior pole of the eye, eventually resulting in significant loss of vision and in some patients even blindness.
1Retinal degenerative diseases range in severity, with a subform of retinitis pigmentosa (Leber’s congenital amaurosis) being the most severe, and the juvenile form of hereditary macular dystrophy (Stargardt disease) on the milder side of the spectrum.
2Due to technological advances in therapeutic options, the diagnostic importance and clinical implications brought about by genetic testing for retinal degenerative diseases have become increasingly significant. As a result, at least five retinal dystrophy phenotypes have been linked to mutations in the ABCA4 gene: Stargardt disease (STGD), fundus flavimaculatus (FF), cone-rod dystrophy (CRD), retinitis pigmentosa (RP), and age-related macular dystrophy (AMD).
31.1 S
TARGARDTD
ISEASE(STGD)
This dissertation was part of a larger study focused on Stargardt patients with variants in the ABCA4 and CNGB3 genes. Stargardt disease was first characterized by German ophthalmologist Karl B. Stargardt in 1909 and is one of the most common forms of autosomal recessive macular dystrophy, with a prevalence of 1: 10,000 to 1:15.000.
9In addition to an early onset typically in the first two decades, further hallmarks include progressive loss of central vision, bilateral atrophy of the foveal retinal pigment epithelium and neuroepithelium, delayed dark adaptation, as well as the appearance of yellowish flecks surrounding the macula and retinal periphery (Stargardt, 1909 in Lewis et al.
11). Additional clinical symptoms observed are the presence of a dark or silent choroid, as well as a hypofluoresent peripapillary ring.
3To date, three molecular distinct origins have been described for Stargardt disease. Autosomal recessive STGD1 is caused by homozygous or compound heterozygous mutations in ABCA4, located on chromosome 1p22;
4autosomal dominant STGD3 is linked to a mutation in the ELOVL4 gene (chr. 6q14),
5whereas autosomal dominant STGD4 has been linked to mutations in the PROM1 gene (chr. 4p15.32).
6The ABCA4 gene, first identified in 1997, is located on human chromosome 1p22 and
contains 50 exons.
10The protein product of ABCA4 belongs to a class of ATP-binding cassette
(ABC) transporters, which are ubiquitously expressed integral membrane proteins and
constitute the largest family of eukaryotic transmembrane proteins.
12The ABC transporters
7 employ energy generated from ATP hydrolysis in order to transport various substrates such as metabolic products, lipids and sterols, as well as drugs, unidirectionally across cellular membranes.
13, 14Seven subfamilies of mammalian ABC transporters are currently known, with ABCA4 constituting member 4 of the ABCA subfamily.
12ABCA4 is a single-chain protein consisting of 2,273 residues organized in two tandem halves (Fig. 1).
19Each half includes an exocytoplasmic domain, a six helical transmembrane domain, and a cytoplasmic domain upon which the nucleotide binding site resides.
19The exocytoplasmic domains are joined by a disulfide bridge, display multiple glycosylation sites, and the cytoplasmic domain is phosphorylated.
19,20Figure 1: ABCA4 structure
Two tandem halves each with an exocytoplasmic domain (ECD1; ECD2), a cytoplasmic domain (CD1; CD2), and a nucleotide binding domain (NBD1; NBD2); Stars: glycosylation sites; Spheres: phosphorylation sites
Figure borrowed from Tsybovsky et al., 2013 (Fig.2a) 19
ABCA4 is expressed exclusively in the retina photoreceptors,
15primarily on the rims
and incisures of rod outer segments discs,
16but has also been found in foveal and peripheral
cone cells.
17The discovery of the ABCA4 gene, and with it the growing understanding of the
role of the ABCA4 protein in the visual cycle, served to shift the understanding of Stargardt
disease from being a disease of the retinal pigment epithelium (RPE) to one of rod
photoreceptors.
18Biochemical experiments, phenotype analysis of mice deficient for ABCA4
(Abca4
-/-), as well as clinical studies of macular degeneration patients, have aided in
conceptualizing the role ABCA4 plays in the visual cycle.
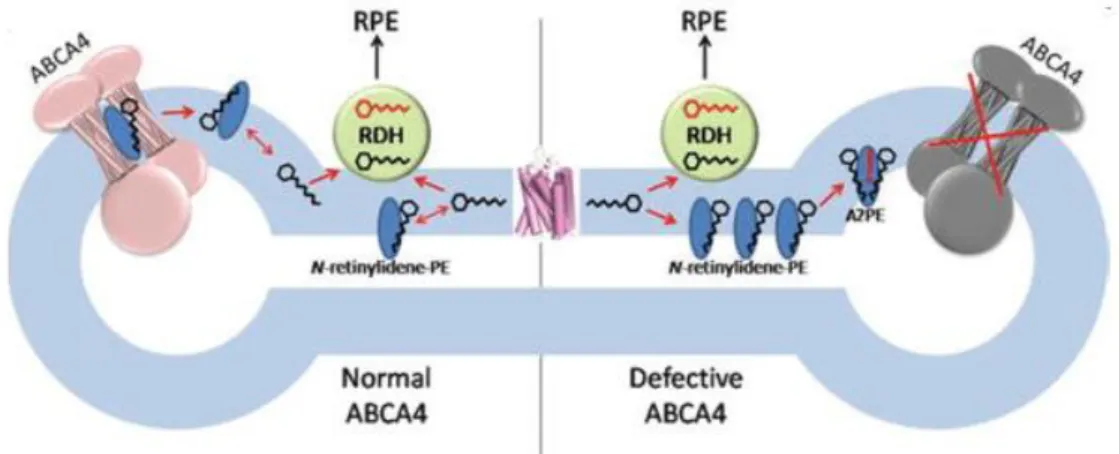
22Quasi and Molday were able to
show that ABCA4 transports N-retinylidene-phosphatidylethanolamine (NRPE) from the
exocytoplasmic to the cytoplasmic side (Fig. 2), and it is the only mammalian ABC transporter
known to be an importer.
238 Faulty transporting due to a mutated protein, as appears to be the case in Stargardt disease, results in the accumulation of N-retinylidene-phosphatidylethanolamine and all-trans- retinal in the interdiscal space, increasing the likelihood of a second molecule of all-trans- retinal binding to NRPE and thereby forming A2E, an oxidative component of lipofuscin (Fig.
2).24
A build up of lipofuscin deposits, as is seen in retinal degenerative patients, is suspected to have toxic effects on the retinal pigment epithelium (RPE), including disrupting membrane permeability, lysosomal dysfunction, and apoptotic signaling leading to photoreceptor death.
3Figure 2: Proposed biological role of ABCA4
Left: rod outer segment disc with a functional ABCA4; Right: inactive ABCA4; Circles with carbon backbone: all- trans-retinal (black) and all-trans-retinol (red); RDH: all-trans-retinol dehydrogenase 8. RPE: retinal pigment epithelium.
Figure borrowed from Tsybovsky et al., 2010 (Fig.7)22
ABC transporter genes typically encode structural proteins and genetic mutations may
lead to a significant reduction or even complete loss of protein function. The resulting disorders
are inherited in an autosomal recessive or X-linked recessive fashion.
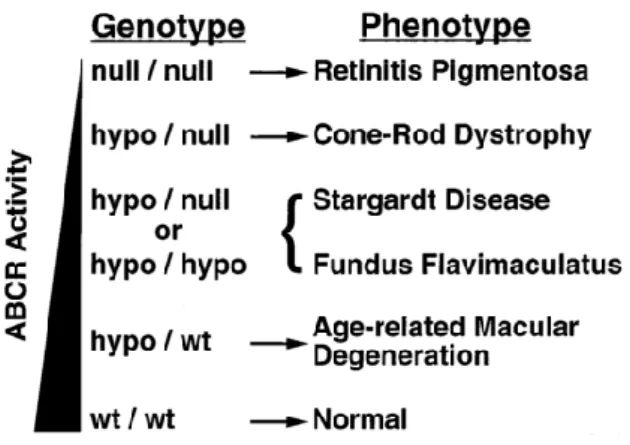
14Experimental data have
shown that disease severity is often inversely proportionate to the activity level of the ABCA4
protein (Fig. 3).
25In other words, depending on whether an ABCA4 allele produces a normally
functioning protein, a damaged protein, or complete lack of protein, the resulting phenotype
can remain unaffected, or vary from mild to severe. On the severe end, mutations causing
misfolded or truncated proteins are characterized by an early disease onset, primary
photoreceptor loss, and secondary RPE damage.
25In contrast, milder mutations may initially
leave photoreceptors intact, yet the diminished ABCA4 functioning results in gradual
accumulation of toxic by-products in the RPE consequently leading to photoreceptor death.
259
Figure 3: Progressive phenotypes resulting from ABCA4 mutations
Left: triangle representing ABCA4 activity; Genotype: (both alleles): null: no functional protein, hypo: reduced functioning alleles, WT: wild-type/normal alleles; Arrows: association between phenotypes and genotypes;
Brackets: both STGD and FF can be caused by either genotype.
Figure borrowed from Shroyer et al., 1999 (Fig.3)25
The residual ABCA4 function model, as described above (Fig. 3), has been criticized in for being “oversimplified”.
22Studies in tadpoles, for instance, have shown that protein mislocalization may be a contributing factor in disease severity.
26Moreover, Cideciyan et al.
were able to demonstrate that several patients with missense and splicing mutations showed
greater phenotype severity than those with truncating mutations, and thus proposed a two-
pathway model of understanding ABCA4 disease pathogenesis.
1Initially, conventional loss-of-
function occurs. As a result, stress is placed on the cellular degradation system, subsequently
inducing a toxic gain-of-function response, and eventually apoptotic signaling.
1As further
evidence of the complexity surrounding the genotype-phenotype correlation, other groups have
shown that non-ABCA4 modifying factors are also instrumental in determining the level of
visual functioning in patients with confirmed ABCA4 eye disease.
2710
1.2 B
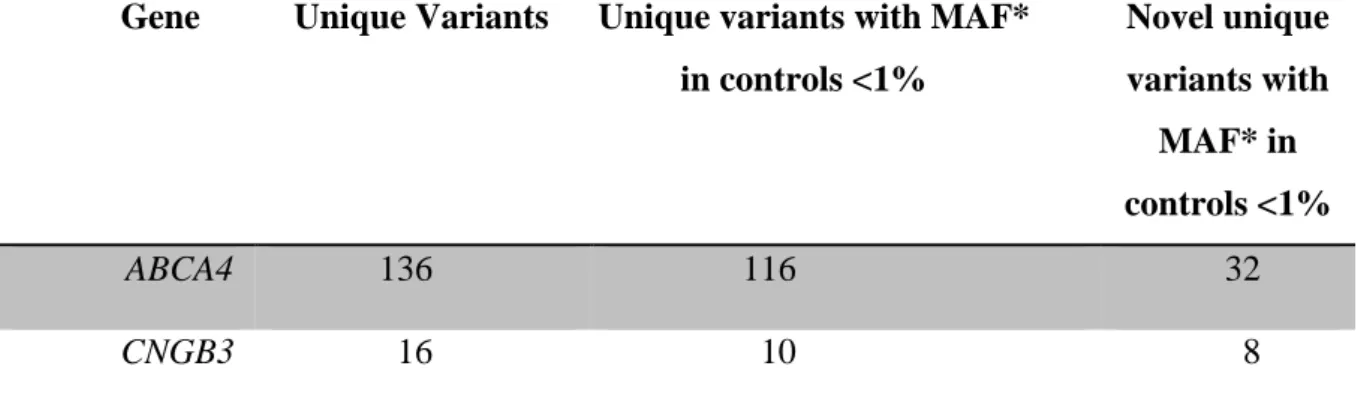
ACKGROUNDAs outlined below (Table 1), the variants (N=21) for this study were selected from a pool of possibly pathogenic variants found in a cohort of 335 patients clinically diagnosed with Stargardt disease who had undergone diagnostic testing at the Institute of Human Genetics, University of Regensburg between 2008 and 2015. The sequencing analysis included the coding regions and canonical site junctions of ABCA4 and CNGB3. Although the majority of variants stemmed from Stargardt patients, three additional variants identified in cone-rod dystrophy patients were also included.
Table 1: Sequence variants identified in 197 Stargardt disease patients tested between the years 2009 and 2012 at the Institute of Human Genetics, University of Regensburg (2009-2012) * minor allele frequency
The unique variants with a minor allele frequency (MAF) <1% in controls were further analyzed in silico to assess for possible spliceogenic effects. Based on positive predictive results from several bioinformatics tools, seventeen ABCA4 variants, one CNGB3, as well as the three ABCA4 variants found in cone-rod dystrophy patients (not included in the above table) were selected for subsequent in vitro functional investigations.
Gene Unique Variants Unique variants with MAF*
in controls <1%
Novel unique variants with
MAF* in controls <1%
ABCA4 136 116 32
CNGB3 16 10 8
11
1.3 CNGB3
The CNGB3 gene is located at 8q21.3, contains 18 exons
31and encodes for a cyclic nucleotide-gated (CNG) cation channel.
28CNGs belong to the superfamily of Voltage-gated Ion Channels (VIC) and play a crucial role in visual and olfactory transduction.
28Specifically, they are responsible for the generation of light-evoked electrical responses in the red, green, and blue sensitive cones.
7In the absence of light, channels are held open by cGMP, maintaining an inward current; light causes cGMP to be hydrolyzed, upon which the CNG channels close, hyperpolarizing the cell and transduction commences.
29CNG channels found in the outer segments of cone cells in the human retina consist of two subunits: α (ion-conducting) and β (modulatory), and are encoded for by CNGA3 and CNGB3 respectively.
29, 30Even though its function is considered to be only modulatory and the mechanism is not yet fully understood, the β subunit appears to vital to cone functioning and survival.
29CNGB3 mutations are most commonly linked to achromatopsia and juvenile macular degeneration.
7, 8Some evidence exists that mutations in the β subunit may result in gain-of-function leading to Ca
2+overload, in turn causing cytotoxicity and increased susceptibility to cell death.
321.4 C
ONE-R
ODD
YSTROPHYCone-rod dystrophy (CRD) is a rare form of pigmentary retinopathy with a prevalence
of 1:40,000.
33It is characterized by pigment deposits in the macula, decreased visual acuity,
photophobia, dyschromatopsia, progressive loss of peripheral vision, and night blindness in
later disease stages.
33Cone-rod dystrophy can be differentiated from rod-cone dystrophy
(retinitis pigmentosa, RP) in that the latter typically presents in initial stages with night
blindness, whereas the clinical course of cone-rod dystrophy is more severe with an earlier
onset of blindness.
33Although a number of genes have been linked to cone-rod dystrophy,
including ABCA4, CNGB3, CRX, KCNV2, and RPGR, a recent study published that 65% of the
CRD patients in their sample were found to have ABCA4 mutations and suffered the fastest
progression to legal blindness.
3412
1.5 S
PLICINGR
EGULATION ANDD
ISEASEResearch in the previous two decades has demonstrated that correct splicing, a process by which the non-coding introns are removed and the exons joined together to form the mature mRNA (messenger RNA), relies on the correct recognition of exons.
35, 36, 37, 38Involved in this process are so-called “cis” elements including the highly conserved consensus sequences at the intron 5’ donor splice site (GU), the 3′ acceptor site (AG), the polypyrimidine tract, and the branch point sequence slightly upstream from the 3′ end.
92“Trans” elements refer to the spliceosome snRNP (small nuclear ribonucleoproteins) and the enhancer or silencer elements that either activate or repress splicing.
92The 5′ splice site (Fig. 4) beginning with GU is comprised of nine partially conserved nucleotides from nucleotide position -3 to +6 found at the exon-intron border (Fig. 4).
39Nucleotide changes in the highly-conserved, i.e. the canonical -1, +1, and +2 sites, are very likely to affect splicing,
40whereas less conserved sites, such as the -3, can tolerate more variance.
41Figure 4: Splice site consensus site motif* showing intron 3′ acceptor (AG) and 5′ donor (GU) sites, based on an updated collection of 201,541 human 5′ splice sites. The varying height of each nucleotide represents the degree of conservation at that position.
Figure borrowed from Roca et al., 2013 *modified (Fig. 1b) 39
The 3′ terminus
(Fig. 5)consists of an AG dinucleotide acceptor site, a 14-26 nucleotide polypyrimidine tract, and the branch point located 18-40 nucleotides upstream from the 3′
junction.
92, 94Figure 5: 3′ terminus with (AG) acceptor site, the CT (CU) rich polypyrimidine tract and branch point 92 Figure borrowed from Zhang et al. 2007 *modified (Fig. 1C) 93
3
′
5′
Branch point YNYURAC
Polypyrimidine tract 3
′
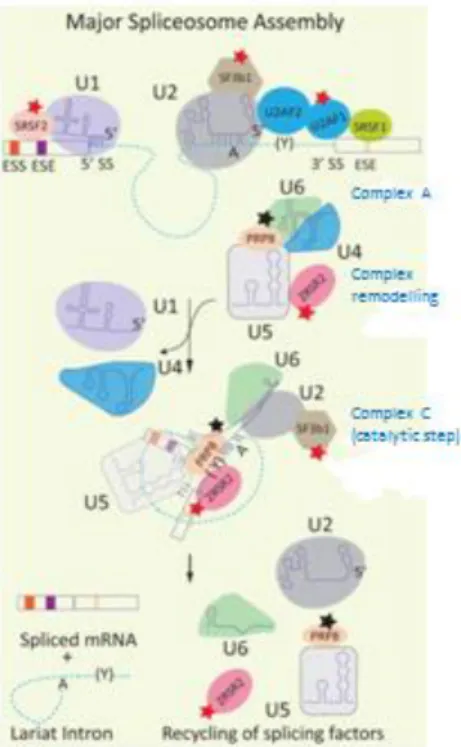
splice site13 The major human spliceosome is made up of five types of small nuclear ribonucleoproteins (snRNP) and numerous core proteins.
96Upon recognition, the spliceosome machinery hybridizes at the 5′ and 3′ splice sites and in a series of catalyzed steps, two transesterification reactions carry out intron excision and subsequent exon ligation (Fig. 6).
97Figure 6: Model for the major human spliceosome assembly and function
U1 and U2 snRNPs bind to the 5′ splice site and branch point respectively. The U2-auxiliary factor heterodimer interacts with the polypyrimidine tract (Y) and 3′ splice site to form complex A. The catalytic complex C is formed when the U4/U5 snRNPs bind, leading to a remodeling and removal of the U1 and U4 snRNPs. Two transesterification reactions ligate the exons and release an intron lariat, which is then degraded. The spliceosome is disassembled and recycled for use on another intron.
rectangles: exons; dashed line: intron; A: branch point; Y: polypyrimidine tract; ESE: exonic splicing enhancers;
ESS: exonic splicing silencers
red, black, & orange stars: show mutated component associated with neoplasias, retinitis pigmentosa and MOPD1 respectively (not relevant here)
Figure borrowed from Singh & Cooper, 2012 (Fig.1)44
Research has shown that exon recognition and splicing efficiency are equally dependent
on both the 5′ and 3′ splice sites, yet high 5′ splice site complementarity to the U1 complex and
a lengthy polypyrimidine tract seem to be especially important for spliceosome affinity.
95In
addition to the highly conserved consensus sequences at intron-exon borders, other splicing
14 regulatory elements found within exons and introns can act as either splicing enhancers or silencers.
42Correct gene expression requires extraordinary precise choreography among all splicing elements in order to facilitate correct exon recognition and intron removal, and variations in nucleotides may disrupt the splicing machinery. In general, the higher the degree of conservation at the site where the variant/mutation occurs, the more severe the consequence.
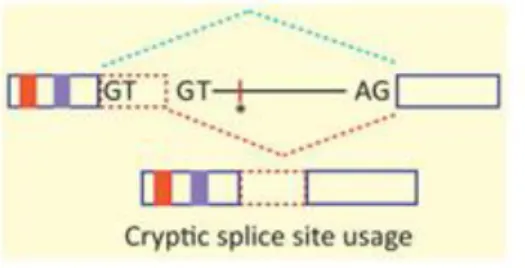
Hence, the nature of the outcome depends on the extent to which correct splicing can still occur, as well as on what molecular changes are brought forth by the change. Most frequently, exon skipping is seen (Fig. 7), but cryptic splice site activation is also very common (Fig. 8).
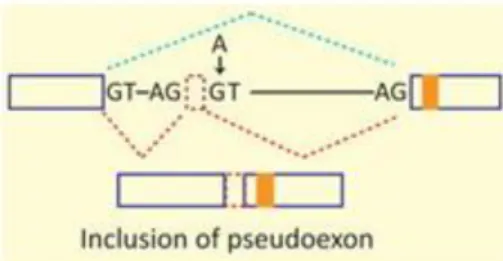
39Whereas total intron retention is rare, partial intron sequence may be included in the mRNA as a result of cryptic splice site activation or mutations within the intron, creating a pseudoexon and possibly leading to a frameshift (Fig. 8 & 9).
39, 44Figure 7: Mutations that reduce the strength of 5′ or 3′ splice sites decrease exon identification and are therefore likely to result in exon skipping. GT: 5′ splice site; AG: 3′ splice site; Y: polypyrimidine tract; A: branch point; ESE, ISE: exonic & intronic enhancers; ESS, ISS: exonic & intronic silencers (here not relevant)
Figure borrowed from Singh & Cooper, 2012 (Fig.2a) 44
Figure 8: Mutations that activate cryptic splice sites, i.e. sequence identical to the consensus site that is not used for splicing, but which increases in strength due to a mutation. This may result in the inclusion of extra sequence in the spliced mRNA, thus disrupting the reading frame (frameshift). GT: 5′ splice site; AG: 3′ splice site; asterisk: enhancer element; blue line: normal splicing pattern; red line: splicing pattern due to mutation; dashed red rectangle: inclusion of intronic sequence.
Figure borrowed from Singh & Cooper, 2012 (Fig.2c) 44
15
Figure 9: Mutations in intron (indicated by arrow) may also lead to inclusion of intronic sequence creating a pseudoexon. Extra sequence may result in a frame shift. GT: 5′ splice site; AG: 3′ splice site; blue line: normal splicing pattern; red line: splicing pattern due to mutation; dashed red rectangle: inclusion of intronic sequence;
Figure borrowed from Singh & Cooper, 2012 (Fig.2c) 44
Possible pathological consequences on the molecular level include premature stop
codons resulting in a truncated protein, as well as insertions or deletions of amino acids leading
to frame shifts.
45The outcome depends largely on which scenario is brought about by the
nucleotide change (Fig. 7-9). To date, most recorded data on splicing mutations remains at the
genomic sequence level,
91posing a problem for both researchers and clinicians in interpreting
and predicting the functional implication of the mutation. These challenges are particularly
multifaceted for the ABCA4 gene given its wide allelic diversity,
46which not only displays
variance in the resulting phenotype,
47but also in the pathogenic severity.
48ABCA4 disease
alleles are found at a frequency of approximately 1 in 50 in the general population,
47and many
sequence variants are intronic, making them difficult to interpret.
46The complexity is
compounded by tissue inaccessibility preventing direct RNA analysis of possible pathological
isoforms in the retina of living patients.
16
1.6 ABCA4 V
ARIANTS ANDE
FFECT ONS
PLICINGResearch from previous decades demonstrated that up to 15% of point mutations leading to human genetic disease are located within the highly conserved splice site regions,
49and current research supports these findings.
98A growing number of studies are expanding the scope to focus on how nucleotide changes both within the coding region, as well as those at splicing regulatory element sites, may affect splicing and what role they play in disease pathogenesis.
43,50,51In line with broader data available on splicing mutations, the Human Genome Mutation Database shows that ≈15% of first-report mutations in the ABCA4 gene are classified as splicing mutations (Table 2), yet descriptive data regarding the nature of spliceogenic variants remains scarce due to lack of in vitro analyses, as will be discussed further on.
Mutation Type Number of
Mutations
Missense/
nonsense
536
Splicing 117
Deletions 107
Insertions 23
Indels 7
Com. rear. 1
Total 791
Table 2: ABCA4 mutation types and number
http://www.hgmd.cf.ac.uk/ac/gene.php?gene=ABCA4; Public Version 13.01.2019
17
1.7 I
NS
ILICOP
ROGRAMMES TOP
REDICTV
ARIANTE
FFECT ONS
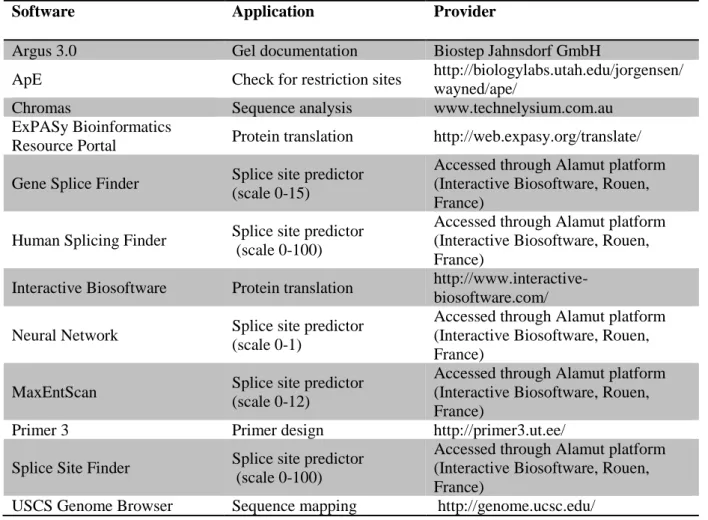
PLICINGNumerous web-based prediction tools are available for performing bioinformatic analyses of the potential effect a variant may have on splicing. This study incorporated five such programmes for the in silico variant analysis (Table 3).
Software Application Provider
Gene Splice Finder Splice site predictor (scale 0-15) Accessed through Alamut platform (Interactive Biosoftware, Rouen, France)
Human Splicing Finder Splice site predictor (scale 0-100) Accessed through Alamut platform (Interactive Biosoftware, Rouen, France)
Neural Network Splice site predictor (scale 0-1) Accessed through Alamut platform (Interactive Biosoftware, Rouen, France)
MaxEntScan Splice site predictor (scale 0-12) Accessed through Alamut platform (Interactive Biosoftware, Rouen, France)
Splice Site Finder Splice site predictor (scale 0-100) Accessed through Alamut platform (Interactive Biosoftware, Rouen, France)
Table 3: Software used for in silico predictions in this study
In silico analyses have demonstrated effectiveness in their ability to predict the disruption of canonical donor and acceptor sites due to single nucleotide changes, with some studies showing up to 100% specificity and sensitivity for certain programmes.
73However, not all studies have been able to obtain such high accuracy rates, and wide discrepancy has been reported in some cases.
52,54Moreover, interpreting the effect of nucleotide changes on the enhancement or de novo creation of cryptic splice sites has proven difficult. Deciphering how sequence variations in enhancer or silencer splicing regions may affect splicing poses an even greater challenge.
40Researchers caution against relying on a single in silico prediction programme,
54others stress in vitro analysis’ indispensability in characterizing the effect of variants deemed spliceogenic by such programmes,
40, 73yet both approaches present several challenges.
Interpreting the results of numerous programmes can be complex, as each tool relies on
different baseline algorithms and scoring systems and may vary in the amount of input sequence
required or analytical procedures utilized.
40Similarly, functional analyses, while providing an
in vivo picture of possible effects on splicing, can be time and resource consuming, particularly
when tissue is limited or inaccessible, as is the case with ABCA4. An effective means of
optimizing the process could be implementing in silico tools for initial selection and
18 prioritization of variants, which are subsequently analyzed in vitro in hopes of characterizing their potential putative in vivo effect.
52, 53, 541.8 P
URPOSE OFS
TUDYThis study carried out in vitro analyses of a selection of ABCA4 variants found in patients with retinal dystrophy (STGD and CRD) which had been predicted in silico to affect splicing.
Because ABCA4 and CNGB3 are transcribed exclusively in the retina, it is not feasible to
investigate splicing via direct RNA analysis from native tissue. To circumvent this problem, an
in vitro exon trapping method was employed based on work done by Cepko et al.
55This
approach capitalizes on the highly conserved sequences flanking splice sites and implements
transmissible expression vectors to generate and recover genomic inserts.
56, 57Following
replication and selection in E.coli, the pSPL3b vector containing the construct was transfected
in transient cells, the RNA isolated, reverse transcribed, and RT-PCR amplified. Visualizing
the products via gel electrophoresis allowed for initial comparison of splicing activity between
the normal allele and mutant variants.
19
2 M ATERIAL
2.1 A
NALYZED VARIANTS,
SOURCES,
AND CHARACTERISTICS OF CONSTRUCTPatient ID (Medistar
No.)
Working ID
Variant Geno- type
Exon Product size (bp)
Included 5′
intron seq. (bp)
Included 3′
intron seq. (bp)
Phenotype
18962 A c.67-1G>C Homo 2 263 103 54 STGD
16843 G c.67-2A>G Het 2 263 103 54 CRD
17412 U c.160+2T>C Het 2 263 103 54 STGD
21066 B c.4773+3A>G Het 33_34 506 138 50 (131
between)
STGD
15977 C c.4919G>A Het 35 404 141 81 STGD
17002 D c.5018+2T>C Het 35 404 141 81 STGD
17002 E c.6386+2C>G Het 46_47 475 100 93 (73
between)
STGD
15485 F* CNGB3
c.991-3T>G
Het 9 327 176 74 STGD
17716 H c.179C>T Het 3 358 67 149 STGD
15282 I c.1239+1G>C Het 9 431 112 180 STGD
20364 J c.1937+1G>A Het 13 411 85 149 STGD
21529 K c.1819G>A Het 13 411 85 149 STGD
15023 L c.2894A>G Het 19 415 54 186 STGD
16178 M c.3808G>T Het 25 478 151 121 STGD
15286 N c.4352+1G>A Het 29 407 192 116 STGD
14686 O c.4354G>T Het 30 424 96 141 STGD
16827 P c.4457C>T Het 30 424 96 141 STGD
16272 Q c.5196+1G>A Het 36 358 95 85 CRD
17575 R c.5189G>A Het 36 358 95 85 STGD
20882 S c.5312+1G>A Het 37 390 184 90 CRD
16518 T c.6732G>A Het 49 301 114 100 STGD
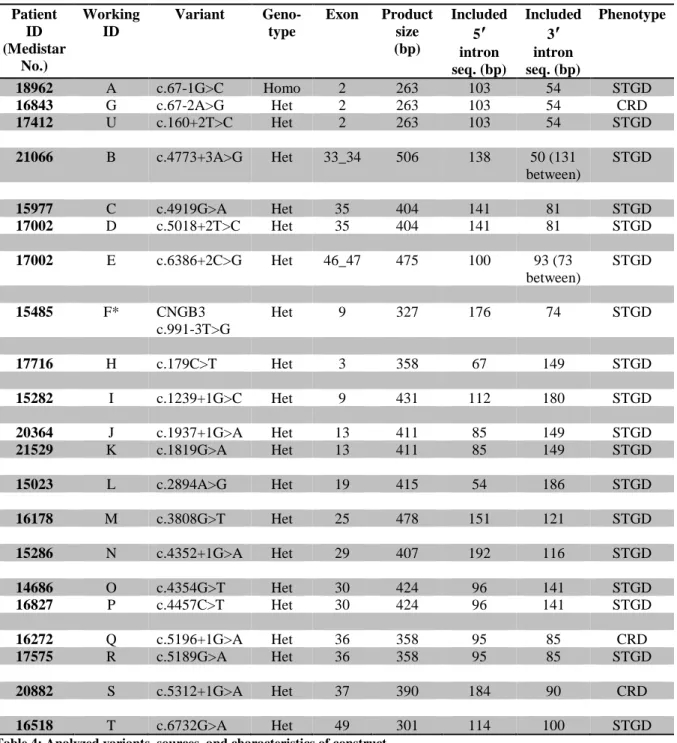
Table 4: Analyzed variants, sources, and characteristics of construct
* All variants in ABCA4: NM reference NM_000350.2, except *F: CNGB3 NM reference NM_019098.4 STGD = Stargardt disease; CRD = cone-rod dystrophy
20
2.2 P
ATIENTSBetween the years of 2008 and 2015, DNA samples of 335 Stargardt patients (191 female, 144 male) were analyzed for ABCA4 mutations in the 50 coding exons and adjacent intronic sequences as part of routine diagnostic screening at the Institute of Human Genetics, University of Regensburg. Informed written consent was obtained from each patient in accordance with established guidelines of the German Medical Association, the German Society of Human Genetics, and the German Genetic Diagnosis Act of 2010, agreeing to the use of their DNA for research purposes aimed at underlying genetic cause of their disease.
Genomic DNA was isolated from peripheral blood lymphocytes.
2.3 O
LIGONUCLEOTIDES/P
RIMERGene/Exon /Restriction Site Sequence
ABCA4-ex02-F-EcoRI gaattcACTGCACACATGGGATCTGA
ABCA4-ex02-R-BAMHI ggatccAGGCCCAGACCAAAGTCTCT
ABCA4-ex03-F-EcoRI gaattcTCCTAGGTCTGCATCCTGCT
ABCA4-ex03-R-BAMHI ggatccGGAAACCTGCTCTGCTCCTA
ABCA4-ex09-F-EcoRI gaattcAATCCTCCAGCATGGAGTTG
ABCA4-ex09-R-BAMHI ggatccCACTGAAGCAAAGCATTCCA
ABCA4-ex13-F-EcoRI gaattcTGAGTTCCGAGTCACCCTGT
ABCA4-ex13-R-BAMHI ggatccGTCAGAGCTCCATGCTCTCC
ABCA4-ex19-F-EcoRI gaattcGGGCCATGTAATTAGGCATT
ABCA4-ex19-R-BAMHI ggatccCCTCCCCATCAAGAGAATACA
ABCA4-ex25-F-EcoRI gaattcTGGAGCATCAGTCCTCTGAA
ABCA4-ex25-R-BAMHI ggatccCTATGCTTGGGTGGGGAAC
ABCA4-ex29-F-EcoRI gaattcGTGACATGCCATCAGACCAC
ABCA4-ex29-R-BAMHI ggatccAGTGACCAGCAGAGCAGGAT
ABCA4-ex30-F-EcoRI gaattcAGAGGAGGAGGAAAGGGTTG
ABCA4-ex30-R-BAMHI ggatccGGTGCAGGGAGTTTGGTTTA
ABCA4-ex33_34-F-EcoRI gaattcTTTGTAAAGTGGAGCCATGTTG ABCA4-ex33_34-R-BAMHI ggatccGGTAAATTTTTAGCTCCAGAGCAG
ABCA4-ex35-F-EcoRI gaattcATCCCTCCTCCTGCTGAAAT
ABCA4-ex35-R-BAMHI ggatccGGTGGTGAGAATCCTCTCAGG
ABCA4-ex36-F-EcoRI gaattcGTGTAAGGCCTTCCCAAAGC
ABCA4-ex36-R-BAMHI ggatccCCCTCTTGGTCTGGTCCTTC
ABCA4-ex37-F-EcoRI gaattcGGGTGGGGTAGGAGGACTA
ABCA4-ex37-R-BAMHI ggatccACAGCCCAGGTTTTCTGTCA
ABCA4-ex46_47-F-EcoRI gaattcCTGTCAGCTCATCCTCCACA ABCA4-ex46_47-R-BAMHI ggatccGAGCAGCAGGACTCTTCCAA
ABCA4-ex49-F-EcoRI gaattcTACCAGCAGGGCTGTATGTG
ABCA4-ex49-R-BAMHI ggatccGGCATATCTGAGCCTTGGAG
CNGB3-ex9-F-EcoRI gaattcCCATGCTATAAAATGTACTGTCCAGAGGA
CNGB3-ex9-R-BAMHI ggatccCCTGCCAAATTCCGTCTAAAATGTTGT
M13-F CGCCAGGGTTTTCCCAGTCACGAC
M13-R AGCGGATAACAATTTCACACAGGA
pSPL3bF GAGAAATATCAGCACTTGTG
pSPL3bR GTACACCGGCATGTGTGGCC
21
SD2 GTGAACTGCACTGTGACAAGC
SD6 TCTGAGTCACCTGGACAACC
SA2 ATCTCAGTGGTATTTGTGAGC
SA4 CACCTGAGGAGTGAATTGGTCG
Table 5: Primers*, including gene, exon, restriction site, and sequence
*cc 100 µM, dilution 1:10; company: Metabion. (see Appendix)
2.4 O
RGANISMS ANDC
ELLT
YPESStrain/Cell line Characteristics Source
E.coli strain DH5α nuclease deficient Inst. of Human Genetics UR HEK 293 EBNA human embryonic kidney cells Inst. of Human Genetics UR
Table 6: Bacteria strains and cell lines
2.5 P
LASMIDSPlasmid Size (kb) Resistance Application Source pGEM-T 3 Ampicillin WT/Mut selection Promega
pSPL3b 6 Ampicillin Transfection Inst. of Human Genetics UR
Table 7: Plasmids
2.6 E
NZYMESEnzyme Application Company
Go-Taq polymerase (5U/µl) PCR cDNA Promega
Pfu polymerase (Pyrococcus furiosus)
PCR Inst.Human Genetics UR Restriction enzymes (EcoRI, BamHI) Plasmid digestion BiolabsTaq polymerase (
Thermos aquaticus)
PCR Inst.Human Genetics URT4-DNA Ligase Ligation Promega
Trypsin (0,5%) EDTA (0,2%) 1 x in PBS Cell culture PAA
Table 8: Enzymes
2.7 K
ITSKit Application Company
BigDye Terminator v1.1, v3.1 Cycle Seq. Kit Sequencing Applied Biosystems RevertAid ™ H First Strand cDNA Synthesis
Kit
Reverse transcription Thermoscientific NucleoSpin® Gel and PCR Clean Up PCR purification Macherey-Nagel NucleoSpin® Plasmid Clean Up Plasmid DNA
purification
Macherey-Nagel
pGEM T- Vector System Cloning Promega
Rneasy Micro Kit RNA isolation Qiagen
TransIT®-LT1 Transfection reagents Transfection Mirus
Table 9: Kits
22
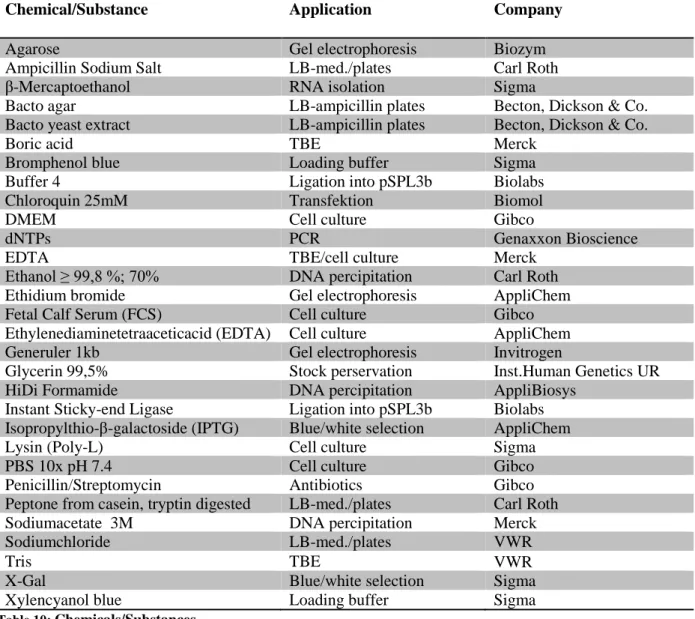
2.8 C
HEMICALS/S
UBSTANCESChemical/Substance Application Company
Agarose Gel electrophoresis Biozym
Ampicillin Sodium Salt LB-med./plates Carl Roth
β-Mercaptoethanol RNA isolation Sigma
Bacto agar LB-ampicillin plates Becton, Dickson & Co.
Bacto yeast extract LB-ampicillin plates Becton, Dickson & Co.
Boric acid TBE Merck
Bromphenol blue Loading buffer Sigma
Buffer 4 Ligation into pSPL3b Biolabs
Chloroquin 25mM Transfektion Biomol
DMEM Cell culture Gibco
dNTPs PCR Genaxxon Bioscience
EDTA TBE/cell culture Merck
Ethanol ≥ 99,8 %; 70% DNA percipitation Carl Roth
Ethidium bromide Gel electrophoresis AppliChem
Fetal Calf Serum (FCS) Cell culture Gibco
Ethylenediaminetetraaceticacid (EDTA) Cell culture AppliChem
Generuler 1kb Gel electrophoresis Invitrogen
Glycerin 99,5% Stock perservation Inst.Human Genetics UR
HiDi Formamide DNA percipitation AppliBiosys
Instant Sticky-end Ligase Ligation into pSPL3b Biolabs Isopropylthio-β-galactoside (IPTG) Blue/white selection AppliChem
Lysin (Poly-L) Cell culture Sigma
PBS 10x pH 7.4 Cell culture Gibco
Penicillin/Streptomycin Antibiotics Gibco
Peptone from casein, tryptin digested LB-med./plates Carl Roth
Sodiumacetate 3M DNA percipitation Merck
Sodiumchloride LB-med./plates VWR
Tris TBE VWR
X-Gal Blue/white selection Sigma
Xylencyanol blue Loading buffer Sigma
Table 10: Chemicals/Substances
23
2.9 S
OLUTIONS/B
UFFERS/M
EDIUMSolutions/Buffer Composition Amount Application
Agarose gel TBE 1x
Agarose 1-2% Gel electrophoresis
Buffer 4 pH 7.9 50 mM K-acetate 20 mM Tris-acetate 10 mM Mg-acetate 1mM DTT
Restriction digestion
dNTPs (cc 100 mM) dATP dTTP dGTP dCTP
12,5 µl in 950 µl dH₂O 12,5 µl in 950 µl dH₂O 12,5 µl in 950 µl dH₂O 12,5 µl in 950 µl dH₂O
PCR
Instant Sticky-end Ligase Gylcerol PEG-6000
Proprietary Information Tris-HCL
20%
13.6%
5%
1.5%
pSPL3 Ligation
Poly-L-Lysin Dil 1:50 with 1x PBS Cell culture
TBE 5x pH 8,0 Tris (0.44 M) Boric acid (0.44 M) EDTA (0.5 M) pH 8 dH₂O
216 g in 4 L 110 g in 4 L 80 ml in 4L 4 L
Gel electrophoresis
Xylencyanol blue Xylencyanol Glyerin dH₂O
0,05 g 20 ml Ad 50 ml
Loading buffer gel electrophoresis
Table 11: Solutions/Buffers
Medium Composition Amount Application
HEK 293 EBNA (DMEM+)
DMEM (glucose 4,5g/L) FCS
Pen/Strep
500 ml 10%
1%
Cell culture
LB Medium Pepton
Yeast extract NaCl
dH₂O
Ampicillin (cc 100 μg/ml)
10g 5g 10g 1L 1 ml
Bacteria growth and selection
LB Plates + Agar 15g Cloning
SOC Pepton (2%)
Yeast extract (o.5%) NaCl (10mM) KCl (2.5mM) dH₂O
pH 7.0 autoclave
20g 5g 0.5g 0.186g 1L
E. coli DH5α recovery
Table 12: Medium
24
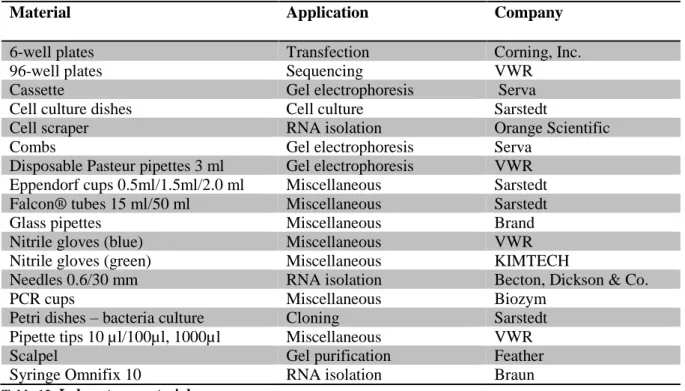
2.10 L
ABORATORYM
ATERIALMaterial Application Company
6-well plates Transfection Corning, Inc.
96-well plates Sequencing VWR
Cassette Gel electrophoresis Serva
Cell culture dishes Cell culture Sarstedt
Cell scraper RNA isolation Orange Scientific
Combs Gel electrophoresis Serva
Disposable Pasteur pipettes 3 ml Gel electrophoresis VWR Eppendorf cups 0.5ml/1.5ml/2.0 ml Miscellaneous Sarstedt Falcon® tubes 15 ml/50 ml Miscellaneous Sarstedt
Glass pipettes Miscellaneous Brand
Nitrile gloves (blue) Miscellaneous VWR
Nitrile gloves (green) Miscellaneous KIMTECH
Needles 0.6/30 mm RNA isolation Becton, Dickson & Co.
PCR cups Miscellaneous Biozym
Petri dishes – bacteria culture Cloning Sarstedt Pipette tips 10 µl/100µl, 1000µl Miscellaneous VWR
Scalpel Gel purification Feather
Syringe Omnifix 10 RNA isolation Braun
Table 13: Laboratory material
2.11 I
NSTRUMENTS ANDA
PPLIANCESInstrument/appliance Company
Autoclave V-150 Systec GmbH
Bacteria hood ThermoScientific
Cell culture hood BDK GmbH
Centrifuge (mikro) Qualitron
Centrifuge 5415R Eppendorf
Centrifuge Multifuge 3L ThermoScientific
Centrifuge Megafuge 1.0R ThermoScientific
Centrifuge 5810 eppendorf
Dark hood DH 30/32 Biostep
Gel electrophoresis voltage boxes Serva
Gel electrophoresis chambers Blue Marine 200 Serva Scepter®Hand-held automatic cell counter Millipore
Ice machine AF 100 Scotsman
Incubator 37°C Memmert
Incubator shaker Certomat® R B.Braun Biotech
Microwave Daewood
Millipak® Water System Millipore
Multichanel pipette Abimed
Multipipette® Plus eppendorf
ND1000 Spectrophotometer NanoDrop®
Pump - cell culture hood eppendorf
Pipettes10µl/100µl/1000µl Applied Biosystems
3130x1 Genetic Sequenzer Biometra
Thermocycler Biometra
Thermocycler T3 eppendorf
25
Thermomixer compact eppendorf
Vortex 2 Genie ScientificIndustries
Water bath Aqualine Lauda
Water distiller 2012 GFL
Table 14: Instruments and Appliances
2.12 S
OFTWARESoftware Application Provider
Argus 3.0 Gel documentation Biostep Jahnsdorf GmbH
ApE Check for restriction sites http://biologylabs.utah.edu/jorgensen/
wayned/ape/
Chromas Sequence analysis www.technelysium.com.au
ExPASy Bioinformatics
Resource Portal Protein translation http://web.expasy.org/translate/
Gene Splice Finder Splice site predictor (scale 0-15)
Accessed through Alamut platform (Interactive Biosoftware, Rouen, France)
Human Splicing Finder Splice site predictor (scale 0-100)
Accessed through Alamut platform (Interactive Biosoftware, Rouen, France)
Interactive Biosoftware Protein translation http://www.interactive- biosoftware.com/
Neural Network Splice site predictor (scale 0-1)
Accessed through Alamut platform (Interactive Biosoftware, Rouen, France)
MaxEntScan Splice site predictor (scale 0-12)
Accessed through Alamut platform (Interactive Biosoftware, Rouen, France)
Primer 3 Primer design http://primer3.ut.ee/
Splice Site Finder Splice site predictor (scale 0-100)
Accessed through Alamut platform (Interactive Biosoftware, Rouen, France)
USCS Genome Browser Sequence mapping http://genome.ucsc.edu/
Table 15: Software
26
3 M ETHODS
3.1 P
OLYMERASEC
HAINR
EACTION(PCR)
Patient DNA was extracted from peripheral blood and diluted to a concentration of 25 ng/μl and the regions of interest PCR amplified. Unless otherwise specified, the polymerase used was a 7:1 ratio of Taq:Pfu (Thermus aquaticus:Pyrococcus furiosus). The following tables show the protocol implemented for PCR reactions in this work.
Reagent Volume
H₂O
16.0 µlMgCl₂ (15 mM)
2.5 µldNTP
2.0 µlForward primer
1.0 µlReverse primer
1.0 µlTaq-Pfu
0.5 µlDNA template
2.0 µlTable 16: PCR Protocol
Step Temperature Time
Initial
denaturation
94 ° C 3 minDenaturation
94 ° C 30 s*Annealing
57 ° C 30 s*Elongation
72 ° C 2 min*Final elongation
72 C 5 minTable 17: PCR Thermocycler programme
*33 cycles
3.2 A
GAROSE GEL ELECTROPHORESIS AND DOCUMENTATIONThis method of separation relies on an electrical current to move negatively charged
DNA molecules towards the positively-charged anode. Smaller molecules can pass more
readily through the gel matrix than larger ones and enables separation according to molecular
size.
42The PCR amplified DNA was separated on a 1% agarose gel at 200 V, unless otherwise
stated. Agarose was dissolved in 1x TBE buffer by heating the mixture to near-boiling point in
a microwave. After cooling, 1-2 drops of ethidium bromide were added to enable fluorescence
of the DNA fragments under UV light. The mixture was poured into a cast fitted with individual
27 combs to form the wells. Once hardened, the gel cast was placed into an electrophoresis tank containing 1x TBE running buffer. 4
μl loading buffer and 10 μl PCR product were pipettedinto each well. A DNA ladder (GeneRuler) allowed for estimation of the molecular size (kb) of the DNA fragments. Once the fragments were separated adequately, they were visualized using UV light and documented with the Argus 3.0 software.
3.3 G
EL PURIFICATIONDNA extraction from the agarose gel was done using the NucleoSpin® Gel and PCR Clean Up kit, which also removed contaminants such as excess nucleotides, primers, enzymes, salts and dyes (Macherey-Nagel manual 2012). The following modifications were made to the protocol:
Step 4: centrifuge for 2 min leave open to dry for 3 min Step 5: eluted with 25μl Millipore water
3.4 S
PECTROPHOTOMETRYThe NanoDrop ND1000 Spectrophotometer measures nucleic acid samples (V=1 μl) on a spectrum of 220nm-750 nm up to concentrations of 3700 ng/μl (Nanodrop1000). The sample concentration given in ng/μl is based on an absorbance of 260 nm. Sample intensities along with blank intensities (deionized water) are used to calculate the sample absorbance.
3.5 C
LONINGLigation
The Taq polymerase creates an adenine overhang on the 3′ end of the amplified PCR
fragment, which can then be ligated into the linearized pGEM® T vector due to the
complementary thymidine overhang on both 3′ ends of the insertion site (Promega manual,
2010). The protocol used for ligation is shown in the table below:
28
Reagent Volume
pGEM®T Vector 0.5 µl
T4 DNA Ligase 1.0 µl
2X Rapid Ligation Buffer 5.0 µl
Insert 3.5 µl
Table 18: Ligation protocol (incubation at 4° C overnight)
Transformation
After approximately 18 h, the ligation product was transformed in competent E. coli DM5α cells. The bacteria (stored at – 80°C) were thawed slightly in an ice bath before adding 5 μl of the ligation preparation. A reaction time of 30 min on ice was followed by a heat shock phase of 40 s at 42°C and a 120s recovery time on ice. 900 μl of SOC medium was added and the cells were placed in the incubator shaker Certomat R for 3 h at 37°C and 165 rpm. Prior to plating out 200 μl of the transformed cell mixture, 50 μl X-gal (40 mg/ μl) and 10 μl 100 mM IPTG were added to the LB + ampicillin plates for the purpose of blue-white screening of positive clones. The pGEM® T vector contains promoters on either side of a multiple cloning region within the α-peptide coding region of the β-galactosidase. Proper insertion of the DNA fragment into the vector disrupts the reading of α-peptide, thus preventing functional β- galactosidase from being formed and resulting in white (+) colonies (Promega manual, 2010).
The plates were incubated for 18 h at 37° C.
Screening positive clones
Positive colonies were further screened for correct insertion and size via colony PCR.
Positive colonies were picked and incubated for 60 min at 37° C in 20 μl LB+ampicillin broth.
The colony PCR was performed using M-13 forward and reverse primers (Table 5). Gel electrophoresis on a 1% agarose gel and UV documentation were used to separate the DNA fragments and assess the size. From those colonies showing correct insertion and appropriate fragment size, four to six were selected for inoculation. 5
μl of the 20 μl inoculatedLB+ampicillin medium was added to 5 ml of LB+ampicillin broth and incubated in the Certomat R for 18 h at 37° C and 165 rpm.
3.6 P
LASMIDDNA
PURIFICATIONThe cultured medium was centrifuged at 4000 rpm for 5 min in order to pellet the
bacteria cells. Purification was performed using the NucleoSpin® Plasmid kit (Macherey-Nagel
manual, 2010). The cell pellet was re-suspended in a buffer before liberating the plasmid DNA
29 from the host cells via SDS/alkaline lysis. The lysate was then neutralized in order to allow it to bind to the silica membrane of the column. Unwanted debris can be pelleted via centrifugation before loading the supernatant onto the column. The Macherey-Nagel protocol for plasmid DNA preparation (2010) was adhered to, apart from the following modifications:
Step 1: centrifugation 5 min at 4000 rpm
Step 4: discard overflow and dry an additional 60 s at 11 000 g Step 5: omitted Buffer AW
Step 6: centrifuge 3 min, leave open to dry 3 min Step 7: elute with 30 μl purified water
The concentration of the plasmid DNA was measured using the NanoDrop ND1000 spectrophotometer.
3.7 S
EQUENCINGThe plasmid DNA was diluted to 25 ng/µl and 2 µl was used as a template for the sequencing reaction. For the PCR, the BigDye Terminator v1.1.v3.1 Cycle Sequencing Kit from Applied Biosystems was used, according to following protocol:
Reagent Volume
Big Dye Reaction mix 0.3 µl
5x Buffer 2.0 µl
Primer 1.0 µl
H₂O 4.7 µl
DNA 2.0 µl
Table 19: Sequencing protocol
Step Temperature
°C
Time Cycle Initial
denaturation
94 2 min
Denaturation
94 30s
Annealing
57 30s 30
Elongation
72 3 min
Final elongation
72 5 min
Table 20: Amplification conditions
30
Sequencing PCR products directlyWhen sequencing PCR product directly, an initial step to remove excess 5′ phosphates and dNTPs was carried out using Antarctic Alkaline Phosphatase and Exonuclease I respectively.
Reagent Volume
Exo 0.10 µl
AAP 0.25 µl
H₂O 3.65 µl
PCR Product 1.00 µl
Table 21: Exo/AAP digestion
After incubating for 15 min at 37°C and a further 15 min at 80°C, the following was added:
Reagent Volume
Big Dye Reaction mix
0.30 µl5x Buffer
1.85 µlPrimer
1.00 µlH₂O
1.85 µlTable 22: Sequencing protocol following Exo/AAP digestion Amplification conditions (Table 20).
The reaction products for sequencing were purified by adding 2 µl NaAc and 50 µl 100%
ethanol and vortexing briefly before centrifuging for 30 min at 4°C and 4000 rpm. The supernatant was immediately discarded and the pellet centrifuged again for 2 min at 800 rpm.
Next, 70 µl 70% ethanol was added and centrifuged for another 30 min at 4°C and 4000 rpm.
After discarding the supernatant and centrifuging for 2 min at 800 rpm, the pellet was dried at RT for 15 min, re-suspended in 15 µl HiDi Formamide and pipetted into the 96 well plate for sequencing (Abi3130x1 Genetic Analyzer). Sequences were analyzed with Chromas 2.
3.8 E
XONT
RAPPINGThis study utilized the pSPL3b expression vector to examine splicing behavior (Fig.
10). The vector consists of two exons flanking an intron containing a multiple cloning site, into
which the fragment of interest can be inserted. The vector was linealized with restriction
enzymes identical to those used to digest the construct. The SV40 promoter region, located
31 upsteam from the cloning sites, is used to drive transcription in eukaryotic cells, with the ori (replication origin) and amp (ampicillin resistance) sites being necessary for replication and selection in E. coli.
58As shown in Fig. 10, the specific vector primers SD6 and SA4 (Table 5) were used for sequencing. Each insert consisted of one, in some cases two, exons with flanking intronic sequence of varying size (Table 4).
Figure 10: pSPL3b vector
BamHI G/GATCC CCTAG/G EcoR1 G/AATTC CTTAA/G
Figure 11 Restriction enzymes BamH1 and Eco R1
SV40 origin and promoter SV40 polyadenylation site
amp ori
E E
BamHI EcoRI
SD6
AS 1st DS
SA4 2nd DS
ABCA4
32
Preparation of pSPL3b vectorReagent Amount
pSPL3b vector plasmid
DNA stock 2.0 µl
EcoR1 0.5 µl
BamH1 0.5 µl
Buffer 4 3.0 µl
H₂O 24.0 µl
Temperature 37°C
Time Overnight
Table 23: Vector preparation protocol – linearization
The reaction was set up in fourfold. Digested plasmid was loaded on a 1% agarose gel, the band containing the linearized vector was cut out, purified using the NucleoSpin® Gel and PCR Clean Up kit (Macherey-Nagel manual, 2012) according to protocol, and eluded with 50 µl Millipore H₂O. All four were pooled together (V
Total= 200 µl), and 5 µl from the pooled vector samples was loaded onto a gel to estimate the concentration. To ensure proper linearization, transformation of competent E. coli DM5α was performed according to the following protocol:
Reagent Amount
pSPL3b vector
1 µlSticky end master mix
5 µlH₂O
24 µlTable 24: Vector preparation protocol – control transformation
No colonies appeared on the LB + ampicillin plates indicating the vector had been completely linearized.
Digestion of Plasmid DNA
A double restriction enzyme digestion with EcoRI and BamHI was carried out to first
excise the constructs from the pGEM vector for subsequent cloning in pSPL3b. For plasmids
of a concentration of 250-500 ng/ µl the following protocol was used:
33
Reagent Volume
Plasmid
10.0 µl
EcoRI
0.5 µl
BamHI
0.5 µl
Buffer 4
3.0 µl
H₂O
16.0 µl
Temperature
37°C
Time
Overnight
Table 25: Restriction enzyme digestion protocol
Up to 23 µl of digested plasmid was used for plasmids with very low concentrations.
The digested products were fragmented on a 1% agarose gel and purified using the NucleoSpin® Gel and PCR Clean Up kit (Macherey-Nagel manual, 2012)
Ligating into pSPSL3b
4 µl of the purified construct was ligated into 1 µl pSPL3b splicing vector in 5 µl of Instant Sticky-end Ligase Master Mix, transformed in E. coli DH5α competent cells (see 3.5.2), and 200 µl plated out. Overnight culture in 5 ml LB+Amp was made from 3 colonies per plate and the plasmid purified. In order to confirm proper insertion, the digestion (Table 25) was repeated with a shorter incubation time (2h), and the product fragmented on a 2% agarose gel.
All clones selected for transfection were sequenced before use to verify correct clone integrity.
A colony stock of pSPL3b + construct was preserved in a glycerin solution (130 µl stock in 870 µl 99.5 % glycerin) and stored at -80°C.
3.9 T
RANSFECTION OFHEK 293 EBNA C
ELLSDMEM+ medium refers to Dulbecco`s Modified Eagle Medium supplemented with
FCS and pen/strep (Tables 10 & 12). DMEM- refers to medium without additives. In order to enable cell adherence, thus increasing transfection efficiency, the culture dishes were coated with poly-L-lysine. For this purpose, 6-well plates were incubated at 37°C overnight with 2 ml of poly-L-lysine solution (1:1 PBS1x: poly-L-lysin+pen-strep).
Substance Amount
Poly-L-Lysin 1000 µl
Pen-Strep 500 µl
from above solution 50 µl
in PBS 1x 50 µl
Table 26: Poly-L-Lysine solution
34 The solution was removed, and the wells rinsed with 1xPBS before sowing.
Splitting and sowing HEK 293 EBNA cells
Prior to beginning, a thorough disinfection of the working space with 70% ethanol, including all instruments under the cell culture hood, was carried out. The DMEM+ medium and trypsin were warmed in a 37°C water bath for 30 minutes. Cell growth and confluency were assessed under the microscope before splitting, which was generally done at a ratio of 1:5.
The old medium was removed with a glass Pasteur pipette, then 5 ml of 1x PBS carefully pipetted against the petri dish wall, redrawn, and 5 ml 0,5M EDTA+1xPBS added (incubation:
7 min at 37°C). The 5 ml 0,5M EDTA+1xPBS was removed and 3 ml of 2x trypsin added (incubation: 3 min at 37°C). 7 ml DMEM+ was added to the trypsin to re-suspend the cells. To do so, the medium was repeatedly pipetted up and down while turning the dish, until all cells were in suspension. This cell solution was then transferred to a 15 ml
Falcon® tubeand centrifuged for 3 min at 1500 rpm. The supernatant was removed, the pellet re-dissolved in 10 ml of fresh DMEM+ medium, of which 2 ml was sowed in 8 ml of fresh DMEM+ medium (splitting 1:5).
Transfection reaction