Students’ Health, Well-being, and Performance from Preschool to Graduation
Inaugural-Dissertation zur Erlangung der Doktorwürde
— Doctor rerum politicarum — an der Otto-Friedrich-Universität Bamberg
vorgelegt von
Johanna Sophie Quis, M. Sc.
201 9
Kumulative Dissertation
Erstgutachter: Prof. Dr. Guido Heineck Zweitgutachterin: Prof. Dr. Silke Anger Drittgutachter: Prof. Dr. Guido Schwerdt Tag der mündlichen Prüfung: 14.05.2019
Dissertationsort: Bamberg
Before embarking on this journey I was warned about the hard work and countless frustrations which result from doing a doctorate. Had I anticipated the true extent of agony and despair ahead of me, I would probably have quit. Not knowing how bad it would be, I held it with Dory and “just keep swimming” became my mantra. Whenever that did not work, I was certain to have someone supporting my back and lifting me back up. Without the continuous support of many of you, I would therefore not be in a position to finally finish off the dissertation with these opening words.
First and foremost I would like to thank my first supervisor Guido Heineck for giving me the chance to pursue my dissertation in Bamberg. His ongoing support, incredible ability to see people, appreciation, and advice in professional and personal questions guided me through the past years. I am also grateful to Silke Anger who agreed to be my second supervisor and provided helpful comments on my research. Finally, I would like to thank Guido Schwerdt, who agreed to be my third supervisor. Moreover, I am indebted to my co-authors Stefanie Herber, Simon Reif, and Anika Bela.
I would also like to thank the Bamberg Graduate School of Social Sciences (BAGSS) for fund- ing me and providing a fruitful research environment. Within BAGSS I am especially indebted to Miriam Schneider and Marc Scheibner, who relentlessly supported us BAGSS students and took genuine interest in our well-being and professional development.
Uta and Saikat started this crazy journey with me, were great office mates and good to talk to when life happened while we were making other plans. Angelika was always a role model for being a mother and doctoral student at the same time and also proved to be an amazing office mate. Our BAGSS lunch group (Gundula, Irina, Martin, Stefanie) regularly lifted my mood and listened to me ranting about life’s hardships. Stefanie, next to being an excellent travel mate, became a special friend in many regards. I admire Susanne Elsas for her calm spirit and I would not have wanted to miss the year we spent together at the chair. Both in and outside Bamberg, I am lucky to have and have found friends (Jana, Jasmin, Laura, Barbara and Andreas, Bianca and Nico, Dorothea and Oliver) who were always there.
Finally, I want to thank my family. My parents were very patient with my educational career and supported me in all dimensions. I always love coming home to see my siblings. Special thanks go to my own little family. Sönke is way too small to understand the implications of pursuing a doctorate, even though, of course, he is already noticing my being at work quite a lot. But whenever I come home or pick him up at daycare his complete focus on the basic things provides me with a lot of joy and happiness. Helge, more than anyone else, bore with the implications of my endeavor and lovingly supported me without conditions. I appreciate your endless levels of patience and understanding, especially in this final phase of this dissertation.
Thank you.
Bamberg, August 13, 2018 Johanna Sophie Quis
i
1 Introduction 1 2 Preschoolers’ self-regulation, skill differentials, and early educational outcomes
(with Anika Bela and Guido Heineck) 9
2.1 Introduction . . . . 9
2.2 Background and Prior Research . . . . 10
2.2.1 Background . . . . 10
2.2.2 Prior Research . . . . 11
2.3 Data and Empirical Strategy . . . . 12
2.3.1 Data . . . . 12
2.3.2 Empirical strategy . . . . 14
2.4 Results . . . . 16
2.4.1 Descriptive differences between patient and impatient children . . . . . 16
2.4.2 Self-regulation and competence levels . . . . 16
2.4.3 Effects on competence development . . . . 17
2.4.4 Heterogeneity analyses . . . . 18
2.5 Robustness checks . . . . 19
2.6 Conclusion . . . . 20
3 Does the Transition into Daylight Saving Time Affect Students’ Performance? (with Stefanie P. Herber and Guido Heineck) 29 4 Does higher learning intensity affect student well-being? Evidence from the National Educational Panel Study 31 4.1 Introduction . . . . 31
4.2 The G8 reform and debate . . . . 33
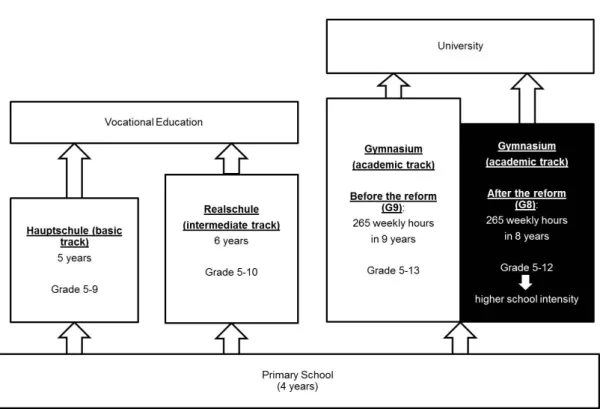
4.2.1 The German school system . . . . 33
4.2.2 Reforms shortening school duration . . . . 33
4.2.3 Prior findings on the effects of the G8 reform . . . . 36
4.3 Data . . . . 37
4.4 Empirical strategy . . . . 40
4.5 Results . . . . 40
4.5.1 Perceived stress and internalizing mental health problems . . . . 40
4.5.2 Subjective well-being in school and life in general . . . . 42
4.5.3 Effect heterogeneity . . . . 42
4.6 Robustness and extensions . . . . 45
4.7 Discussion . . . . 47
4.8 Appendix . . . . 51
ii
5 Health Effects of Instruction Intensity: Evidence from a Natural Experiment
in German High-Schools (with Simon Reif) 59
5.1 Introduction . . . . 59
5.2 Data and Empirical Strategy . . . . 61
5.2.1 The German Secondary Education Reform (G8) . . . . 61
5.2.2 Estimation Strategy . . . . 62
5.2.3 Health Indicators and Sample Selection . . . . 63
5.2.4 Descriptive Statistics . . . . 65
5.3 Results . . . . 67
5.3.1 Effects on Students in School . . . . 67
5.3.2 Effects on Students after Graduation . . . . 68
5.3.3 Double Cohort as a Moderator . . . . 69
5.3.4 Robustness Checks . . . . 70
5.4 Conclusion . . . . 72
5.5 Appendix . . . . 73
4.1 The German School System . . . . 34 A5.1 Youth Sample: Distribution of Coefficients from Placebo Regressions . . . . . 79 A5.2 Graduate Sample: Distribution of Coefficients from Placebo Regressions . . . . 80
iv
1.1 Overview of dissertation . . . . 4
2.1 Descriptive Statistics . . . . 15
2.2 Effects on Math competence level . . . . 17
2.3 Math competence development . . . . 18
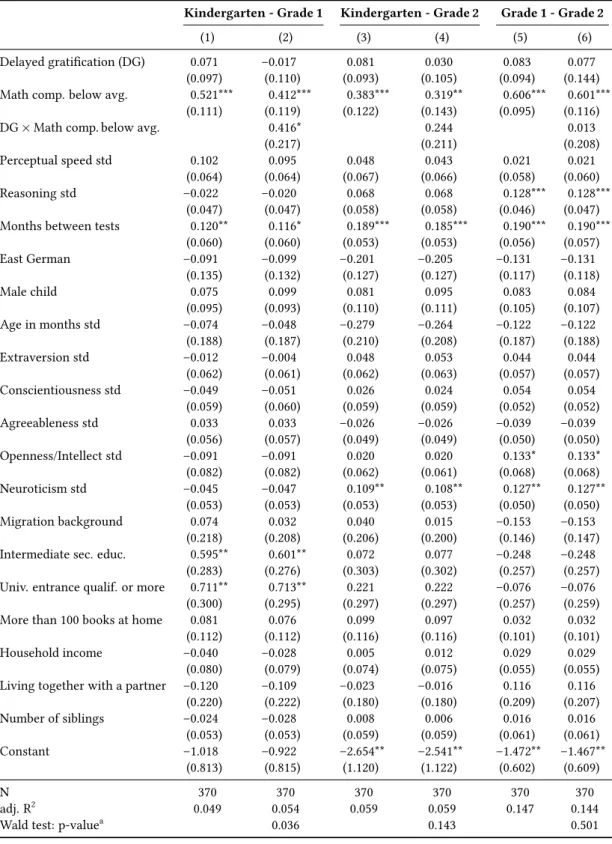
2.4 Effect heterogeneity by initial math competence . . . . 19
A.1 Comparison of full and analysis sample . . . . 21
A.2 Variable definitions . . . . 22
A.3 Effects on Math competence level . . . . 23
A.4 Effects on Math competence development (full table) . . . . 24
A.5 Effect heterogeneity by initial math competence . . . . 25
A.6 Different standard error calculations . . . . 26
A.7 Competence development from Grade 1 to Grade 2 (Control variables from Grade 1. Standard errors, reported in parantheses, are clustered at classroom level.) . . . . 26
A.8 Effects on Math competence level (Extended version of table 2.2) . . . . 27
A.9 Math competence development (Extended version of table 2.3) . . . . 27
A.10 Effect heterogeneity by initial math competence (Extended version of table 2.4) 27 4.1 Anticipated effects of the reform . . . . 35
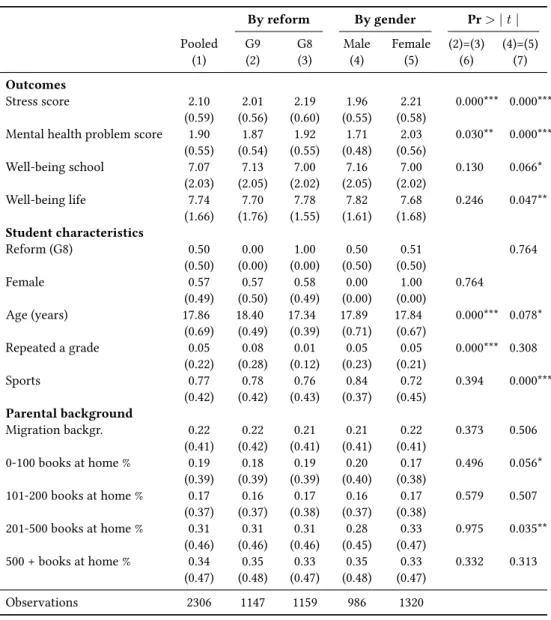
4.2 Descriptive statistics by reform and by gender . . . . 39
4.3 Regressions on stress and internalizing mental health problems . . . . 41
4.4 Regressions on students’ subjective well-being in school and life in general . 43 4.5 Effect heterogeneity . . . . 44
4.6 Robustness checks . . . . 46
4.7 Different calculations for dependent variables . . . . 48
A4.1 Description of variables . . . . 51
A4.2 Perceived stress . . . . 51
A4.3 Symptoms of internalizing mental health problems . . . . 52
A4.4 Differences in variables between G9-students in wave 2010/11 and G9-students in wave 2011/12 . . . . 52
A4.5 Differences in variables between G8-students in wave 2011/12 and G8-students in wave 2012/13 . . . . 53
A4.6 Differences in variables between G9-students in wave 2010/11 and G8-students in wave 2012/13 . . . . 53
A4.7 Effect heterogeneity: Stress and mental health problems . . . . 54
A4.8 Effect heterogeneity: Well-being in school and life . . . . 55
A4.9 Robustness checks: Stress and mental health problems . . . . 56
A4.10 Robustness checks: Well-being in school and life . . . . 57
5.1 Schedule of Reform Implementation in German States . . . . 61
v
5.2 Youth Sample: Descriptive Statistics . . . . 65
5.3 Graduate Sample: Descriptive Statistics . . . . 66
5.4 Youth Sample: Results . . . . 67
5.5 Graduate Sample: Results . . . . 68
5.6 Youth Sample: Excluding the Double Cohorts . . . . 69
5.7 Graduate Sample: Excluding the Double Cohorts . . . . 70
A5.1 Youth Sample: Probit and Ordered Probit Estimations . . . . 73
A5.2 Graduate Sample: Probit and Ordered Probit Estimations . . . . 73
A5.3 Youth Sample: Only Academic Track Students . . . . 74
A5.4 Graduate Sample: Only Academic Track Students . . . . 74
A5.5 Youth Sample: Only Similar Time to Examinations . . . . 75
A5.6 Youth Sample: Only States with many Observations . . . . 75
A5.7 Graduate Sample: Only States with many Observations . . . . 76
A5.8 Youth Sample: Heterogeneity by Parental Education . . . . 76
A5.9 Graduate Sample: Heterogeneity by Parental Education . . . . 77
A5.10 Youth Sample: Standard error calculations . . . . 77
A5.11 Graduate Sample: Standard error calculations . . . . 78
A5.12 Youth Sample (excluding double cohort): Standard error calculations . . . . . 78
A5.13 Graduate Sample (excluding double cohort): Standard error calculations . . . 81
A5.14 Description of Variables . . . . 81
ATE Average treatment effect BMI Body mass index
DiD Difference-in-differences DST Daylight saving time
G8 German academic track duration of eight years G9 German academic track duration of nine years HLM Hierarchical linear models
IEA International Association for the Evaluation of Educational Achievement NEPS National Educational Panel Study
OECD Organisation for Economic Co-operation and Development OLS Ordinary least squares
PIRLS Progress in International Reading Literacy Study PISA Program for International Student Assessment RCT Randomized controlled trial
RDD Regression discontinuity design SAT Scholastic Aptitude Test
SOEP German Socio-economic Panel ST Standard time
TIMSS Trends in International Mathematics and Science Study
vii
Introduction
Education is seen as a critical determinant of individual and societal flourishing and is hence con- stantly on policymakers’ agendas. For example, the Europe 2020 strategy includes eight headline targets, two of which are related to educational attainment, reducing school dropout and increas- ing the share of university graduates.
Further, one main topic of discussions about education in Germany and many other OECD countries concerns the capabilities of educational systems to raise student achievements. The self-identified nation of poets and thinkers was shocked by the mediocre results from the first round of the Program for International Student Assessment (PISA) in 2000. As a result, education became a major topic of German policy and public discussion. At the same time, demographic change and a relatively low female labor market participation also affected educational policies.
In the past two decades, German educational policy changed in many dimensions: The right to early childhood education was established and some federal states abandoned kindergarten fees.
Disabled children were more frequently placed in regular kindergartens and schools, tracking mechanisms between primary and secondary school changed and structural changes in lower track secondary schools were widely implemented. The academic track secondary school was compressed by a year. However, this compression was largely unpopular and most West German states returned to the old system or a more flexible version thereof. Finally, the bologna reforms and excellence initiative changed tertiary and postgraduate education. Thus, educational policy has changed recently to a certain degree at all stages of educational careers yielding a large scope for policy evaluation.
This dissertation in the economics of education consists of four independent research articles, which are oriented along the life course of students’ school careers. The first study assesses the relationship between non-cognitive skills and competence in kindergarten and early primary school. The three following studies assess different policies’ impacts on student outcomes: First, the effect of a shock to sleep duration on primary school student performance in international large scale assessments is evaluated, followed by the relationship between the academic track compression and students’ physical and mental health at academic track graduation and the following years.
The idea of education being a valuable good dates back a long time. However, it has been coined for modern economics about sixty years ago. Mincer (1958, 1974) initiated the empirical estimation of monetary returns to education, Schultz (1959, 1960, 1961, 1962) and, more formal- ized, Becker (1962, 1993) introduced human capital which, equivalent to physical or financial capital, is formed through investments into an initial stock. Typically education is seen as the most important investment good into human capital. For example, Becker (1993) states education is reflected in wage differentials, since the latter reflect productivity differentials, which in turn are determined by differentials in educational attainment. Since then, the modeling of human
1
capital has changed. Most notably, Ben-Porath (1967) added a lifetime perspective, according to which people can choose when and for how long they invest into their education and extended the model to the possibility of training, i. e. education after formal education is finished. Cunha and Heckman (2007, 2008) formalized a theoretical model of the process of skill formation.
In contrast to the perspective that education increases human capital, signaling theory (Spence, 1973) rejects the idea of education improving human capital. Instead, individuals are endowed with initial skill levels and educational attainment merely reflects other characteristics of the in- dividual for which she may be rewarded on the labor market. If this assumption were true, most aims of educational policy (like reducing inequalities and improving skills) would be unattain- able. Even though there is some evidence of sheepskin effects, i. e. degrees are honored more than attaining the same amount of education without the final certificate (Hungerford and Solon, 1987;
Jaeger and Page, 1996), there are also several studies that claim a causal relationship between ed- ucation and several dimensions of human capital.
Education is linked to a multitude of beneficial outcomes at the societal and individual level.
For example, education facilitates innovation and productivity of the society if a more educated population is better capable of adopting new technologies and thereby increasing growth. On the country level, nations with more skilled populations perform better in terms of economic growth (Barro, 2001; Hanushek and Wößmann, 2008, 2012; Balart et al., 2018). On the individual level, educational attainment is linked to lower crime rates (Lochner and Moretti, 2004; Machin et al., 2011), more political interest (Dee, 2004; Milligan et al., 2004; Siedler, 2010), better health (Brunello et al., 2013; Silles, 2009) and health behaviors (Currie and Moretti, 2003; de Walque, 2007; Cutler and Lleras-Muney, 2010; de Walque, 2010), and better labor market outcomes (Card, 1999). These findings strongly support the beneficial effects of education.
On both the individual and the country level, education is always a tradeoff between costs that occur in the present and benefits that occur in the future. On the country level, direct costs usually include the provision of education. Indirect costs occur due to foregone income tax and lower contributions to the social security systems as well as the opportunity of the individual’s skills not being employed elsewhere to produce positive externalities.
1The delayed benefits are potentially higher income taxes in the future, lower health care costs, and so on. On the individual level the direct costs encompass possible monetary costs (tuition fees, books, other education-related expenditures) and mental costs (lower utility, learning is hard work). Indirect costs are for example foregone earnings from not working while attaining further education. The benefits in the long term, among others, stem from higher earnings and better health.
Individuals tend to be bad at intertemporal decision making and, in addition, do not calculate the societal benefits of their own education. Hence, they are likely to invest too little into their own educational attainment, which serves as a common argument for governments to finance or subsidize education (Hanushek, 2002). It is important to balance tailored education to let students reach their full potential and keeping education affordable to individuals and to the society.
Even in the beginnings of human capital theory, researchers were aware that human capital encompasses a broad range of capabilities beyond formal education. Schultz proclaimed a def- inition of human capital “[...] represented by training, education, [and] additional capabilities based on health and new knowledge” (1959, p. 114). Similarly, Becker (1962) already was aware that investments into human capital, which serve to improve “the physical and mental abilities of people and thereby raise real income prospects” (p. 9) include more than just education. Hu- man capital rather needs to be interpreted as a broad construct that includes all characteristics that enable individuals to generate economic values. This includes cognitive and non-cognitive
1
The lack of positive externalities might be compensated by positive externalities from educational institutions,
like universities.
skills , personality, and health. Grossman (1972) proposed health as another important outcome of human capital formation through education.
Non-cognitive skills are important for individual success and manifest during childhood and adolescence. The development of competences usually takes place throughout childhood (e. g.
Cunha and Heckman, 2008). However, there is evidence that non-cognitive skills are malleable for a longer period than cognitive skills (Brunello and Schlotter, 2011 provide an overview of the relevant literature). In their model of skill formation, Cunha and Heckman (2007) propose pathways through which levels of and investments into skills (cognitive and non-cognitive) af- fect skills in the following periods and thereby human capital accumulation. In this setting skill begets skill, i. e. higher initial levels of skill foster larger productivity of investments into these skills. Additionally, through a multiplier process, the level of one skill also affects the level and growth of other skills. In this framework, early investments are particularly fruitful and in- creasing non-cognitive skills might also increase cognitive performance. Non-cognitive skills are often of better explanatory value for lifetime outcomes than cognitive skills (e. g. for the Perry Preschool program: Heckman et al., 2013), and often are used to predict educational at- tainment and other lifetime outcomes (e. g. Mischel et al., 1989; Duckworth and Seligman, 2005;
Heineck and Anger, 2010). Hampson et al. (2007) show that childhood personality traits affect adult health status directly and indirectly through different eating habits, educational attainment and smoking behaviors. Balart et al. (2018) also show that non-cognitive skills of a population affect economic growth to a similar degree as cognitive skills do.
The present dissertation, next to cognitive skills represented by competence measures, em- phasizes non-cognitive skills and health. It employs micro-econometric techniques to assess as- pects of the relationship between non-cognitive skills or institutional settings and competences in the first part, and the relationship between a change in institutional settings and students’
mental and physical health in the second part.
The fundamental interest in empirical research is to identify causal effects of an input on an outcome. While chapter 2 is generally rather descriptive, I claim to capture causal effects in chapters 3, 4, and 5. It would be ideal to observe the same individuals with and without the respective treatment, which generally is not possible. Therefore, special care needs to be taken when trying to identify causal effects and claiming causality (Angrist and Pischke, 2009). The second-best approach, a true randomized controlled trial (RCT) is also close to impossible in the evaluation of educational policies, mostly for financial and ethical reasons.
3Therefore, I rely on the allocation of students into treatment and control groups dependent on factors they cannot control, e. g. date of birth, in order to derive causal claims.
In the following paragraphs, I outline the contents and contributions of the chapters included in the thesis (see also table 1.1). Further, I discuss implications of the findings and possible limi- tations.
The first part of this dissertation (chapters 2 and 3) is concerned with modeling determi- nants of educational achievements via an educational production function. The educational pro- duction function incorporates student characteristics and family background, as well as school factors and institutional settings as determinants of students test achievements. Student and family characteristics typically encompass cognitive and non-cognitive skills, basic demograph- ics, and socio-economic variables of parents and children. In the past, institutional factors that have received a lot of attention were school autonomy (Clark, 2009), compulsory school dura-
2
Strictly speaking, the division of skills into cognitive skills (intelligence, subject specific competence) and non- cognitive skills (social skills, self-regulation, ...) is not correct as there are only very few non-cognitive skills that indeed do not induce cognitive processes (Duckworth and Yeager, 2015) skills, but the terms are generally used in the literature and I will stick to them.
3
Although there are some examples mainly from the US where RCTs were conducted (e. g. STAR, Perry Preschool
Project).
Table 1.1: Overview of dissertation
Chapter 2 Chapter 3 Chapter 4 Chapter 5
Title Preschoolers’ self- regulation, skill differentials, and early educational outcomes
Does the Transition into Daylight Saving Time Affect Students’
Performance?
Does higher learn- ing intensity affect student well-being?
Evidence from the National Educational Panel Study
Health Effects of Instruction Intensity:
Evidence from a Nat- ural Experiment in German High-Schools
Data NEPS SC 2 TIMSS, PIRLS NEPS BW SOEP
Methods OLS Hierarchical linear
models applying Rubin’s rules for im- puted data in a setting closely mimicking the mechanics of a re- gression discontinuity design
Before-after compari- son in a quasi-natural experiment
Difference-in- differences estimation, triple difference-in- differences estimation
Co- author(s)
Anika Bela and Guido Heineck
Stefanie P. Herber and Guido Heineck
– Simon Reif
Own contri- bution
45% 47.5% 100% 50%
tion (Angrist and Krueger, 1991; Brunello et al., 2009; Clark and Royer, 2013), and the degree and timing of tracking (Hanushek and Wößmann, 2006; Bauer and Riphahn, 2006; Brunello and Checchi, 2007). At the school level, research mainly concerns class size (Hanushek, 1999, 2006) and teacher characteristics (Rivkin et al., 2005; Hanushek and Rivkin, 2006, 2010).
The first study in this dissertation is focused on a student characteristic as input into the educational production function. Chapter 2 was jointly prepared with Anika Bela and Guido Heineck. We analyze the relationship between preschool children’s self-regulatory skills, i. e.
patience, and their mathematical competence and competence development over early primary school. The chapter uses panel data from the kindergarten-cohort of the National Educational Panel Study (NEPS). It builds upon and extends the work by Lorenz et al. (2016) by adding a longitudinal perspective. While we find significant differences in the initial levels of mathemat- ical competence between patient and impatient children, there seems to be no effect of patience on the development of competences in the full sample. Our results are robust to the inclusion of measures for general cognitive skills. However, we are able to show that among those with lower initial mathematical competence, the patient children are able to lessen the gap relative to children with high initial math competences. To the best of our knowledge, we are the first to assess the longitudinal mechanics of the interplay between self-control and cognitive skills in early childhood for German children.
Education is often understood as a means to reduce inequality by increasing chances for children from disadvantaged backgrounds to acquire the same level of skills as children from more advantaged backgrounds. However, studies show that inequalities arise early and differ- ences between children from disadvantaged backgrounds and children from more advantaged backgrounds are almost impossible to close by the time they enter school (e. g. Heckman, 2006).
Our results point into a similar direction and are in line with findings by Heckman et al. (2013)
who find that differences in outcomes of the Perry Preschool program are largely driven by
non-cognitive skills. In order to reduce inequalities, interventions need to take place as early
as possible during childhood and should ideally target both cognitive and non-cognitive skills.
However, evidence on types of interventions which could improve children’s patience is very scarce. This lack of knowledge provides scope for further research which hopefully could inform policy.
While chapter 2 assessed the relationship between a student characteristic and competence in the educational production function, chapter 3 assesses an institutional factor. School start times have received only limited attention in the literature (Carrell et al., 2011; Hinrichs, 2011;
Edwards, 2012; Heissel and Norris, 2017). Stefanie Herber and Guido Heineck and I again assess student competence, this time focusing on possible unintended consequences of a policy. We are the first to examine the effect of the transition to daylight saving time (DST) in spring on student performance in international low stakes student assessments. The channel through which we expect the transition to DST to affect student competences is via sleep deprivation due to the hour that is lost in the night between Saturday and Sunday. We utilize a quirk in the Trends in International Mathematics and Science Study (TIMSS) and the Progress in International Reading Literacy Study (PIRLS) tests in 2011. Both studies were conducted in the weeks surrounding the switch to DST in six European countries, providing data from more than 22,000 students. Using an estimation technique loosely mimicking a regression discontinuity design (RD), we compare the test performance of students who were randomly allocated to test dates before or after the switch to DST. In this setting we account for potential non-linearity in test performance (e. g.
due to a blue Monday effect). Due to the hierarchical structure of the data and since the outcome measures are provided as several plausible values for the competence of each individual student, we estimated the effects with hierarchical linear models (HLM) that additionally account for uncertainty in the imputed outcomes applying Rubin’s rules. The results suggest a DST-effect, which is small in magnitude and not statistically significantly different from zero. A broad range of robustness tests, for example classical RD estimation, serve to confirm the zero-effect. We therefore conclude that the switch to DST does not harm student performance and therefore does not challenge the validity of conclusions drawn from student assessment data collected around the switch to DST.
In conclusion, the first part of this dissertation was considering different inputs into the educational production function. The second part shifts the perspective away from the classical educational production function towards the broad view of human capital including health and well-being. Chapters 4 and 5 evaluate a series of educational reforms in Germany. The G8 reforms implied a reduction in school years needed to attain a degree from the academic track from nine to eight years of secondary school, while the federal requirements of cumulative instruction hours and contents to be taught remained unchanged. The scientific evaluation of these reforms focused mainly on student’s grades (Büttner and Thomsen, 2015; Huebener and Marcus, 2017), cognitive (Dahmann, in press; Huebener et al., in press; Hübner et al., 2017) and non-cognitive (Thiel et al., 2014; Dahmann and Anger, 2014) skills, educational decisions (Meyer and Thomsen, 2016; Meyer et al., forthcoming; Marcus and Zambre, forthcoming) and performance in university (Dörsam and Lauber, 2015; Meyer and Thomsen, 2017). The public discussion of the reforms were focused on the extent of burdens students were facing due to the reforms. An early study on burdens of the G8 system was comparing different systems across states (Böhm-Kasper and Weishaupt, 2002), in this setting causality is hard to establish, as the differences might also be attributed to inter-state differences. A more recent branch of the literature claims to assess causal effects on burdens, health and health behaviors (Meyer and Thomsen, 2015; Westermaier, 2016;
Meyer and Thomsen, 2017; Hofmann and Mühlenweg, 2017). I add to this literature by shifting the perspective to stress and internalizing mental health problems as well as subjective well- being.
In chapter 4, I assess students at the end of their school career close to high school grad-
uation. The reform outcomes evaluated include students’ perceived stress, internalizing mental
health problems and well-being. The study builds upon data on over 2,300 students from the National Educational Panel Study’s (NEPS) Additional Study Baden-Wurttemberg. The data was collected in the German federal state of Baden-Wurttemberg with the purpose of evaluating the impacts of the G8 reforms in Germany. I argue that the reform serves as natural experiment, where the assignment to the treatment or control group is random conditional on the year of school entry, which took place long before the reform was announced. The estimation of the effects relies on ordinary least squares (OLS). The results imply an increase in perceived stress and symptoms of internalizing mental health problems for females. For males, I only find an increase in perceived stress. However, neither females nor males are affected by the reform in terms of more general well-being, as measured by well-being in school and life in general. The robustness checks include several different ways of constructing the indexes that form the de- pendent variables and using the last pure G9 cohort and the first pure G8 cohort instead of the double cohort for my analyses.
While the data provides a relatively large sample size, excellent measures for perceived stress and internalizing mental health problems and a large set of controls, the nature of the reform in Baden-Wurttemberg only allows to compare different cohorts, which are either affected by the reform or not. It is therefore impossible to separate general time trends from the reform effect. This would be a problem if any other factor changed between the cohorts and affected the treated and untreated students in different ways. This problem is addressed in chapter 5, jointly prepared with Simon Reif. We assess the G8-reforms in most German states focusing on physical and mental health outcomes. We use data from the German Socioeconomic Panel (SOEP) and examine the effects of the reform on students aged about 17, who are still in school at the time of the interviews and students who already graduated to see whether the health effects of the reforms are transitory shocks or persist after students finished school. The sequential introduction of the reform over several years in the different states in Germany allows for a difference-in-differences (DiD) design of our study. In contrast to chapter 4, we are therefore able to rule out that our results are pure cohort effects. We use a triple-DiD approach with students from the intermediate secondary school track as additional control group. Further, we provide extensive robustness checks analyzing effect heterogeneity, bootstrapped standard errors (Cameron et al., 2011), and a special kind of placebo test, the permutation test suggested by Chetty et al. (2009). The results again imply significant effects of the reforms on female student’s body mass index (BMI) and worrying while they are still in school. We find no effect on any health measure for male students. In the sample of graduates we do not keep age constant, but instead the distance to graduation. The observed individuals graduated either one or two years before the interview, dependent on data availability which is not related to the assignment to the treatment or the control group. In the analyses of graduates, we are able to use more thorough health data, which is collected biannually from the adult SOEP sample. We find no impact on mental and physical health for male graduates and in some specifications positive effects on females. The positive effects on females after graduation are in line with findings on university students by Meyer and Thomsen (2017). However, we cannot confirm their finding of worse health for males who attended G8. While we were preparing this chapter, Hofmann and Mühlenweg (2017) also using the SOEP evaluated a pooled sample of students and graduates finding a slight decrease in mental health but no effect on physical health or smoking behavior.
The G8 reforms only date back a few years, and therefore, it is not yet possible to evaluate
true long-term outcomes of the reforms. The short term results seem to allow the interpretation
that the increase in instruction intensity might affect students while they are still in school but
the effects level off soon after graduation. Additionally the effects seem to stem mostly from
students in the transition phase where the reform implementation might have been rough, be-
fore teachers had fully adjusted their lessons to new settings. Finally, the double cohorts faced
increased competition due their larger size. As a result, it would be surprising to find long term health effects of the reforms.
While research on G8 finally has been established and most findings are suggesting that
the system matters less than whether or not a student is affected by the transition, most West
German states are already transitioning back to nine-year-systems. These new systems usually
offer more flexibility to choose between finishing in eight or nine years than before the original
G8 reforms. The move back to nine-year systems will result in gap years with either no or very
small graduation cohorts in the respective states – another interesting topic for further research
in the German educational system.
Preschoolers’ self-regulation, skill
differentials, and early educational outcomes
Johanna Sophie Quis, Anika Bela and Guido Heineck
2.1 Introduction
Individuals’ capabilities of delaying or even foregoing immediate consumption in order to yield better future outcomes is a critical behavioral component in life. Underlying mechanisms and processes, however, are differently addressed across economics and psychology. In economics, the “rate of time preference” is the best known concept to reflect individuals’ degree of pa- tience and is one of the most relevant theoretical parameters for modeling future-oriented, inter- temporal processes, including investment decisions, savings, health behavior, or human capital accumulation.
The psychological literature too has a long history of interest into individuals’ underlying self-regulatory skills (Vohs and Baumeister, 2016), how they relate to observable heterogeneity in, for example, delaying gratifications and whether they predict different life outcomes. A par- ticularly well established literature investigates how children differ in self-regulation and how these differentials explain e. g. adolescents’ or adults’ social and cognitive outcomes: Since the late 1960s, analyses based on the now famous Marshmallow test
1(Mischel et al., 1989) and nu- merous follow-up studies suggest for higher performance and better outcomes of individuals, who in their childhood were more patient, through their mid-forties (Casey et al., 2011; Moffitt et al., 2011).
2Another line of research in economics addresses the elicitation of adults’ time preferences (e. g. Frederick et al., 2002; Andersen et al., 2008) or individuals’ health and health-related be- havior (Courtemanche et al., 2015; Bradford, 2010). Little is, however, known about the time preferences and their impact for teenagers and, even sparser, for children. Spurred by the work of Heckman (e. g. Cunha and Heckman, 2007), recent research started to explore whether early differentials exist and by how much they affect (or are at least correlated to) later-life outcomes (Golsteyn et al., 2014).
We contribute to this yet scarce research by examining the relationship between preschool- ers’ delay of gratification, which is a manifestation of individuals’ self-regulation (Neubauer et al.,
1
With an interest in the underlying psychological processes, the test aimed at assessing children’s ability to delay gratification for a bigger reward (Mischel and Ebbesen, 1970; Mischel et al., 1972, 1989): Children were seated at a table and they were offered a marshmallow (or a similar food item that the child liked) that was set directly in front of them. The tester instructed the child that it could either wait until the tester returned and get a second Marshmallow or eat the one available before the tester returned but would in this case not get another one. The recorded waiting time was then interpreted as measure for children’s self-imposed delay of gratification.
2
In a replication study, Watts et al. (2018), however, challenge this narrative. As will be outlined in the section on prior research, they find smaller effects of children’s waiting times on behavioral outcomes at age 15 which even vanish as soon as additional background factors are accounted for.
9
2011) and their mathematical competence and its development early in primary school. Address- ing children’s mathematical competences is relevant because early math skills are a major de- terminant, if not a causal factor, for adolescents’ school success (e. g. Watts et al., 2014, 2017), which then, on average, contributes to better adult life outcomes.
Another contribution is the use of data from the kindergarten cohort of the German Na- tional Educational Panel Study (NEPS)
3, which is a recent and rich data source on individuals’
competences and their competence development. So far, barely any research has explored NEPS for the questions addressed here. Using this data allows us both to account for a broad set of relevant background variables for a sample of children from diverse social backgrounds. We further extend the study of Lorenz et al. (2016), who look at the impatience-skills-nexus from a cross-sectional and thus more descriptive perspective, by using the longitudinal dimension of the data.
We find a significantly positive association between children’s self-regulation and their math- ematical competence levels, even when holding general cognitive ability in kindergarten con- stant. Self-regulation is however not related to competence development over the first two years of primary school, meaning that the initial skill gap neither widens nor narrows substantially.
Heterogeneity analyses imply that self-regulation benefits children with low initial levels of mathematical competence at the transition from kindergarten to primary school. This advan- tage, however, vanishes between grade 1 and grade 2.
2.2 Background and Prior Research
2.2.1 Background
Conceptually, our study aligns with elements from the model of skill formation by Cunha and Heckman (2007). According to this model, variation in skills is the result of self-productivity and dynamic complementarity, meaning that the stock of skills at a particular stage in life is a function of all past investments: While self-productivity implies that past skills increase later skills directly, dynamic complementarity increases the productivity of investments into skills for individuals with a higher prior level of skills.
The data we use do not allow to assess the two mechanisms to full extent, mainly because they do not provide information on investment in the skills we are interested in. Beyond that, we focus on the effect of one skill on another, so that we examine what Cunha and Heckman (2007) call cross-effects: Cross-productivity displays the effect of the level of one type of skill in the initial period on the level of another skill in a future period while dynamic cross-complementarity suggests that investments into the other skill are more fruitful if the person had a higher level of the respective skill in the initial period.
In our analyses, we first assess the relationship between children’s self-regulation/patience, for which we have only cross-sectional information, and the level of their mathematical compe- tence as well as its short-term development. Based on the cross-productivity notion, we expect higher mathematical competence for more patient children.
We should also see that differences in initial skill levels explain different gains in mathemati- cal competence over time, possibly driven by all four mechanisms: Self-productivity implies that
3
This paper uses data from the National Educational Panel Study (NEPS): Starting Cohort 2 – Kindergarten (From
Kindergarten to Elementary School), doi:10.5157/NEPS:SC2:5.1.0. From 2008 to 2013, NEPS data were collected as
part of the Framework Programme for the Promotion of Empirical Educational Research funded by the German
Federal Ministry of Education and Research (BMBF). As of 2014, the NEPS survey is carried out by the Leib-
niz Institute for Educational Trajectories (LIfBi) at the University of Bamberg in cooperation with a nationwide
network.
higher initial math competences positively affect future math competences. Dynamic comple- mentarity suggests that investments into mathematical skills yield higher competence increases for children who start from a higher competence level. In line with cross-productivity, children, who are more patient in kindergarten, attain higher mathematical competences, and dynamic cross-complementarity finally triggers that patient children profit more from investments into their mathematical skills. Again, as there is no information on investments and as we have only a cross-section measurement of the child’s self-regulation, we cannot directly test the Cunha- Heckman model, but we rather think of it as conceptual guideline.
2.2.2 Prior Research
Research on individuals’ self-regulatory skills, or patience, in both psychology and economics can be grouped by its respective interest, i. e. whether the studies examine determinants of self- regulation/patience, its use as predictor of life outcomes, or whether children’s intertemporal choice behavior can be influenced.
4As for determinants, both nature and nurture play a role for how children differ in self- regulation in their first years of life.
5Children’s age, reflecting their brain development and its effects on decision processes, is a critical factor (Sutter et al., 2015; Bartling et al., 2010), as are children’s birth weight, their cognitive skills (Bartling et al., 2010), or breastfeeding duration (Falk and Kosse, 2016). Family background matters as well: Bartling et al. (2010), for example, use data from the German Socio-economic Panel (SOEP) and refer to the importance of maternal patience, which may hint towards a genetic component in children’s initial skill endowment, but they also refer to the importance of parental assets, including house-ownership or number of books at home. Exploring data from NEPS, Lorenz et al. (2016) also find that patience increases with age, and that girls are more patient than boys. With respect to socio-economic background they find that children with educated parents tend to be more patient and children with both parents born abroad are slightly more patient.
As for outcomes, there is by now abundant evidence that individuals’ patience is related to a large set of socio-economic indicators. To start with, results from the initial marshmallow tests show that more patient children, i. e. preschool children who were able to delay gratification for more time, performed better on a variety of outcomes throughout adolescence and adulthood:
More patient children had a lower body mass index (BMI) (Schlam et al., 2013; Seeyave et al., 2009), and performed better on a test of cognitive control during adolescence (Eigsti et al., 2006) and even in their mid-forties (Casey et al., 2011).
Recently, Watts et al. (2018) challenge this pattern. They argue that the original longitudinal associations found by Mischel and his team were based on small and highly selective samples of children whose parents were highly qualified academics. Their conceptual replication instead uses a larger and more diverse sample of children, i.e. a sample that also includes children from less thriving backgrounds. As noted before, their results suggest for smaller effects of children’s waiting times on behavioral outcomes at age 15 and that these effects vanish as soon as additional background factors are accounted for.
Yet, other replications and adaptations of the initial study reconfirm the relevance of self- regulation. For example, individuals who were more patient as child, commit less crimes until and in adulthood (Akerlund et al., 2016; Moffitt et al., 2011). They also have a lower BMI (Sutter et al., 2015; Bub et al., 2016; Golsteyn et al., 2014), perform better financially (Moffitt et al., 2011;
4
This experimental literature is yet in its infancy. It for example adresses whether changes in the default choice setting can moderate self-regulation behavior (Carroll et al., 2009; Sutter et al., 2015).
5
Sethi et al. (2000) show that the onset of differentials seems to be already observable in children as young as
18 months: children who are better at coping with a brief absence of their mother also perform better on the
Marshmallow test at the age of 5 years.
Golsteyn et al., 2014), depend on substances less frequently (Moffitt et al., 2011), are somewhat less likely to smoke (Fuchs, 1982; Bickel et al., 1999), and are healthier in general (Bub et al., 2016;
Moffitt et al., 2011).
A potential pathway of the relationship between time preferences and lifetime outcomes may be through educational attainment. Studies from the original Marshmallow tests found patient children to be rated more favorable by their parents in terms of competence, attentiveness, and their ability do deal with frustration and stress (Mischel et al., 1988), and to perform better in school (Mischel et al., 1989).
More recent studies indicate that impatience relates to more disruptive behavior in school (Castillo et al., 2011), decreases the probability of graduating from high school (Castillo et al., forthcoming), or increases drop-out from college (Cadena and Keys, 2015). Benjamin et al. (2013) further report that patient children achieve higher Scholastic Aptitude Test (SAT) scores. Bet- tinger and Slonim (2007), on the other hand, do not find a correlation of time preferences with school performance.
6Complementing the link between (im)patience and education, Golsteyn et al. (2014) find that the effect of time preferences on lifetime outcomes falls substantially if they account for educational attainment. Controlling for ability reduces the estimates as well, though to a lesser extent.
Further research demonstrates a clear, positive relationship between patience and cognitive skills. There is, however, only little research yet that examines whether this relationship is causal indeed, and in which direction causality works. For Chilean high-schools students, Benjamin et al. (2013) not only report on a link between cognitive skills and time preferences, but they suggest a possible causal impact of cognitive resources on expressed preferences. Correlations between time preferences and cognitive abilities are also found in adult populations (Shamosh and Gray, 2008; Dohmen et al., 2010), but it is unclear for these studies, which trait begets which.
Finally, and as mentioned before, we enhance the study of Lorenz et al. (2016), who conduct a cross-sectional analysis using the kindergarten cohort of the NEPS data. Their results imply a positive relation between children’s patience and mathematical, language, and cognitive skills as well as working memory, even when controlling for social background. We extend their approach by exploring the longitudinal dimension of the data in order to examine whether early self- regulation differentials add to mathematical competence development.
2.3 Data and Empirical Strategy
2.3.1 Data
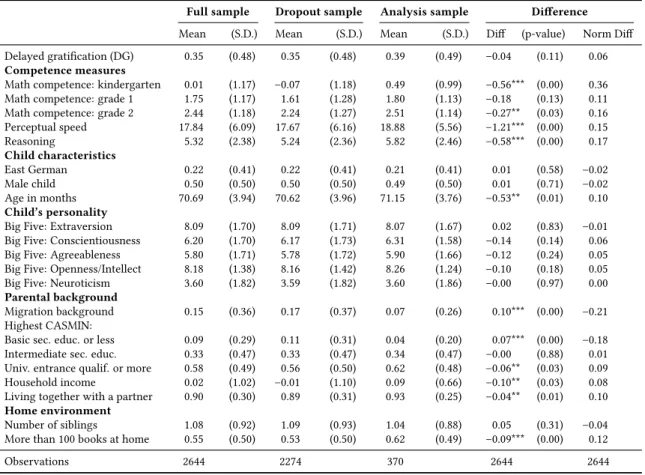
For our analyses we use data from the kindergarten children cohort of the German National Educational Panel Study (NEPS, Starting Cohort 2) (Blossfeld et al., 2011). A sample of four year old preschoolers attending kindergarten in Germany was first surveyed in 2011 and has since been followed into primary school and beyond. In the first wave, roughly 3,000 children took part in the study, but only 576 children could be followed into school which leads to a substantial decline of suitable observations for our analyses. Because we restrict our data to a balanced panel, and because of missing values in key variables our analysis sample further decreases to 370 observations.
76
For college students, evidence is mixed as well inasmuch as impatient students do not exert significantly less effort, but perform less well in exams (Non and Tempelaar, 2016). On top of that, further research suggests that time preferences may still be malleable in early adulthood and that education itself has an impact on it (Perez-Arce, 2017).
7
Table A.1 in the appendix shows that the majority of variables does not differ significantly between the analysis
sample and the full cohort sample in terms of normalized differences (Imbens and Wooldridge, 2009). Initial math
In each wave every child was tested in various competence domains over two consecutive days. The assessments were conducted individually in kindergarten and in groups in primary school. In 2012, i.e. the second wave, when the preschoolers were around their sixth birthday, their self-regulatory abilities were measured with the following test: Each child was shown a small bag with unknown content at the end of the first day of testing. The child was told that there were presents inside and it was then offered the choice to either draw one present from the bag immediately or two presents on the next day. After making sure that the child understood the implications of the decision, it was asked to choose between the two options.
Although Mischel’s Marshmallow test inspired the NEPS-test of self-regulatory abilities, the two procedures differ: Most importantly, the children in Mischel’s experiments knew what kind of gratification they would get and were in most cases exposed to it while waiting.
8This is an implementation of what Neubauer et al. (2011) call the waiting paradigm (e. g. Mischel and Met- zner, 1962; Langenfeld et al., 1997; Mischel et al., 1988; Shoda et al., 1990). Mischel and Ebbesen (1970) and Mischel et al. (1972) show that waiting times for the preferred but delayed reward reduce dramatically if children direct their attention towards the rewards (e. g. if the reward is placed directly in front of them instead of being out of their sight). In the NEPS-test, the chil- dren did not know what kind of present they could expect and were not exposed to it during the waiting period. Therefore, the NEPS-test is an implementation of what Neubauer et al. (2011) call the choice paradigm (e. g. Mischel and Gilligan, 1964; Bochner and David, 1968). According to Lemmon and Moore (2007), such tests are valid measures for children’s delay of gratification from the age of four years on.
The NEPS also provides a set of competence measures to assess children’s mathematical, lan- guage, and cognitive skills as well as their working memory. Mathematical competence, how- ever, is the only competence measure that was assessed in 2012 and in the following years. We therefore focus on the mathematical competence domain as dependent variable because we are especially interested in competence development and because it is a major predictor of educa- tional attainment (Watts et al., 2014, 2017).
The mathematical competence test procedure requires that children at the initial age of our target population (5-6 years) have already developed an understanding of the concept of numbers and are able to answer simple questions about comparisons of sets, counting tasks or ordinal aspects with the aid of illustrative materials
9(Neumann et al., 2013). To ensure that mathematical competence is measured independently from reading competence, the items were read to the children and the children answered using pictures or arabic numbers smaller than 20 (Leibniz Institute for Educational Trajectories, 2015, p. 5). Based on such tests, the scientific use file of the NEPS provides weighted maximum likelihood estimates (WLE) of the observed responses as measure of children’s mathematical competence. In order to enable comparisons over time, the competence scores were linked in a scaling study between kindergarten and grade 1 (Schnittjer, 2018) and, using anchor items, between grade 1 and 2 (Schnittjer and Gerken, 2018).
Cognitive basic skills were also tested in the second wave by assessing perceptual speed and reasoning abilities. These skills do not depend on domain-specific cognitive processes, such as language skills, but are general abilities, and core elements of the so-called fluid intelligence, which represents an important determinant of learning processes (Primi et al., 2010). To measure perceptual speed the participants have to match figures with graphical symbols as quickly as
competence, however, is higher for children who participated in the survey in all three waves which are of interest to us. We are therefore quite reserved about generalizing our findings.
8
Mischel and his co-authors experimented with a variety of different experimental settings. The one sketched here is probably the most widely known implementation.
9
For example: “In this bowl are four stones. Now I add three stones. [The bowl is covered, so the child cannot see
what is inside.] Can you tell me, how many stones are in the bowl now?” (Schnittjer and Duchhardt, 2015, p. 3 ;
our translation).
possible. For reasoning, a geometrical element has to be selected which fits the logical rules of a shown pattern of such elements (Haberkorn and Pohl, 2013). In the scientific use file of NEPS, the results of these tests are available as sum scores of correct answers.
In addition to competence measures and child characteristics, the NEPS provides information on family background. In our case, we can use context data for a rich set of cross-sectional as well as longitudinal information on background characteristics of the children and their families.
102.3.2 Empirical strategy
To assess the impact of the decision to wait on the child’s math competence levels, we estimate the following model:
M
i,t= α · delay
i,t=k+ X
iβ + ϵ
i, (2.1) where M
i,tis the mathematical competence of child i in time period t ∈ k, 1, 2 (kinder- garten, grade 1 or grade 2), delay is a dummy variable indicating whether the child decided to wait in the delay of gratification task, so that α is the coefficient of interest. X
iis a set of in- dividual background characteristics as outlined in detail later on, which first excludes and later includes measures for basic cognitive skills in t = k; ϵ
iis the individual error term clustered at kindergarten group level.
We next examine whether the child’s decision to wait also relates to the gains in skills over time in a second set of estimations:
M
i,t− M
i,t−s= α · delay
i,t=k+ X
iβ + ϵ
i, (2.2)
i. e. we measure the effect of being able to wait on the development of mathematical compe- tence. M
i,tdisplays math competence in t = 1 or t = 2 and M
i,t−sis math competence one or two periods earlier (t = k or t = 1).
In a final step, to assess potential effect heterogeneity within the initial mathematical com- petence distribution, we add a dummy for whether the child’s mathematical competence was below average in kindergarten (D
i,Mi,k<M¯k
) and interact it with delay of gratification:
M
i,t− M
i,t−s= α · delay
i,t=k+ δ ·(D
i,Mi,k<M¯k
· delay
i,t=k) + γ · D
i,Mi,k<M¯k+ X
iβ + ϵ
i. (2.3) Based on prior research, the vector X
icontains a range of covariates to account for likely influences on both the child’s competence development and his or her self-regulation. In partic- ular, we control for the following child’s characteristics: age, gender, and whether it lives in East or West Germany.
To account for a potential confounding impact of the child’s personality on self-regulation, we include parental ratings of the child’s Big Five personality traits, i. e. openness, conscientious- ness, extraversion, agreeableness, and neuroticism (McCrae and John, 1992).
11Parental background is controlled for by including covariates on migration background, whether the interviewed parent lives with a partner, parental education, and household income. We fur- ther account for the learning environment at home by controlling for the number of books at home, as well as the number of siblings.
1210
Table A.2 in the appendix provides information on all the variables we use in our analyses.
11
Parental ratings of children’s personality were measured in a specifically designed questionnaire by Müller et al.
(2016).
12
In additional specifications, we included further context information on kindergarten characteristics. The addi-
tional estimations included children-to-kindergarten-staff ratio as a rough global indicator for childcare quality,
Table 2.1: Descriptive Statistics
Pooled Patient Impatient Difference
Mean (S.D.) Mean (S.D.) Mean (S.D.) Diff (p-value) Delayed gratification (DG) 0.39 (0.49)
Competence measures
Math competence: kindergarten 0.49 (0.99) 0.74 (0.95) 0.33 (0.99) 0.41*** (0.00) Math competence: grade 1 1.80 (1.13) 2.04 (1.02) 1.64 (1.17) 0.40*** (0.00) Math competence: grade 2 2.51 (1.14) 2.77 (1.02) 2.35 (1.18) 0.42*** (0.00)
Perceptual speed 18.88 (5.56) 19.57 (6.11) 18.44 (5.14) 1.13* (0.07)
Reasoning 5.82 (2.46) 6.19 (2.41) 5.58 (2.47) 0.60** (0.02)
Child characteristics
East German 0.21 (0.41) 0.15 (0.36) 0.24 (0.43) –0.09** (0.03)
Male child 0.49 (0.50) 0.47 (0.50) 0.50 (0.50) –0.03 (0.60)
Age in months 71.15 (3.76) 71.35 (3.77) 71.03 (3.75) 0.32 (0.42)
Child’s personality
Big Five: Extraversion 8.07 (1.67) 7.95 (1.70) 8.15 (1.65) –0.19 (0.28) Big Five: Conscientiousness 6.31 (1.58) 6.39 (1.64) 6.25 (1.54) 0.14 (0.42) Big Five: Agreeableness 5.90 (1.66) 6.13 (1.57) 5.75 (1.70) 0.39** (0.03) Big Five: Openness/Intellect 8.26 (1.24) 8.43 (1.30) 8.15 (1.20) 0.28** (0.04) Big Five: Neuroticism 3.60 (1.86) 3.53 (1.95) 3.64 (1.80) –0.12 (0.57) Parental background
Migration background 0.07 (0.26) 0.10 (0.31) 0.05 (0.22) 0.05* (0.09) Highest CASMIN:
Basic sec. educ. or less 0.04 (0.20) 0.03 (0.16) 0.05 (0.22) –0.02 (0.29) Intermediate sec. educ. 0.34 (0.47) 0.29 (0.46) 0.36 (0.48) –0.07 (0.15) Univ. entrance qualif. or more 0.62 (0.48) 0.68 (0.47) 0.59 (0.49) 0.09* (0.07)
Household income 0.09 (0.66) 0.09 (0.63) 0.10 (0.68) –0.01 (0.86)
Living together with a partner 0.93 (0.25) 0.94 (0.23) 0.92 (0.26) 0.02 (0.45) Home environment
Number of siblings 1.04 (0.88) 1.06 (0.78) 1.02 (0.93) 0.03 (0.71)
More than 100 books at home 0.62 (0.49) 0.65 (0.48) 0.60 (0.49) 0.04 (0.39)
Observations 370 144 226 370
Notes:
Data: NEPS SC2 5.1.0, own calculations. Difference displays the difference between patient and im-
patient individuals. *
p <0.1, **
p <0.05, ***
p <0.01.
2.4 Results
We start by presenting descriptive differences between children who decide to wait and who do not. In a next step we discuss our baseline specification OLS models with mathematical compe- tence levels as dependent variable. Note that we always cluster our standard errors at the kinder- garten group level to control for within-group error correlation (Angrist and Pischke, 2009).
13We first estimate level differences in math competence by self-regulation in kindergarten, grade 1 and grade 2 separately. We then analyze how delayed gratification is related to the competence devel- opment of children by using gains in mathematical competence as dependent variable. Finally, we interact initial mathematical competence with the decision to delay gratification to detect whether children, who were initially weaker in the math test, show different competence gains over time.
2.4.1 Descriptive differences between patient and impatient children
Differences in test scores and characteristics between patient and impatient children are reported in table 2.1. In our sample, 39% of the children decided to wait for the next day in order to receive two presents instead of one present they could have got immediately. We further see a strong assocation between children’s ability to wait and their mathematical competence: Patient children outperform impatient children in all domains.
There, however, are not many statistical differences in child characteristics. On average, patient children score higher on the Big Five measure of Openness to Experience and Agreeable- ness, come from a household where parents have higher educational attainment, live less often in Eastern Germany, and more often have a migration background than impatient children. They however do not statistically differ in terms of age, gender, the Big Five traits other than Openness and Agreeableness, and the learning environment at home.
2.4.2 Self-regulation and competence levels
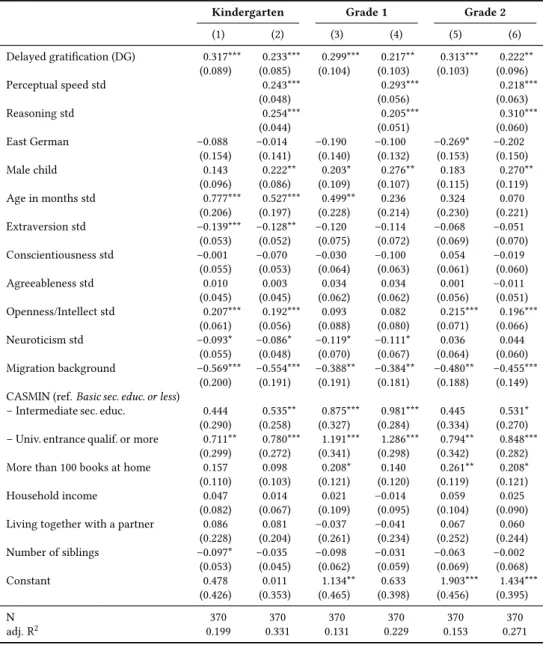
The purely descriptive patterns suggest a strong positive association between patience and math- ematical competence. To net out a confounding impact of the child’s characteristics, we next an- alyze the association between the ability to wait in kindergarten and mathematical competence in all observed years in a regression framework. That is, we condition on the covariates as de- scribed before and run multiple regressions for the kindergarten wave, where both mathematical competences and self-regulation were measured, as well as for grade 1 and grade 2 for which we examine levels of and gains in mathematical competences. For each wave, we regress two speci- fications, one accounting for self-regulation only and another that additionally includes general cognitive abilities in order to capture potentially confounding effects. The main results of these regressions are summarized in table 2.2, full results are given in the appendix, table A.3.
The results in columns 1 and 2 of table 2 show the cross-sectional relationship between pa- tience in kindergarten and mathematical competence. Both constructs were measured on the same day, so that the results cannot be interpreted as causal. The coefficients show a strong pos- itive relationship between the decision to wait and mathematical competence in kindergarten.
With a competence score differential of 0.31 points (roughly 31% of a standard deviation), the size of the level difference is substantial (column 1). When additionally controlling for general cog- nitive ability in kindergarten (column 2), the differential decreases only slightly, implying that
group size, or gender composition. Because of large unit non-response at the kindergarten management level, sample size is substantially lower. This yields trivial results which are not reported here.
13
Our results are, however, not sensitive to this as we show in section 2.5.
Table 2.2: Effects on Math competence level
Kindergarten Grade 1 Grade 2
(1) (2) (3) (4) (5) (6)
Delayed gratification (DG) 0.317*** 0.233*** 0.299*** 0.217** 0.313*** 0.222**
(0.089) (0.085) (0.104) (0.103) (0.103) (0.096)
Perceptual speed std 0.243*** 0.293*** 0.218***
(0.048) (0.056) (0.063)
Reasoning std 0.254*** 0.205*** 0.310***
(0.044) (0.051) (0.060)
N 370 370 370 370 370 370
adj. R
20.199 0.331 0.131 0.229 0.153 0.271
Notes:
Data: NEPS SC2 5.1.0, own calculations. All estimations contain a constant and all other explanatory variables named in table 2.1. For results on controls see appendix, table A.3.
Standard errors, reported in parentheses, are clustered at kindergarten group level. *
p <0.1,
**
p <0.05, ***
p <0.01.
general cognitive skills are a confounding factor, yet that self-regulation is not fully determined by or simply representing these skills.
14In columns 3 to 6, we present the results of the decision to delay gratification in kindergarten on mathematical competence in grade 1 and 2, again based on specifications ex- or including general cognitive skills. The magnitude of the level differences as given in the kindergarten wave remains almost unchanged.
15Our results indicate a substantial positive relationship between children’s ability to delay gratification and current as well as future mathematical competence. In terms of inequalities we see a competence gap between more and less patient children already in our first wave, i.e. when patience is measured, and that it persists over the following two years, even if initial general cognitive ability is controlled for.
2.4.3 Effects on competence development
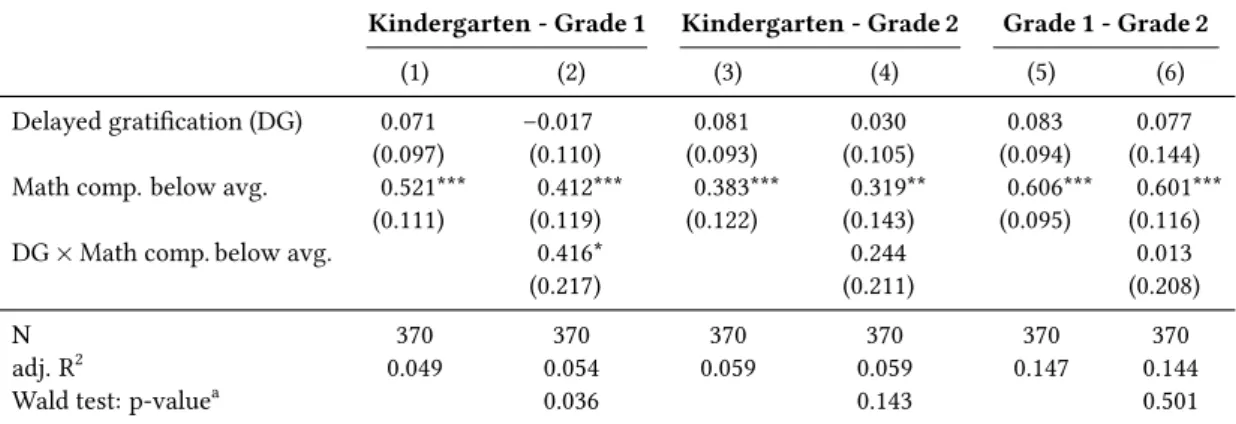
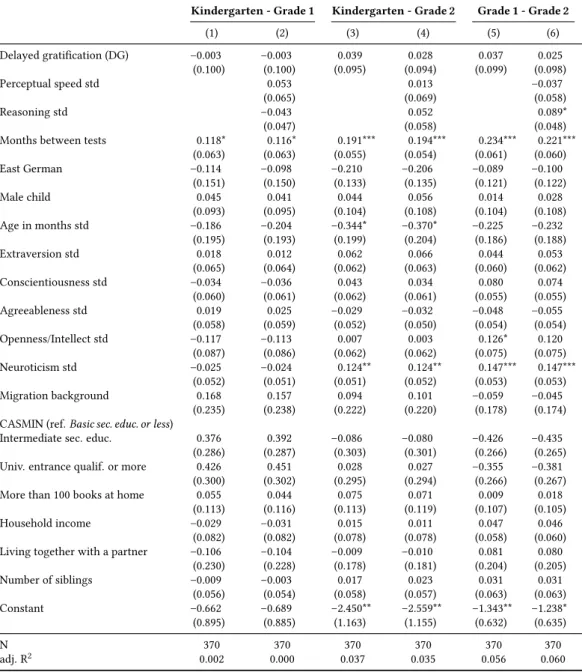
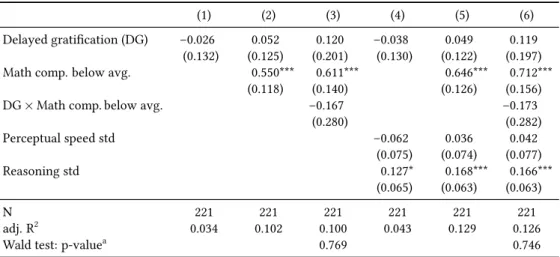
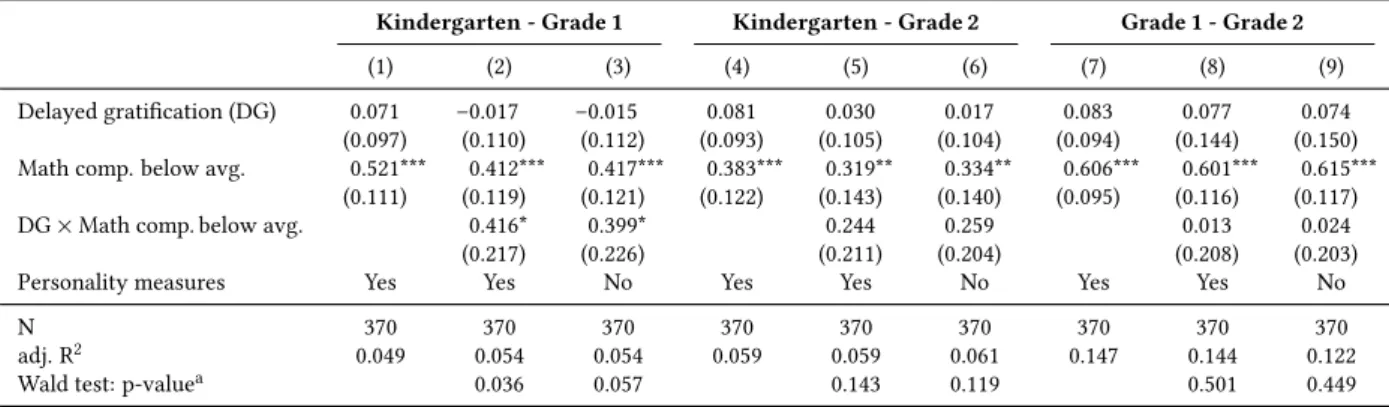
We next examine whether the competence gap between patient and impatient children persists and estimate a value-added-type specification. The dependent variable in this setting is the differ- ence in mathematical competence between two waves. We consider three different time frames and examine changes in mathematical competences: from kindergarten to grade 1 (table 2.3, columns 1 and 2), from kindergarten to grade 2 (columns 3 and 4) and, finally, changes between grade 1 and grade 2 (columns 5 and 6).
16We again estimate two sets of specifications, first ac- counting only for socio-demographic characteristics and adding general cognitive ability in the second set of models.
The results imply that self-regulation has no impact on the change in mathematical compe- tence in the first two years of primary school. Adding general cognitive ability, the coefficients are again slightly attenuated and in general do not suggest that general cognitive abilities impact
14
Note however that explained variation increases substantially if general cognitive skills are accounted for. For the other covariates, we observe that being male, age, being open for experiences, and higher parental education are positively related to math competence, while being neurotic, extraverted and having a migration background are negatively related to kindergarten math competence (cf. A.3, column 2).
15
Similar to the estimates in column 2, the explanatory power of the model increases substantially if general cog- nitive abilities are accounted for.
16