Does higher learning intensity affect student well-being? Evidence from the National
Educational Panel Study
Johanna Sophie Quis
Working Paper No. 94 January 2015
k*
b
0 k
B A
M
AMBERG CONOMIC
ESEARCH ROUP
B E
R G
Working Paper Series BERG
Bamberg Economic Research Group Bamberg University
Feldkirchenstraße 21 D-96052 Bamberg Telefax: (0951) 863 5547 Telephone: (0951) 863 2687 felix.stuebben@uni-bamberg.de
http://www.uni-bamberg.de/vwl/forschung/berg/
ISBN 978-3-943153-11-8
Redaktion:
Dr. Felix Stübben
Does higher learning intensity affect student well-being? Evidence from the National
Educational Panel Study
Johanna Sophie Quis
∗January 8, 2015
Starting in 2004/2005, the German state Baden-Wurttemberg reduced academic track duration from nine to eight years, leaving cumulative instruction time mostly unchanged. I use this change in schooling policy to identify the effect of schooling intensity on student well-being in life and school, perceived stress, mental health indicators and self-efficacy. Using rich data from the Na- tional Educational Panel Study (NEPS), estimates show higher strains for girls in terms of stress and mental health than for boys. Unexpectedly, male subjective general well-being slightly in- creases with the reform. Student well-being in school and self-efficacy remain mostly unchanged.
Keywords:self-efficacy, high school reform, subjective well-being, mental health, stress, NEPS JEL Classification:I12, I28, I21, J24
∗Corresponding address: Bamberg Graduate School of Social Sciences (BAGSS), University of Bamberg, Feldkirchenstr. 21, 96052 Bamberg, Germany, Tel: +49-951-863-2448, E-mail: johanna.sophie.quis@uni- bamberg.de.
1 Introduction
In the early 2000s, responding to the comparatively high age of German academic track graduates and the unsatisfactory results from the first round of PISA tests, most German L¨anderreduced secondary school duration in the academic track (Gymnasium) from nine (G9) to eight (G8) years. The reforms sparked a controversy about the workload induced.
While school duration was reduced by a year, federal requirements for cumulative in- struction time remained the same.
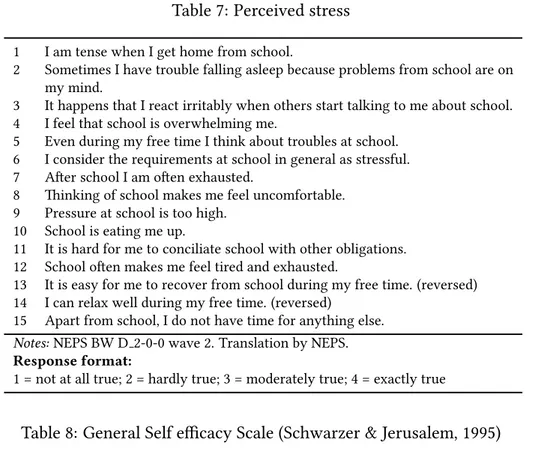
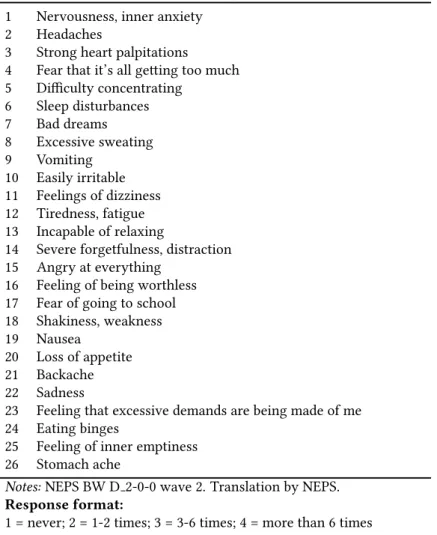
In 2004/2005 the south-western German state Baden-Wurttemberg introduced G8 for 5th-graders. Therefore, the first cohort of G8 students graduated in 2012 after complet- ing a total of 12 school years. Using the rich dataset of the Additional Study Baden- Wurttemberg of the National Educational Panel Study (NEPS), which was conducted to evaluate the introduction of G8, I provide more insight with respect to the influence of school intensity on student well-being in a broader sense. Differences in stress, mental health, self-reported satisfaction with life in general and school in particular, as well as self-efficacy, a measure of perceived competence to cope with stressful situations1, are considered in the analysis. Mental health is measured by the occurrence of 26 related conditions and stress at school contains 15 indicators.
With this study I pursue two research questions: First, I assess whether the reduction in school duration affected measures of student well-being such as stress, mental health, self-efficacy, and self-assessed satisfaction with school and life. Second, I analyze het- erogeneity within the effects by considering which types of students are more likely to be affected by the reform. In particular, I pay special attention to the differences between male and female students, because both occurrence and sensitivity to mental health problems in adolescence differ substantially between genders (Bilz, 2008).
Decreased well-being in school would be a noteworthy outcome of the reforms, since a growing literature states that students’ well-being in school and life matters for edu- cational attainment, labor market outcomes and well-being in later life. Despite a vivid public debate, only little empirical research exists on the relation between student well- being and the German school reforms. To the best of my knowledge, a team of Ger- man pediatricians (Milde-Busch et al., 2010) is the only one, that empirically evalu- ated headache and other stress-related symptoms for G8-students as compared to G9- students, finding no higher prevalence of the symptoms in G8-students.
The analysis provides hints that the implementation of G8 for all Gymnasium students did not reduce students’ satisfaction with school and life in general. Nevertheless, stu- dents, especially females, report more stress and more mental health related symptoms when they are subject to G8. The observed effects might be either caused by implemen- tation problems of the reform and specific to the double cohort observed in the data or a general consequence of the implementation of G8 or a combination of both. In any case, school reforms can have a detrimental effect on a large number of students’ men- tal health and stress levels. This should be considered for future reforms in the school system.
1 Refer to section 4 for more information on the concept and further references.
2 Why well-being of students matters
While there is an ongoing debate about how increased schooling intensity affects skills and academic performance of students in Germany (B¨uttner and Thomsen, 2013; Thiel et al., 2014), Canada (Morin, 2013; Krashinsky, 2014)2, and Switzerland (Skirbekk, 2006)3, little is known about effects on stress, student well-being, mental health and self-efficacy.
All of these aforementioned dimensions are important for an evaluation of the reform reducing school duration, because a recent and growing body of literature provides ev- idence that these dimensions matter for several long-term outcomes.
Concerning student well-being, L´evy-Garboua et al. (2006) demonstrate that adolescents reporting unhappiness and dissatisfaction are more likely to engage in risky or unde- sirable behaviors (among others: smoking, drug use, school absenteeism and violence).
De Neve and Oswald (2012) conclude that adolescents who report higher life satisfaction and positive affect have higher income in later life. Mediating pathways of these findings are higher probabilities of obtaining a college degree, being optimistic and extroverted, less neurotic, and being hired and promoted more often.
Likewise, mental health conditions have adverse effects on labor market outcomes: Male adolescents with mental conditions are more often unemployed, take up more social ben- efits and receive lower income throughout adulthood (Lundborg et al., 2014). Carneiro et al. (2007) observe that depression at age 11 reduces the probability of attaining educa- tional degrees, increases the probability of heavy smoking at age 16, being expelled from school, and reporting symptoms of depression at age 42. Reivich et al. (2013) point out that depression and subclinical symptoms of depression in childhood and adolescence are stable over the life course and interfere severely with the child’s ability to function.
3 The high school reform and public debate
This section briefly introduces the German school system, then describes the G8 reforms and finishes with an overview of the public and scientific debates that were induced by the reform. For a more thorough explanation of the German school system refer to Lohmar and Eckhardt (2013).
3.1 The German school system
Even though the German school system is heterogeneous because education policies lie within responsibility of the 16 states, it is common for students to start school at about 6 years and attain at least nine school years, which is the legally required minimum length
2 The Canadian province Ontario reduced high school duration from 5 to 4 years, leading to negative effects on academic performance.
3 Using regional differences in school duration across Swiss cantons, Skirbekk (2006) finds no evidence of lower test scores in the Trends in International Mathematics and Science Study (TIMSS) for students in cantons with a shorter school duration.
of general school education in all states.4 In most states, all students attend primary school (Grundschule) for four years. After fourth grade, students are usually separated into three different tracks.
The basic trackHauptschuleprovides basic general education and usually lasts from 5th to 9th grade. The middle track Realschule provides more extensive general education and lasts from 5th to 10th grade.5 Both Hauptschule and Realschule qualify students for vocational training. Students who finishedHauptschule particularly successful can attain aRealschul-degree. Well performing students fromRealschulecan also attend fur- ther schools to acquire a limited entrance qualification into higher education or, in some cases, attend upper secondary education in theGymnasiumthereby acquiring theAbitur.
The academic track,Gymnasium, provides intensified general education and usually lasts from grade 5 to 12 or 13, depending on whether the student is enrolled in a G8 or G9 track. Prior to the German reunification in 1990, all East German states had school sys- tems leading to theAbiturafter 12 years, while all west German states required 13 years.
After 1990, Brandenburg, East Berlin, Mecklenburg-Western Pomerania and Saxony- Anhalt adopted the West German system, while Saxony and Thuringia maintained the G8 system. Additionally, some states, including Baden-Wurttemberg already offered G8 classes in selected schools as fast-track programs to highly able students before G8 was implemented as a general system. Successful completion of Gymnasium leads to the Abitur, the formal entry qualification for higher education in Germany.
While education policies are determined at state level, theKultusministerkonferenz6sets some binding requirements for the educational framework at the federal level to ensure comparability of schools and degrees within Germany.
3.2 Reforms shortening school duration
The G8-reforms reduced secondary school duration from 9 to 8 years in most German states after 2000. With the Bologna-reforms, pressure on Germany to shorten the total duration of education increased (B¨uttner and Thomsen, 2013, p.4). Germans were (and are), in international comparison, older when they enter the labor market. This is partic- ularly striking for academic track students, who spend relatively long time in secondary school7 and often afterwards longer time in university8 than on international average (B¨uttner and Thomsen, 2013). In most OECD states primary and secondary schooling have a combined duration of 12 years, though there are some exceptions with schooling ranging between 10 and 14 years.
4 Compulsory school duration in Germany is 12 years, but the last years can be spent in part time vocational schools in the German dual apprenticeship system (Lohmar and Eckhardt, 2013, pp. 25-26).
5 Recently, a number of states have either abolishedHauptschuleor reformed and renamed it. Therefore, some states nowadays have one comprehensive school that combinesHaupt-andRealschuleor a basic track that is not calledHauptschuleanymore.
6 The Standing Conference of the Ministers of Education and Cultural Affairs of the L¨ander in the Federal Republic of Germany
7 The typical graduation age for the German Abitur was 19 in 2000 and 2003 (OECD, 2000, 2003, Annex 1), and with 19 to 20 years even higher in 2011 (OECD, 2013, p. 408).
8 Their graduation age was 25 to 26 years in 2000 (OECD, 2000), and 25 to 27 years in 2011 (OECD, 2013).
Furthermore, while German performance in the first round of PISA tests in 2000 was disappointing, Thuringia and Saxony, who had G8 systems, performed better than the German average. This additionally increased the demand for shortening school duration.
The reduction of the school duration took place without changes in the joint require- ments for graduation at the federal level (Kultusministerkonferenz, 2013). This means students had to complete 265 weekly instruction hours between grade 5 and graduation, irrespective of whether they attended the G8 or G9 track. Concerning academic require- ments, the unified examination requirements remained in place. Nevertheless, the state Baden-Wurttemberg revised all curricula and moved from an input-oriented teaching plan to an output-oriented education plan, thereby reducing analysis had, therefore, dif- ferent curricula from grade 5-11 (G9) and 5-10 (G8). In their last two years, i. e. in grade 12-13 for G9- and in grade 11-12 for G8-students, the first G8-students and the last G9- students were instructed together and faced the same requirements in class as well as in theAbitur examinations. This means, that in comparison to the G9-students the G8- students had to acquire the same amount of skills in a shorter period of time, thereby increasing the learning intensity.
3.3 Public debate
When implementing the G8 reform, policymakers had several aims in mind. One was to make students enter the job market earlier to increase international competitiveness of German of graduates from academic track secondary and from tertiary education (Ministerium f¨ur Bildung Kultur und Wissenschaft, Saarland, 2000). Another motive was the perceived urge to react to demographic change (B¨uttner and Thomsen, 2013), reduce the costs of schooling (Wiater, 1996) and increase schooling efficiency (Schavan and Ahnen, 2001).
Opponents of G8 stated the following positions and fears: First, increased schooling intensity reduces time for extra-curricular activities and impedes personal as well as psycho-social development (Wiater, 1997). Second, they feared that cost-reductions through reduced school duration would be outweighed by additional costs through G8, because G8 requires full-time education, coming along with canteens and the like, and revised curricula. Third, time pressure leads to superficial learning and reduced perfor- mance levels (Dam, 2005; Altner, 2007; Br¨utting, 2007).
Public debate about G8 was mostly shaped by parents who feared an overwhelming workload for their children. Accordingly, a variety of newspaper articles stated that students’ stress levels increased dramatically and that the”Turboabitur”was preventing children from having a normal childhood with enough time to play, recreate, and the like (Sussebach, 2011, e. g. ). Conversely, several newspaper articles claimed that the Abitur after 12 years has been common in Saxony and Thuringia, causing no such problems and that reports of student overload were single cases exaggerating a rather small problem that exists only for low performing academic track students.9
9 For further details on the entirety of the debate about G8 please refer to the comprehensive summary by K¨uhn et al. (2013).
Once G8 was introduced, Custodis (2011) and Geiler (2011) claim in a teacher’s magazine that G8 reforms worsened students’ psycho-social situation and increased subjective stress and health strains. They do not provide empirical evidence.
3.4 Scientific findings
Kaiser and Kaiser (1998) evaluated a fast-track program in Rhineland-Palatinate where highly skilled students were sorted into a fast-track classroom. These students spent one year less in lower secondary school followed by courses together with regular-track students, who were one grade level ahead, in the final two years. In this setting, fast-track students suffered from less anxiety, less concentration and memory problems, showed more positive affect, did not report less leisure time, and with respect to locus of control, reported external agency less often. No disadvantage in academic terms was reported for fast-track students. Of course, selection into the fast-track may be the major factor driving these results. Heller (2002), and Zydatiß (1999) also evaluated programs with similarly positive results regarding the G8 system for highly able students.
As average or low performing academic track students differ substantially from the very highly skilled, G8 might not be suited to account for mixed abilities within regular aca- demic track classrooms. Therefore, G8 as general system needs to be evaluated anew.
A study that evaluates G8 as general system is a comparison of Bavaria, Brandenburg and Thuringia by B¨ohm-Kasper and Weishaupt (2002).10 They examine burdens and strains of students and teachers. Their sample consists of 5500 students in grade 8 and in the penultimate grade of the respective state.11 They find that students do not spend more time on school preparation in Thuringia (G8) compared to Bavaria (G9). Overall, all hypotheses regarding the differences between G8 and G9 have to be rejected in the study:
The total time burden is not much higher in Thuringia (G8) as compared to Brandenburg and Bavaria; the time spent on school preparation in Thuringia is much lower than in Bavaria, which compensates for the additional time Thuringian students spend in school;
and there is no evidence for higher learning pressure or increased subjective strain in Thuringia. Since the German school system is in the responsibility of the respective state, a direct comparison between states might capture differences in policies between states other than G8/G9-differences. Therefore, I use data from only one state to capture G8 effects.
Concerning the previously stated goal of an earlier job market entry, Huebener and Marcus (2014), using administrative data, attribute a reduction of graduation age by 10 months to the reform. At least part of the difference to a full year, which could have been expected, is linked to a sharp increase in G8-student grade repetition during the penultimate year of schooling.
10 Brandenburg (former East Germany) and Bavaria (former West Germany) had a G9 system at that time, Thuringia (also former East Germany) had kept its 12-year school system after the German re- unification.
11 Grade 11 in Thuringia and grade 12 in Brandenburg and Bavaria.
There were also studies on grades (B¨uttner and Thomsen, 2013), non-cognitive skills (Thiel et al., 2014), and educational decisions (Meyer and Thomsen, 2013) finding a mix- ture of results either supportive or critical toward G8. The Autorengruppe Bildungs- berichterstattung (2010) reports less mobility from lower tracks into the academic track after the reform. Another recent study by Dahmann and Anger (2014) evaluates the reform impacts on the personality of students, finding more extroversion and less emo- tional stability among G8-students.
In the aforementioned pediatric study, Milde-Busch et al. (2010) compared G8- and G9- students, finding bad health of students attending G8 and G9. However, G8-students reported less leisure time to compensate for school stress.
To sum up, there is a heated public debate especially about the burdens of G8 as compared to G9. Nevertheless, there is only little empirical knowledge about the actual effects of G8. In my analysis, I contribute to closing the research gap with respect to subjective stress and health burdens as well as self-assessed life satisfaction in a larger within-state sample.
The reforms led to a higher schooling intensity and G8-students face a more challenging school environment. In a normal school week, they have to spend more time in school to attain the required cumulative instruction time and potentially still have to spend the same amount of time on homework, tutoring, exercise and preparation as G9 students.12 This reduces students’ available time for all other activities. In addition, the reduction in school duration should lead to a higher learning speed in class, which is, for some students, an additional burden. Especially in the double cohort13, the competition be- tween students from G8 and G9 might be more pronounced. Students in school, who can already foresee increased competition for scarce resources directly after graduation (e. g. apprenticeships, volunteering activities, university places, student accommodation in university cities,...), might additionally suffer reductions in well-being. On the other hand, more time spent in school might also mean, students spend more time with their friends in school. Therefore, the effect of increased stress on student general life sat- isfaction might be reduced by an increase in satisfaction with social aspects of school life. Additionally, a perceived pressure from outside, e. g. through media coverage or parents and teachers, might also lead to a stronger spirit of solidarity among students which makes ex ante predictions of the reform effect on satisfaction with life in general and on satisfaction with the situation in school difficult. Therefore, predictions of the reform effect on well-being in terms of satisfaction with life and school remain ambigu- ous. When nothing else changes, especially not the coping mechanisms of students, I expect perceived stress levels to rise. Since an increase in stress is related to an increase in psychic and psychosomatic problems (Bergm¨uller, 2007, p. 166), I expect the reform to negatively influence mental health of the students.
12 265 weekly instruction hours withing nine years means, on average, 29.44 weekly instruction hours per year, while the same cumulative instruction time requires an average of 33.1 weekly instruction hours if spread over eight years.
13 When the school system was reformed in Baden-Wurttemberg, the last G9 cohort and the first G8 cohort graduated in the same year. These two cohorts were taught together in the last two school years and are referred to asdouble cohort.
4 The National Educational Panel Study
The National Educational Panel Study (NEPS)14, more specifically the second wave of the Additional Study Baden-Wurttemberg, is the database for this evaluation. The study was conducted to answer whether the shortening of school duration by one year decreased student achievement and cognitive functioning, whether there were negative reform effects on students’ well-being and leisure-time activities, and whether it increased the participation in private tutoring (Wagner et al., 2011, p. 245). It was conducted in late spring 2012 in 48 academic track schools in Baden-Wurttemberg. A total of 2391 students were sampled. The study included a survey and competence tests for students; additional surveys were completed by teachers and school principals. The testing took place a few weeks before theAbitur examinations.
I consider well-being in a holistic approach, taking into account a vector of specific bur- dens students face and more general reports of their satisfaction with life and school.
The data are particularly well suited for this kind of analysis because they contain ques- tions about school stress-related symptoms, a questionnaire on common symptoms of internalizing mental health problems (e. g. anger, sadness, exhaustion, and headaches), measures of subjective well-being (self-assessed life and school satisfaction), and a mea- sure of self-efficacy. A rich set of background variables provides information on books at home, previous grade repetitions, sports participation, and migration background. All of these and, in addition, students’ gender form important control variables because they are likely to influence student well-being themselves. Previous research has shown that adolescent females suffer from stress and mental health issues more strongly than males (e. g. Bergm¨uller, 2007; Bilz, 2008). Therefore I additionally conduct analyses separately for male and female students.
Previous literature identified depression as important factor for long-term mental health problems. Depression is characterized by intense sadness or irritability, disrupted con- centration, sleep problems, eating anomalies, unsettled energy levels, feelings of hope- lessness, and suicidal thoughts (Reivich et al., 2013). Some of these measures are collected in the NEPS Data. Since the data is, nevertheless, not providing enough hints for a de- pression diagnosis, I use the mental health problem score that includes, among others, some of the typical symptoms.
In addition, the NEPS data contain estimates of students’ self-efficacy measured by the General Self-Efficacy (GSE) scale by Jerusalem and Schwarzer (1986). The GSE scale measures perceived competence to cope with stressful situations (Schwarzer et al., 1997).
The term self-efficacy goes back to Bandura (1977). There is evidence that high general self-efficacy is associated with less depression and anxiety (Schwarzer, 1994). As the NEPS survey is conducted in German, the German scale developed by Jerusalem and Schwarzer in 1981 is used.15It consists of ten questions, each on a four point Likert scale.
14 This paper uses data from the National Educational Panel Study (NEPS): G8 Reform Study in Baden- Wurttemberg, doi 10.5157/NEPS:BW:2.0.0. The NEPS data collection is part of the Framework Pro- gramme for the Promotion of Empirical Educational Research, funded by the German Federal Ministry of Education and Research and supported by the Federal States. (Blossfeld et al., 2011).
15 A link to the English scale: http://userpage.fu-berlin.de/∼health/
engscal.htm
The self-efficacy score from these ten items is obtained by adding up the answers leading to a score between 10 and 40. For Germany, the mean score is usually around 29 with a standard deviation of 4 (Schwarzer and Jerusalem, 1999). The ten items measure one underlying construct (Scholz et al., 2002), confirmed by a principal component analysis of the NEPS data.16 The NEPS sample mean deviates slightly from the reference mean (27.6 vs. 29), indicating a lower self-efficacy probably because students are facing their Abitur examinations in a few weeks time and therefore might feel less confident about themselves.
Table 1 summarizes the sample. A total of 2391 students in their final school year in 2011/2012 in Baden-Wurttemberg were sampled. Due to missing data, the analysis sam- ple has 2024 observations. As the sample was drawn at school-level, I use school dum- mies in all regressions to capture school-specific effects. Since errors are likely to corre- late within schools, school-clustered standard errors are reported.
The analysis sample contains 43.2% males and 56.8% females. This is a slightly higher share of females compared to 53% in higher secondary school in Baden-Wurttemberg as reported by the German federal statistical office (Statistisches Bundesamt, 2013, table 3.1). A part of this difference can be attributed to one all-girls school in the sample.
About 20% of the sampled students have a migration background in the sense that at least one of their parents was not born in Germany. About 5% repeated at least one grade, among these, 6% repeated more than one grade (7 individuals). Grade repetition does not vary between males and females. The sampled students in G9 are on average more than one year older than the G8 students. This might be attributed to the large share of grade repeaters among G9 students (9%) as compared to G8 students (1%). Even though age-deviation from the cohort mean and grade repetition are correlated with each other, variance-inflation measures do not hint towards a collinearity problem, when controlling for both in one model.
For further calculations, indexes for stress and mental health were constructed by adding the scores of the subitems and then standardizing the total score. 17 For students with more than one missing item within a scale, the index was set to missing. Since the data do not contain many missing items, the index of perceived stress has 13 students with missing values and the index on mental health problems has 23 students with missing values. For the general self-efficacy score, the same decision rule leads to 21 observations being dropped. Missing data on general life satisfaction and school satisfaction produce an additional 15 dropped observations. In total, 72 observations were dropped due to missing values on dependent variables, 295 observations were dropped due to missing information on explanatory variables. Consequently, the analyzed sample contains 2024 students.
The outcomes in table 1 are reported as scores to provide an easier interpretation of the results. The stress score is the average answer students have given on all 15 stress items.
In the sample the average stress score is 2.09 that means on average students answered all items with ”hardly true”. An increase (decrease) by standard deviation (.59), translated
16 Results are not reported, but available upon request.
17 The appendix provides a detailed list of the items contained in the indexes.
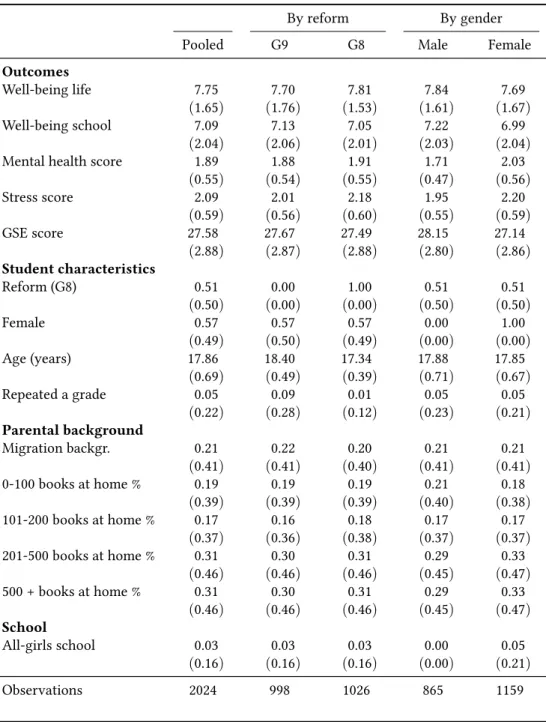
Table 1: Descriptive statistics by reform and by gender
By reform By gender
Pooled G9 G8 Male Female
Outcomes
Well-being life 7.75 7.70 7.81 7.84 7.69
(1.65) (1.76) (1.53) (1.61) (1.67)
Well-being school 7.09 7.13 7.05 7.22 6.99
(2.04) (2.06) (2.01) (2.03) (2.04)
Mental health score 1.89 1.88 1.91 1.71 2.03
(0.55) (0.54) (0.55) (0.47) (0.56)
Stress score 2.09 2.01 2.18 1.95 2.20
(0.59) (0.56) (0.60) (0.55) (0.59)
GSE score 27.58 27.67 27.49 28.15 27.14
(2.88) (2.87) (2.88) (2.80) (2.86) Student characteristics
Reform (G8) 0.51 0.00 1.00 0.51 0.51
(0.50) (0.00) (0.00) (0.50) (0.50)
Female 0.57 0.57 0.57 0.00 1.00
(0.49) (0.50) (0.49) (0.00) (0.00)
Age (years) 17.86 18.40 17.34 17.88 17.85
(0.69) (0.49) (0.39) (0.71) (0.67)
Repeated a grade 0.05 0.09 0.01 0.05 0.05
(0.22) (0.28) (0.12) (0.23) (0.21) Parental background
Migration backgr. 0.21 0.22 0.20 0.21 0.21
(0.41) (0.41) (0.40) (0.41) (0.41)
0-100 books at home % 0.19 0.19 0.19 0.21 0.18
(0.39) (0.39) (0.39) (0.40) (0.38)
101-200 books at home % 0.17 0.16 0.18 0.17 0.17
(0.37) (0.36) (0.38) (0.37) (0.37)
201-500 books at home % 0.31 0.30 0.31 0.29 0.33
(0.46) (0.46) (0.46) (0.45) (0.47)
500 + books at home % 0.31 0.30 0.31 0.29 0.33
(0.46) (0.46) (0.46) (0.45) (0.47) School
All-girls school 0.03 0.03 0.03 0.00 0.05
(0.16) (0.16) (0.16) (0.00) (0.21)
Observations 2024 998 1026 865 1159
Notes: Data: NEPS BW D 2-0-0, wave 2. Own calculations. Standard deviations in paren- theses. Well-being in life and school is identified on a Likert-type-scale from 1 to 10.
Mental health problem score is the mean of 26 symptoms (reported in table 9) on a scale from 1 (never occurred in the last 6 weeks) to 4 (symptom occurred more than 6 times in the last 6 weeks). Stress score is the mean of 15 symptoms (reported in table 7) on a range from 0 (not at all true) to 4 (exactly true). GSE score measures self-efficacy on a scale from 10 (low) to 40 (high), see table 8. Migration background is a dummy indi- cating whether at least one parent was not born in Germany.
into answers on the items, would mean that 8.9 of the 15 items were answered with a one point higher (lower) rating.
The average mental health score is 1.89 (on average most symptoms occurred once or twice in the last six weeks), with a standard deviation of .55. As 26 items count into the score, a one standard deviation increase in the score amounts to 14.3 items that increased by one point (i. e. from once or twice to three to six times in the last six weeks).
As indicated above, the GSE score (attained by adding all answers) in the sample 27.58 on average. The standard deviation of 2.88 therefore directly translates into 2.88 of the 10 items, that were answered differently by one category. As well-being in life and well- being in school are answers to single questions, the interpretation of results on them is straightforward.
5 How are students affected by the reform?
The introduction of G8 in Baden-Wurttemberg forms a natural experiment (Wagner et al., 2011, p. 243). As the data used in this study is purely cross-sectional, I provide estimates of the effects of the reform by estimation with OLS using school dummies and clustered standard errors to account for the nested structure of the data.
For each of the students in the last G9 cohort who graduated already in 2011 as part of the old fast track program, and therefore was sampled in the first wave of the Additional Study Baden-Wurttemberg, a student from the first G8 cohort (sampled in the second wave in 2012) is selected via nearest neighbor matching. An exclusion of these matched students from the sample results in marginal differences in effect sizes that do not change the significance levels.18
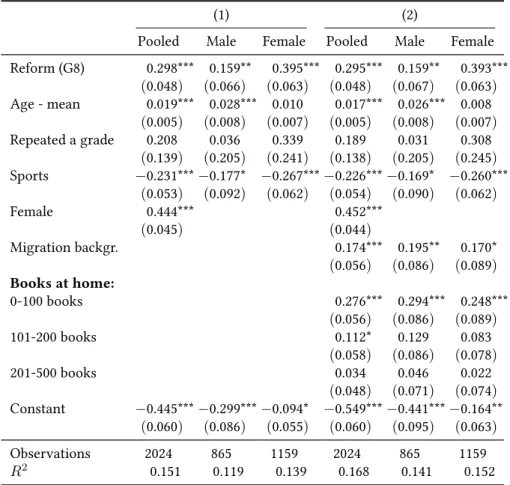
5.1 Stress
The results for the standardized measure of stress are reported in table 2. The reform increased stress levels in all models. In the pooled model, the reform effect amounts to 30% of a standard deviation, i. e. the average score increased by 0.17 (2.6 items increased by one category). Even absent the reform, females report stress symptoms significantly more often (see first column of table 2). The size of the effect seems to be partly driven by females who suffer more from the reform than males. In separate estimations, the treatment effect on the stress index is around 16% of a standard deviation (1.4 items) for males and around 40% of a standard deviation (3.5 items increased by 1) for females . Furthermore, older male students report higher stress levels, while being older than the mean student in the own cohort has no effect for female students. Students with a migration background report more stress symptoms. Students who do sports at least twice weekly report lower levels of stress and the effect is stronger for females than for males. A low socio-economic background, as proxied by amount of books at home,
18 All regressions conducted here were also calculated excluding the 40 matched students. Please refer to tables 10 - 14 in the appendix to see results without these students.
Table 2: Regressions on Stress
(1) (2)
Pooled Male Female Pooled Male Female Reform (G8) 0.298*** 0.159** 0.395*** 0.295*** 0.159** 0.393***
(0.048) (0.066) (0.063) (0.048) (0.067) (0.063) Age - mean 0.019*** 0.028*** 0.010 0.017*** 0.026*** 0.008
(0.005) (0.008) (0.007) (0.005) (0.008) (0.007) Repeated a grade 0.208 0.036 0.339 0.189 0.031 0.308
(0.139) (0.205) (0.241) (0.138) (0.205) (0.245) Sports −0.231***−0.177* −0.267***−0.226***−0.169* −0.260***
(0.053) (0.092) (0.062) (0.054) (0.090) (0.062)
Female 0.444*** 0.452***
(0.045) (0.044)
Migration backgr. 0.174*** 0.195** 0.170*
(0.056) (0.086) (0.089) Books at home:
0-100 books 0.276*** 0.294*** 0.248***
(0.056) (0.086) (0.089)
101-200 books 0.112* 0.129 0.083
(0.058) (0.086) (0.078)
201-500 books 0.034 0.046 0.022
(0.048) (0.071) (0.074) Constant −0.445***−0.299***−0.094* −0.549***−0.441***−0.164**
(0.060) (0.086) (0.055) (0.060) (0.095) (0.063)
Observations 2024 865 1159 2024 865 1159
R2 0.151 0.119 0.139 0.168 0.141 0.152
Notes: NEPS BW D 2-0-0 wave 2. OLS regressions. Age - mean = age in months - mean(students in own cohort). Books at home: reference category: ’more than 500’. All regressions contain school dummies. *p <0.1, **p <0.05, ***p <
0.01. Standard errors, clustered at school level, in parentheses.
is associated with higher stress levels, even though not all effects are significant in the separated models.
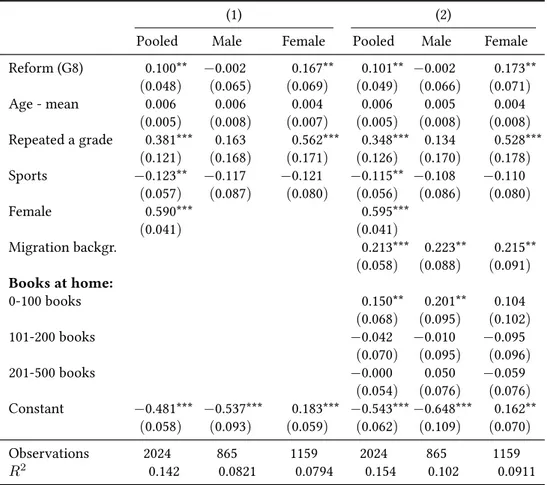
5.2 Mental health problems
The reform effects on the mental health index (table 3) deliver a more heterogeneous pic- ture. While there seems to be no increase in mental health problems over all students, the effect is quite substantial for females, even though only significant at the 5% level.
The reform effect for females is between 16 and 18% of a standard deviation (2.4 items increased by one). While age has no significant explanatory power, the coefficient of grade repetition for females is sizable and significant. Sports participation is beneficial to mental health in the pooled models, but not significant in subgroup estimations. Stu- dents with a migration background are over-proportionately affected by mental health problems. Having a working-class father is also associated with increased strains.
Table 3: Regressions on standardized mental health problem score
(1) (2)
Pooled Male Female Pooled Male Female
Reform (G8) 0.100** −0.002 0.167** 0.101** −0.002 0.173**
(0.048) (0.065) (0.069) (0.049) (0.066) (0.071)
Age - mean 0.006 0.006 0.004 0.006 0.005 0.004
(0.005) (0.008) (0.007) (0.005) (0.008) (0.008) Repeated a grade 0.381*** 0.163 0.562*** 0.348*** 0.134 0.528***
(0.121) (0.168) (0.171) (0.126) (0.170) (0.178) Sports −0.123** −0.117 −0.121 −0.115** −0.108 −0.110
(0.057) (0.087) (0.080) (0.056) (0.086) (0.080)
Female 0.590*** 0.595***
(0.041) (0.041)
Migration backgr. 0.213*** 0.223** 0.215**
(0.058) (0.088) (0.091) Books at home:
0-100 books 0.150** 0.201** 0.104
(0.068) (0.095) (0.102)
101-200 books −0.042 −0.010 −0.095
(0.070) (0.095) (0.096)
201-500 books −0.000 0.050 −0.059
(0.054) (0.076) (0.076) Constant −0.481*** −0.537*** 0.183*** −0.543***−0.648*** 0.162**
(0.058) (0.093) (0.059) (0.062) (0.109) (0.070)
Observations 2024 865 1159 2024 865 1159
R2 0.142 0.0821 0.0794 0.154 0.102 0.0911
Notes: NEPS BW D 2-0-0 wave 2. OLS regressions. Age - mean = age in months - mean(students in own cohort). Books at home: reference category: ’more than 500’.
All regressions contain school dummies. *p <0.1, **p <0.05, ***p <0.01. Standard errors, clustered at school level, in parentheses.
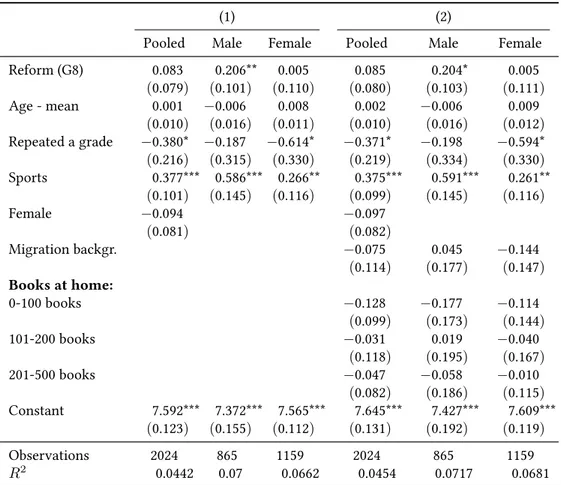
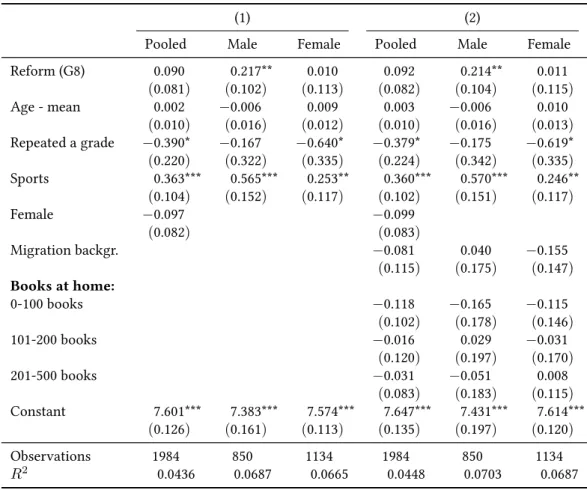
5.3 Subjective well-being
As table 4 shows, students’ satisfaction with life does not change significantly with the introduction of G8 in the pooled models. There is a positive effect of the reform on male student well-being. This result may be explained by the idea of general life satisfaction being a combination of several domain satisfactions (van Praag and Ferrer-i-Carbonell, 2011, ch. 6). If satisfaction with the situation in class decreases, the decrease might be outweighed by another effect: More time spent in school also means for most students that they spend more time with their friends in school and hence are more satisfied with their friendships. I am not able to test this assumption. Doing sports regularly increases well-being substantially, while previous grade repetition decreases it. There seems to be no heterogeneity due to socio-economic background.
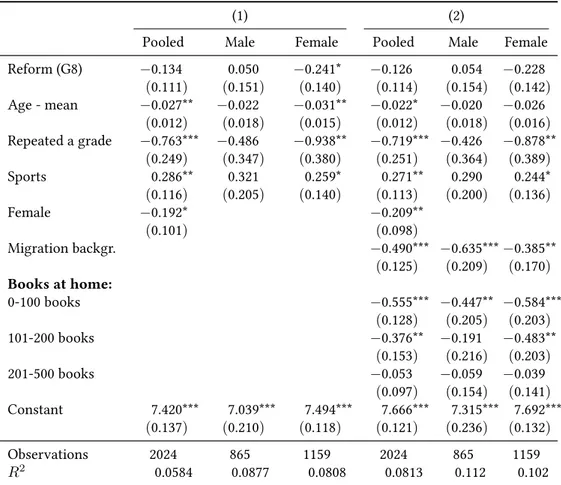
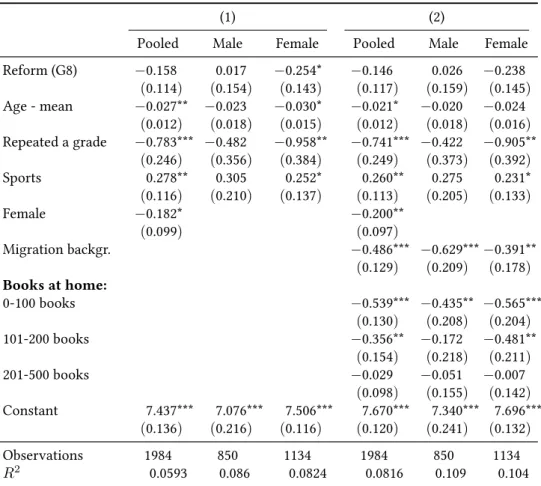
Well-being in school (table 5) does not significantly change with the reform in the pooled and in the male sample. For females, the reform effect is significantly negative at the 10%
level. When background variables are added, the effect loses significance. In two models, one pooled, one female, well-being in school is lower for students who are, compared
Table 4: Regressions on students’ general well-being
(1) (2)
Pooled Male Female Pooled Male Female
Reform (G8) 0.083 0.206** 0.005 0.085 0.204* 0.005
(0.079) (0.101) (0.110) (0.080) (0.103) (0.111)
Age - mean 0.001 −0.006 0.008 0.002 −0.006 0.009
(0.010) (0.016) (0.011) (0.010) (0.016) (0.012) Repeated a grade −0.380* −0.187 −0.614* −0.371* −0.198 −0.594*
(0.216) (0.315) (0.330) (0.219) (0.334) (0.330) Sports 0.377*** 0.586*** 0.266** 0.375*** 0.591*** 0.261**
(0.101) (0.145) (0.116) (0.099) (0.145) (0.116)
Female −0.094 −0.097
(0.081) (0.082)
Migration backgr. −0.075 0.045 −0.144
(0.114) (0.177) (0.147) Books at home:
0-100 books −0.128 −0.177 −0.114
(0.099) (0.173) (0.144)
101-200 books −0.031 0.019 −0.040
(0.118) (0.195) (0.167)
201-500 books −0.047 −0.058 −0.010
(0.082) (0.186) (0.115) Constant 7.592*** 7.372*** 7.565*** 7.645*** 7.427*** 7.609***
(0.123) (0.155) (0.112) (0.131) (0.192) (0.119)
Observations 2024 865 1159 2024 865 1159
R2 0.0442 0.07 0.0662 0.0454 0.0717 0.0681
Notes: NEPS BW D 2-0-0 wave 2. OLS regressions. Age - mean = age in months - mean(students in own cohort). Books at home: reference category: ’more than 500’. All regressions contain school dummies. Dependent variable: How satisfied are you cur- rently and in general terms, with your life? (11-point scale, translated by NEPS). *p <
0.1, **p <0.05, ***p <0.01. Standard errors, clustered at school level, in parentheses.
to their classmates, older and also lower for students with migration background. It decreases with measures of low socioeconomic background. Further, school satisfaction decreases substantially when a student has already repeated at least one grade, although the coefficients are only significant for the pooled sample and for females.
Overall, the data do not imply a negative effect of the reform on students’ well-being in school and life. Since school satisfaction did not decrease due to the reform, it seems plausible that general life satisfaction did also not decrease.
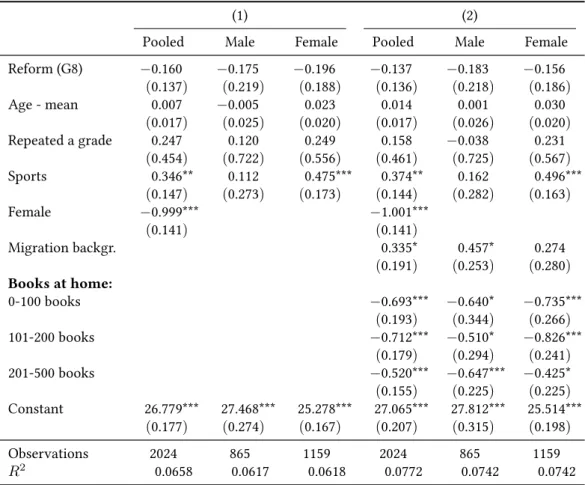
5.4 Self-efficacy
Table 6 shows that the general self-efficacy score is not affected by the reform. The general self-efficacy score for females is about 1 point lower, which corresponds to 35%
of a standard deviation and is therefore substantially different. Yet, the reform affects neither females nor males significantly. Sport has a significant effect for females, but not
Table 5: Regressions on students’ well-being in school
(1) (2)
Pooled Male Female Pooled Male Female
Reform (G8) −0.134 0.050 −0.241* −0.126 0.054 −0.228 (0.111) (0.151) (0.140) (0.114) (0.154) (0.142) Age - mean −0.027** −0.022 −0.031** −0.022* −0.020 −0.026
(0.012) (0.018) (0.015) (0.012) (0.018) (0.016) Repeated a grade −0.763*** −0.486 −0.938** −0.719*** −0.426 −0.878**
(0.249) (0.347) (0.380) (0.251) (0.364) (0.389)
Sports 0.286** 0.321 0.259* 0.271** 0.290 0.244*
(0.116) (0.205) (0.140) (0.113) (0.200) (0.136)
Female −0.192* −0.209**
(0.101) (0.098)
Migration backgr. −0.490*** −0.635***−0.385**
(0.125) (0.209) (0.170) Books at home:
0-100 books −0.555*** −0.447** −0.584***
(0.128) (0.205) (0.203)
101-200 books −0.376** −0.191 −0.483**
(0.153) (0.216) (0.203)
201-500 books −0.053 −0.059 −0.039
(0.097) (0.154) (0.141) Constant 7.420*** 7.039*** 7.494*** 7.666*** 7.315*** 7.692***
(0.137) (0.210) (0.118) (0.121) (0.236) (0.132)
Observations 2024 865 1159 2024 865 1159
R2 0.0584 0.0877 0.0808 0.0813 0.112 0.102
Notes: NEPS BW D 2-0-0 wave 2. OLS regressions. Age - mean = age in months - mean(students in own cohort). Books at home: reference category: ’more than 500’. All regressions contain school dummies. Dependent Variable: How satisfied are you with your situation at school? (11-point scale, translated by NEPS). *p <0.1, **p <0.05, ***
p <0.01. Standard errors, clustered at school level, in parentheses.
for males. Low socioeconomic background decreases self-efficacy. Notably, migration background can be associated with a higher GSE score. Overall, the reform most likely did not affect the general self-efficacy of students.
6 Discussion
While there seems to be evidence that the G8 reform had adverse effects on student men- tal health and perceived stress, well-being in school and life do not seem to be negatively affected by the reform.
Unfortunately, the NEPS-data do not allow for a long-run evaluation. This means that the effects found might be at least in part due to implementation problems of the reform and might level off over time. This possibility needs to be evaluated in a future analysis with different data. I also cannot rule out that I am purely measuring cohort effects, i. e.
that students in one year differ from their adjacent cohort. One problem arising when
Table 6: Regressions on general self-efficacy score
(1) (2)
Pooled Male Female Pooled Male Female
Reform (G8) −0.160 −0.175 −0.196 −0.137 −0.183 −0.156 (0.137) (0.219) (0.188) (0.136) (0.218) (0.186)
Age - mean 0.007 −0.005 0.023 0.014 0.001 0.030
(0.017) (0.025) (0.020) (0.017) (0.026) (0.020)
Repeated a grade 0.247 0.120 0.249 0.158 −0.038 0.231
(0.454) (0.722) (0.556) (0.461) (0.725) (0.567)
Sports 0.346** 0.112 0.475*** 0.374** 0.162 0.496***
(0.147) (0.273) (0.173) (0.144) (0.282) (0.163)
Female −0.999*** −1.001***
(0.141) (0.141)
Migration backgr. 0.335* 0.457* 0.274
(0.191) (0.253) (0.280) Books at home:
0-100 books −0.693*** −0.640* −0.735***
(0.193) (0.344) (0.266)
101-200 books −0.712*** −0.510* −0.826***
(0.179) (0.294) (0.241)
201-500 books −0.520*** −0.647*** −0.425*
(0.155) (0.225) (0.225) Constant 26.779*** 27.468*** 25.278*** 27.065*** 27.812*** 25.514***
(0.177) (0.274) (0.167) (0.207) (0.315) (0.198)
Observations 2024 865 1159 2024 865 1159
R2 0.0658 0.0617 0.0618 0.0772 0.0742 0.0742
Notes: NEPS BW D 2-0-0 wave 2. OLS regressions. Age - mean = age in months - mean(students in own cohort). Books at home: reference category: ’more than 500’. All regressions con- tain school dummies. *p <0.1, **p <0.05, ***p <0.01. Standard errors, clustered at school level, in parentheses.
examining the double cohort is that the first cohort of G8-students might suffer from the reform to a larger extent because they are directly compared to their G9 peers and have to compete with the G9 peers for limited resources after graduation (e. g. apprenticeships, volunteering activities, university places, student accommodation in university cities).
Selection bias might be an issue if the selection process from primary school into the different secondary school types changed due to the introduction of G8. Possibly, teacher recommendations after the introduction of G8 changed, because teachers were more aware of the required level of achievement in G8 schools. They might be looking more than before at the actual performance of students. It is not very likely that students skipped a year to stay in G9 or repeated a grade to study under the G8-regime.
The difference in many dimensions between girls and boys might also be due to the established fact that, for boys, preparation time goes down with increasing age, while it tends to go up for girls (B¨ohm-Kasper and Weishaupt, 2002, p. 481).
Another possible explanation might be that, according to an unpublished study by Huebener and Marcus (2014), the reform increased male grade repetition rates in the final two years
of school much more than female grade repetition rates. My results suggest that grade repetition is harmful to some outcomes. There might be an indirect effect at work here.
Furthermore, increased grade repetition in the penultimate year of schooling could mean that the sample of G8 students in this analysis is positively selected. However, in this case I would most likely underestimate the reform effects.
In total, the effects of the reform on student well-being remain heterogeneous with no reported decline in subjective well-being but a severe increase in perceived stress and mental health symptoms for females. To which extent these results are due to the special situation of the double cohort remains to be evaluated.
References
Altner, H. (2007). Naturwissenschaften im achtj¨ahrigen Gymnasium G8,Der mathema- tische und naturwissenschaftliche Unterricht,60(8), pp. 493–497.
Autorengruppe Bildungsberichterstattung (2010). Bildung in Deutschland 2010. Ein in- dikatorengest¨utzter Bericht mit einer Analyse zu Perspektiven des Bildungswesens im demografischen Wandel., Bielefeld: W. Bertelsmann.
Bandura, A. (1977). Self-efficacy: Toward a unifying theory of behavioral change,Psych- logical Review,84, pp. 191–215.
Bergm¨uller, S. (2007).Schulstress unter Jugendlichen: Entstehungsbedingungen, vermit- telnde Prozesse und Folgen ; eine empirische Studie im Rahmen von PISA 2003, Bd. 24, Schriftenreihe Studien zur Streßforschung, Hamburg: Kovaˇc.
Bilz, L. (2008). Schule und psychische Gesundheit: Risikobedingungen f¨ur emotionale Auff¨alligkeiten von Sch¨ulerinnen und Sch¨ulern, Wiesbaden: VS Verlag f¨ur Sozialwissen- schaften.
Blossfeld, H.-P., H.-G. Roßbach, and J. v. Maurice eds. (2011). Education as a life- long process: The German National Educational Panel Study (NEPS) Zeitschrift f¨ur Erziehungswissenschaft, 14, Wiesbaden: VS Verlag f¨ur Sozialwissenschaften.
B¨ohm-Kasper, O. and H. Weishaupt (2002). Belastung und Beanspruchung von Lehrern und Sch¨ulern am Gymnasium, Zeitschrift f¨ur Erziehungswissenschaft, 5 (3), pp. 472–
499, DOI:http://dx.doi.org/10.1007/s11618-002-0062-2.
Br¨utting, R. (2007). Drastische K¨urzung des Geschichtsunterrichts im achtj¨ahrigen Gym- nasium,Geschichte, Politik und ihre Didaktik,35(3-4), pp. 179–182.
B¨uttner, B. and S. Thomsen (2013). Are We Spending Too Many Years in School? Causal Evidence of the Impact of Shortening Secondary School Duration,German Economic Review, p. forthcoming, DOI:http://dx.doi.org/10.1111/geer.12038. Carneiro, P., C. Crawford, and A. Goodman (2007). The Impact of Early Cognitive
and Non-Cognitive Skills on Later Outcomes, URL:http://EconPapers.repec.
org/RePEc:cep:ceedps:0092.
Custodis, G. (2011). Bildung als Belastung? Macht die verk¨urzte Schulzeit am Gymna- sium die Sch¨uler krank?SchulVerwaltung Nordrhein-Westfalen,22(4), pp. 112–113.
Dahmann, S. and S. Anger (2014). The Impact of Education on Personality: Evidence from a German High School Reform,IZA Discussion Paper(8139).
Dam, H. (2005). Der neue Lehrplan f¨ur das verk¨urzte Gymnasium,Sch¨onberger Hefte,35 (4), pp. 14–17.
De Neve, J.-E. and A. Oswald (2012). Estimating the influence of life satisfaction and positive affect on later income using sibling fixed effects,Proceedings of the National Academy of Sciences,109 (49), pp. 19953–19958, DOI:http://dx.doi.org/10.
1073/pnas.1211437109.