Supplementary of “Solar impacts on decadal variability of tropopause tem- peratures and lower stratospheric water vapour: a mechanism through ocean- atmosphere coupling”
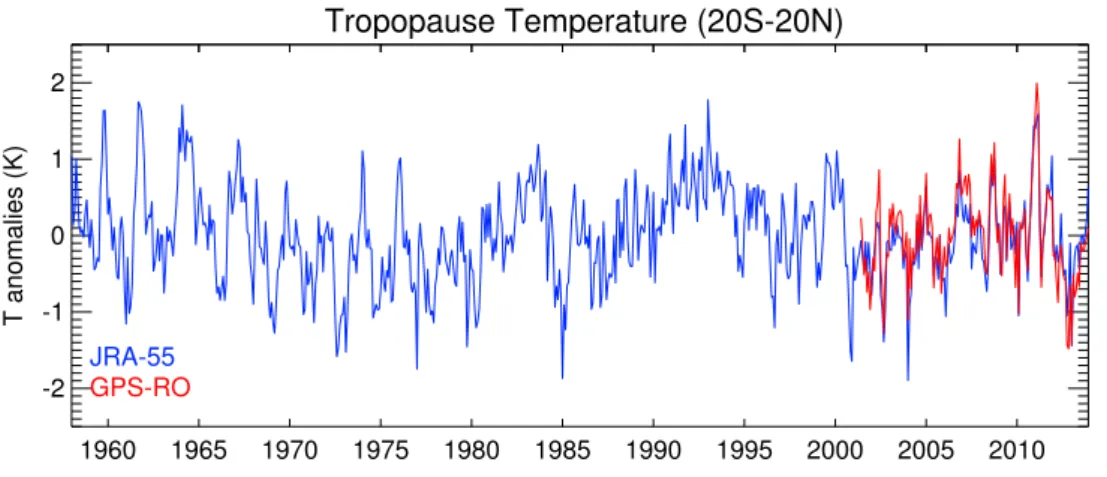
Tropopause Temperature (20S-20N)
1960 1965 1970 1975 1980 1985 1990 1995 2000 2005 2010 -2
-1 0 1 2
T anomalies (K)
JRA-55 GPS-RO
Figure S1: Deseasonalized anomalies of tropical (20°S-20°N) tropopause temperatures from the GPS-RO (red) and JRA-55 data (blue).
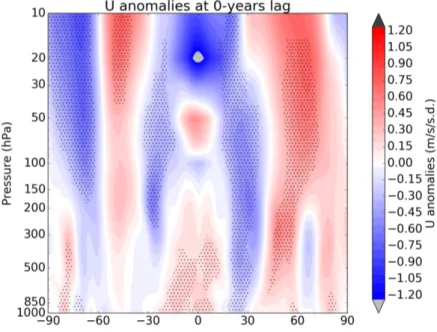
Figure S3: Latitude-height cross sections of solar regressed zonal wind anomalies av- eraged over the western Pacific (135°E-180°E) using the JRA-55 reanalysis (1979-2010). Areas over 90% statistically significance level are stippled. Au- tocorrelation effects has been excluded for the statistic test.
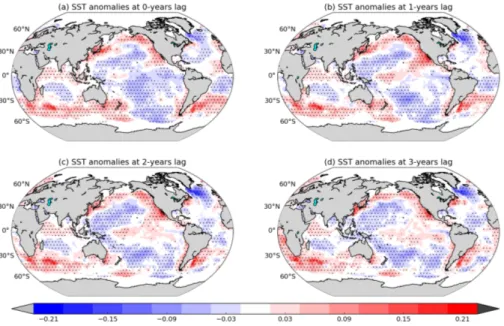
Figure S4: Same as Figs. 3a-3d, but for the period of 1900-2010 with SST anomalies only.
EMI
1900 1910 1920 1930 1940 1950 1960 1970 1980 1990 2000 2010 2
5 7 10 15 20 30 50
Period (years)
0.0 0.5 1.0 1.5 2.0 2.5 3.0 3.5 4.0 4.5 5.0 5.5 6.0
K2 0.0 0.5 1.0 1.5 2.0 2.5 3.0 3.5 4.0 4.5 5.0 5.5 6.0
1900 1910 1920 1930 1940 1950 1960 1970 1980 1990 2000 2010 2
5 7 10 15 20 30 50
Period (years)
EMI
95%
0 2 4
Power (K2) 2
5 7 10 15 20 30
50 95%
ENSO
1900 1910 1920 1930 1940 1950 1960 1970 1980 1990 2000 2010 2
5 7 10 15 20 30 50
Period (years)
0.0 0.5 1.0 1.5 2.0 2.5 3.0 3.5 4.0 4.5 5.0 5.5 6.0
K2 0.0 0.5 1.0 1.5 2.0 2.5 3.0 3.5 4.0 4.5 5.0 5.5 6.0
1900 1910 1920 1930 1940 1950 1960 1970 1980 1990 2000 2010 2
5 7 10 15 20 30 50
Period (years)
ENSO
0 2 4
Power (K2) 2
5 7 10 15 20 30
50 95%
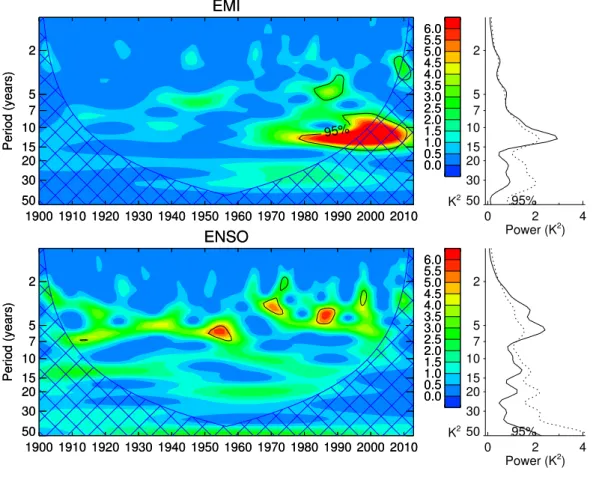
Figure S5: Wavelet analysis of observed top EMI and bottom ENSO for the period 1900-2014. leftPower spectrum for different periods. Areas over 95% statis- tically significance level are indicated by the black contour line. The cone of influence, where signals are less reliable due to edge effects is cross-hatched.
right Power spectrum averaged for the whole time with different periods.
The dotted line indicates the 90% level of confidence.