Look Before You Leap: Improving the Users’ Ability to Detect Fraud in Electronic Marketplaces
Johannes S¨anger
1, Norman H¨ansch
2, Brian Glass
3, Zinaida Benenson
2, Robert Landwirth
2, M. Angela Sasse
31
Department of Information Systems, University of Regensburg, Regensburg, Germany
2
IT Security Infrastructures Lab, University of Erlangen-Nuremberg, Erlangen, Germany
3
Department of Computer Science, University College London, London, UK johannes.saenger@ur.de,
{norman.haensch,zinaida.benenson,robert.landwirth
}@fau.de,
{
b.glass,a.sasse
}@ucl.ac.uk
ABSTRACT
Reputation systems in current electronic marketplaces can easily be manipulated by malicious sellers in order to appear more reputable than appropriate. We conducted a controlled experiment with 40 UK and 41 German participants on their ability to detect malicious behavior by means of an eBay- like feedback profile versus a novel interface involving an interactive visualization of reputation data. The results show that participants using the new interface could better detect and understand malicious behavior in three out of four attacks (the overall detection accuracy 77% in the new vs. 56% in the old interface). Moreover, with the new interface, only 7% of the users decided to buy from the malicious seller (the options being to buy from one of the available sellers or to abstain from buying), as opposed to 30% in the old interface condition.
ACM Classification Keywords
H.1.2 User/Machine Systems: Human Factors; K.4.4 Comput- ers and Society: Electronic Commerce—security
Author Keywords
trust; reputation systems; fraud detection; context-based attacks; visual analytics
INTRODUCTION
Electronic marketplaces have attracted millions of actors to trade their goods and services online in the last decades. How- ever, in most cases there is uncertainty about the behavior of strangers. How can a buyer know whether a product’s quality is as described, or whether a seller intends to act honestly?
For this reason, trust has become an important issue and a key factor for the success of such environments [30].
To establish trust, many modern e-commerce platforms en- courage buyers to provide feedback on the purchased products,
Permission to make digital or hard copies of all or part of this work for personal or classroom use is granted without fee provided that copies are not made or distributed for profit or commercial advantage and that copies bear this notice and the full citation on the first page. Copyrights for components of this work owned by others than ACM must be honored. Abstracting with credit is permitted. To copy otherwise, or republish, to post on servers or to redistribute to lists, requires prior specific permission and/or a fee. Request permissions from Permissions@acm.org.
CHI’16, May 07-12, 2016, San Jose, CA, USA 2016 ACM. ISBN 978-1-4503-3362-7/16/0515.00 DOI:htt p://dx.doi.org/10.1145/2858036.2858555
services, or sellers. Reputation systems [48] collect the cre- ated feedback, aggregate the information, and display it in a feedback profile. In this way, buyers can try to predict a seller’s future behavior based on the experiences of others.
Most reputation systems used in practice, however, suffer from a wide range of weaknesses [24, 35]. One common problem is the non-consideration of transaction context. A malicious seller could, for example, build high reputation by selling many cheap products while cheating on a few expen- sive ones. Exploiting this vulnerability, a Californian seller deceived victims for over US$300,000 [64]. Further examples for context-based attacks include a discriminative behavior for different products or time-frames [34]. A seller could, for in- stance, deliver high quality clothes but low quality electronics, or seasonally vary the quality of the goods.
To cope with this issue, many trust models that involve trans- action context in reputation assessment have been proposed in recent years [20, 47, 59, 39, 64]. Each of them designed a rather complex metric that provides one or several reputation values as output. These numerical values, however, are quite non-transparent to the end-user as they cannot convey any de- tailed information about the input data, leading to a cognitive gap [41, 21].
For that reason, S¨anger and Pernul [56] took a different path by designing an interactive visualization of reputation data using parallel coordinates [61]. They demonstrate that context-based attacks can be detected by analyzing real-life data from eBay.
So far, however, the ability of an interactive visualization approach to facilitate the detection of malicious seller behavior by end-users has not been experimentally verified.
We report a controlled between subjects experiment that ex- plored participants’ ability to detect and understand malicious seller behavior in an eBay-like electronic marketplace. First, we present the background on online trust and reputation, attacks on reputation systems, visual analytics of seller reputa- tion, and relevant user studies. We then present our study in- volving four tasks in which participants decided from which of two presented sellers to buy a product. We modeled the tasks in such a way that one of the two sellers was “malicious” while
the other one was “honest”1. The treatment group used a feed- back profile that includes an interactive parallel coordinates visualization, whereas the control group used an eBay-like interface. The results show that the participants using the new interface were better able to detect and understand malicious seller behavior. Particularly, users with low experience could notably benefit from the advanced presentation and further interaction possibilities. Their detection ability was signifi- cantly better than that of the comparable users in the control group. Using the old eBay-like interface, participants with low experience were not able to detect the malicious seller in three of the four cases. In the fourth case, the effect for the low experience users was reversed. The users with higher eBay experience consistently performed better with the new interface in all cases. We conclude with a discussion of our results, limitations of the present study, and future work.
To the best of our knowledge, this is the first study that ex- plored the users’ ability to detect attacks on reputation systems.
As the robustness of reputation systems is a topical issue in research on trust management as well as in practice, our work provides a promising perspective on an alternative approach of how this problem could be addressed.
BACKGROUND
Online Trust and Reputation Systems
Due to its high importance for social interactions, the nature and concept of trust have been studied in different research fields for many decades [40, 54, 52]. In the context of online trust and reputation systems, two notions of trust, namelyrelia- bility trustanddecision trust, can be distinguished. According to Jøsang et. al [30], the common definition of trust proposed by Gambetta [18] refers to reliability trust: “the subjective probability with which an agent assesses that another agent will perform a particular action in a context in which it affects his own action”.
Having high reliability trust, however, might not necessarily lead to a positive decision (e.g., to buy or to bid). For instance, if the financial loss in case of a failure is perceived as very high, an actor might not accomplish a transaction despite of high reliability trust. To involve this issue, McKnight & Chervany [43] proposed an alternative definition that is referred to as decision trust [30]:“the extent to which one party is willing to depend on something or somebody in a given situation with a feeling of relative security, even though negative consequences are possible”. We refer to these two types of trust later when presenting our results.
Reliability trust is often based on reputation [52, 2].
Reputation-based trust is derived from past interaction experi- ences, behavior, or performance of an entity that are combined to assess its future behavior. It can therefore be considered as a collective measure of trustworthiness [30]. As the number of actors involved in typical electronic marketplaces may be
1Themaliciousseller shows a discriminative behavior for one of the context attributes (e.g., low quality for high price items), while the honestseller acts consistently in every context. Note that in practice, a malicious actor might not always intentionally attack the system, but could also accidentally profit.
in the order of millions, manually determining reputation of an actor becomes difficult. For this reason, reputation sys- tems [48] have become popular tools. They encourage users to rate other users after transactions, automatically collect the created feedback, aggregate the ratings, and provide one or several reputation values as output in the feedback profiles of the users.2
Empirical evidence confirms positive effects of reputation systems in online environments. Thus, Ba and Pavlou [4]
or Resnick et al. [51] demonstrate that sellers with higher reputation have an increased number of sales to higher prices.
Diekmann et al. [16] confirm these findings by analyzing a very large dataset of eBay transactions. These effects offer an incentive for attackers to unfairly increase their reputation.
Robustness and Context-based Attacks
Ever since reputation systems have been used in online envi- ronments, malicious actors tried to exploit their weaknesses [15, 34, 29]. Thus, therobustnessof reputation systems has become an important issue. In case of an attack, a robust reputation system should provide a higher reputation value for an honest actor compared to the malicious actor.
Typical examples for attacks on reputation systems can be classified as unfair rating attacks, identity-based attacks, and inconsistent behavior [35]. In this work, we focus on inconsis- tent behavior in the form of context-based attacks. Although neglected in the trust research community for a long time, transaction context has been recognized to play an impor- tant role for trust assessment today [56, 31]. Transactions in electronic marketplaces involve different prices, products, or payment types. If these context attributes are not considered in reputation assessment, malicious actors may profit from a discriminative behavior regarding single context attributes.
An attacker could, for example, build high reputation selling many cheap items while cheating on the expensive ones. This so-calledvalue imbalance problemcould be demonstrated in several real-life cases [53]. A further relevant example is dis- criminative behavior for different product types, meaning that a seller could deliver different products in different qualities.
To cope with this issues, numerous trust models that involve transaction context in reputation assessment have been intro- duced in recent years [20, 47, 59, 39, 64]. These advanced models are indeed more robust against context-based attacks.
However, they only provide final numerical reputation values based on rather complex computational metrics, and do not discuss a user-friendly presentation of the results. Numerical values as the only output cannot convey detailed information about the input data (e.g., which reviews were considered, which not? To what extent do single reviews affect the final reputation value?), thus being highly non-transparent for the end-users. In a recent article [41], the pioneer of computa- tional trust Stephen Marsh [40] and his colleagues express this
2Here, we consider eBay-like reputation systems that should not be confused with recommender systems, also called collaborative filter- ing systems [49]. According to Josang et al. [30], whereas reputation systems assume that all users judge the performance of transaction partners consistently, recommender systems assume that the users have different tastes and rate items or people subjectively [10].
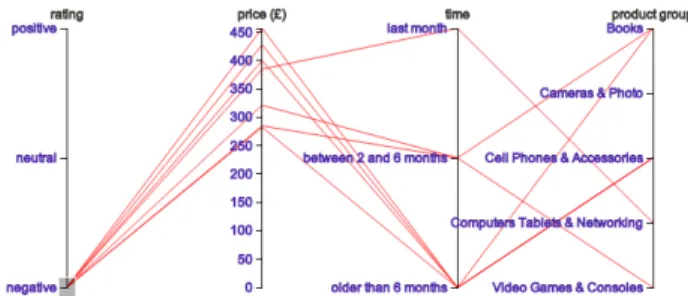
(a) Example parallel coordinates visualization for reviews in an eBay-like electronic marketplace
(b) Example parallel coordinates visualization for reviews in an eBay-like electronic marketplace with negative ratings highlighted
Figure 1: Example interactive parallel coordinates visualization
problem as follows: “We can happily accept that models of complex phenomena must in themselves be inherently complex, but we do not accept that models should be so complex as to be [...] beyond the understanding of the very people that are intended to use them.”
Low transparency of reputation calculations furthermore leads to a cognitive gap as the outcome of the sensemaking process, since the end users cannot get an accurate enough picture of the overall situation.
Sensemaking and Visual Analytics of Seller Reputation According to the seminal work by Russel et al. [55], problems that require processing of large amounts of information in- volvesensemaking, which is the process of searching for the representation and encoding of the retrieved information. They argue that“representation design is central to the sensemak- ing enterprise”, and that novel types of external information representations“can dramatically change the efficiency or effectiveness of the overall process”.
An example of external information representation is visual analytics that combines automated analyses conducted by the computer with interactive visualizations. Incorporating the visual-cognitive capabilities of a human analyst and the com- puting power of a machine provides a powerful approach for an effective understanding, reasoning and decision making [32, 22]. Visual analytics of sellers’ reputation data has rarely been considered in research so far. Shmueli et al. [58] propose a system for interactive visualization of auction data using time series to assist decision making by sellers, bidders and auction sites. However, they do not evaluate their system by means of user studies. In recommender systems, interactive visualization is considered more often, albeit not from the fraud detection perspective [63, 38].
To involve transaction context in reputation assessment and thereby address context-based attacks, S¨anger and Pernul [56]
designed an interactive parallel coordinates visualization for reputation data that allows the users conduct explorative data analysis. In this work, we experimentally evaluate the effec- tiveness and efficiency of their system.
Parallel coordinates [26, 27] is a visualization technique that is especially suitable for giving an overview of data ranges
and revealing correlations within multivariate data [23, 28].
Opposed to most icon-based or pixel-oriented techniques that are better suited for continuous data, and stacked display tech- niques that are particularly appropriate for data arranged in a hierarchy, parallel coordinates as a subclass of geometrically transformed displays is well-suited for both discrete and con- tinuous data [33]. Using parallel coordinates, thenattributes of a dataset are projected to a 2-dimensional visualization space by laying outnaxes in parallel side by side. Figure 1a shows an example of reputation visualization. Each review (tuple) contains a rating (negative, neutral, or positive), the price of the item, the time-frame when the review was created as well as the product category. The color of the polylines is determined by the rating. Each colored polyline depicts one tuple of the data-set. By displaying the feedback using polylines, the visualization can initially give an overview of all reviews and provide a starting point for further analyses.
To focus on single value ranges, the user can interact with the visualization by selecting or “brushing” parts of the axes. In this way, correlations between single attributes can be revealed.
Figure 1b, for instance, shows a strong correlation between negative ratings and high prices when highlighting negative ratings. While the effectiveness of parallel coordinates in revealing relations between data can depend on order of axes, both coloring the polylines depending on rating value and user interaction help to mitigate this effect, as the relation of negative ratings to all other parameters provides the most interesting information [56].
Related User studies
A large body of work about the value of sellers’ reputation in electronic marketplaces was previously conducted without directly involving users by mining the available reputation feedback data [50, 4, 44, 25, 46, 19, 16]. These works do not consider fraud detection by the users.
To the best of our knowledge, user studies conducted so far also do not consider attack detection. Thus, Ba and Pavlou [4]
conduct an online field experiment to quantify the effect of reputation feedback on perceived trustworthiness and bidding prices, whereas Resnick et al. [51] conduct a controlled field experiment on eBay to determine the effect of established versus new seller identity on the willingness to buy.
Bolton et al. [9] and Masclet and Penard [42] use trust games to determine the effect of reputation feedback on the efficiency of transactions. Bente et al. [7] consider the influence of sellers’ reputation and photos on trust level and number of purchases in a trust game. Trust games have a potential for discovering users’ ability to uncover context-based attacks, as the buyers are usually presented with the transaction history of the sellers. However, the authors of the above studies do not comment on this issue.
Finally, two recent exploratory studies uncover the poor un- derstanding of reputation values by the users, which provides us with the motivation for employing visual analytics. In an exploratory online survey by Alnemr and Meinel [1] with 200 participants, 50% of users reported the reputation values to be a measure of customer service, whereas 39% of users in- terpreted them as a measure of price-performance ratio of a product. 60% of the respondents preferred a more detailed representation of reputation values split by the price, delivery, and quality of the product. In a trust game based compara- tive study of two reputation metrics by Hammer et al. [21]
with 42 users, the participants did not exhibit high level of trust into the provided reputation values and criticized the lack of transparency of both rating systems in the post-game interviews.
Overall, most empirical work so far has been concerned with the elements of the marketplace design that instill trust and/or promote price premiums for trustworthy sellers. We provide the first study that investigates users’ ability to detect fraud using an eBay-like reputation feedback interface, and also verify the effectiveness of a novel interactive visualization interface for this task.
A further user study by Azhar and Rissanen [3] that is relevant in the context of this work evaluates the effectiveness and efficiency of a parallel coordinates visualization for interac- tive alarm filtering in a within-subjects controlled experiment with 12 users. Using parallel coordinates, the participants performed alarm filtering tasks significantly more efficiently.
Also the error rate decreased, although the authors do not com- ment on the significance of the latter improvement. While this study provides evidence that parallel coordinates can suc- cessfully be used in a professional context, the usage of our system focuses on laypersons and does not consider explicitly formulated filtering tasks.
Research Aims
In this work, we analyze the actual benefits (and potential costs) of interactive visualizations of reputation data for end- users. To this end, we modelled four cases in which the par- ticipants had to distinguish between “honest” and “malicious”
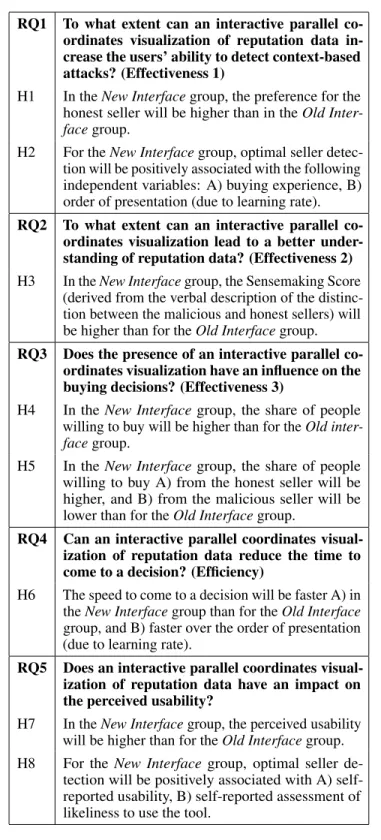
sellers in a transaction-specific context using either a tradi- tional eBay-like feedback profile interface or a “new” feedback profile interface including the interactive parallel coordinates visualization. We thereby address the effectiveness, efficiency, and usability of such systems. Table 1 gives an overview of the research questions as well as of the hypotheses.
RQ1 To what extent can an interactive parallel co- ordinates visualization of reputation data in- crease the users’ ability to detect context-based attacks? (Effectiveness 1)
H1 In theNew Interfacegroup, the preference for the honest seller will be higher than in theOld Inter- facegroup.
H2 For theNew Interfacegroup, optimal seller detec- tion will be positively associated with the following independent variables: A) buying experience, B) order of presentation (due to learning rate).
RQ2 To what extent can an interactive parallel co- ordinates visualization lead to a better under- standing of reputation data? (Effectiveness 2) H3 In theNew Interfacegroup, the Sensemaking Score
(derived from the verbal description of the distinc- tion between the malicious and honest sellers) will be higher than for theOld Interfacegroup.
RQ3 Does the presence of an interactive parallel co- ordinates visualization have an influence on the buying decisions? (Effectiveness 3)
H4 In theNew Interfacegroup, the share of people willing to buy will be higher than for theOld inter- facegroup.
H5 In theNew Interfacegroup, the share of people willing to buy A) from the honest seller will be higher, and B) from the malicious seller will be lower than for theOld Interfacegroup.
RQ4 Can an interactive parallel coordinates visual- ization of reputation data reduce the time to come to a decision? (Efficiency)
H6 The speed to come to a decision will be faster A) in theNew Interfacegroup than for theOld Interface group, and B) faster over the order of presentation (due to learning rate).
RQ5 Does an interactive parallel coordinates visual- ization of reputation data have an impact on the perceived usability?
H7 In theNew Interfacegroup, the perceived usability will be higher than for theOld Interfacegroup.
H8 For the New Interfacegroup, optimal seller de- tection will be positively associated with A) self- reported usability, B) self-reported assessment of likeliness to use the tool.
Table 1: Research questions and corresponding hypotheses
METHOD Design
The study consisted of a between subjects (interface) manip- ulation and a within subjects (four usage cases) contrast. To analyze the participants’ ability to distinguish between “hon-
est” and “malicious” sellers, we set up four cases in which the participants were given the task to buy a specific item (e.g.,
“Apple iPhone 5”). This item was offered by two sellers for the same fixed price (e.g., “£256.50”). For each case, items from distinct product categories and various prices were cho- sen to represent a broad range. Considering fixed price sales is consistent with their dominance over the auction sales on eBay in the last years [17]. As both bargains and overpriced items could lead to a bias in the willingness to trust or buy, we analyzed the completed listings of the local eBay sites over the last three months prior to each study3and calculated the median value for the study products.
The participants had to compare the feedback profiles of two sellers in each case. In order to provide realistic feedback profiles, we acquired real-life profiles from eBay and adapted them, following the modelling approach by Zhang et al. [64].
The eBay feedback profiles refer to the transaction-specific context involving the three context attributes price, product category, and time. In each case, profiles of both sellers were adapted in such a way that they had a comparable number of positive, neutral and negative ratings. However, one of the sellers (referred to as the malicious seller) showed a discrimi- native behavior for one context attribute, while the other seller (referred to as the honest seller) behaved consistently with respect to the entire transaction context.
All feedback profiles contained a large number of reviews (between 79 and 572 reviews), the overall number of reviews being higher for the malicious seller. In each case, the honest seller had the same or a slightly lower (0.1-0.5%) share of positive ratings than the malicious seller, as also in real-life situations malicious sellers usually try to look “better” than the honest ones. Overall, both seller profiles look quite alike to avoid priming the users for fraud detection.
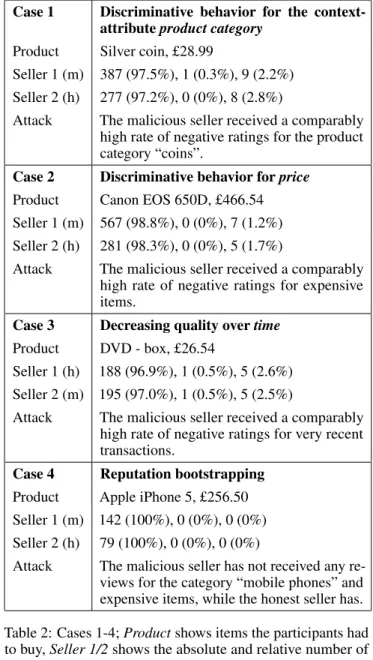
We modelled four cases (Table 2), one case for each of the three context attributes and a fourth case for the reputation bootstrapping problem that refers to the future behavior of newcomers. In Case 1, the malicious seller offers different products in different qualities, receiving a high rate of negative ratings for the low quality product group. Case 2 represents the value imbalance problem, where the malicious seller builds high reputation selling cheap items, but then cheats on the expensive ones [34]. Case 3 depicts the issue of decreasing quality over time, where the malicious seller receives negative ratings for very recent transactions [24]. Case 4 represents the reputation bootstrapping problem with regard to the current transaction, where the malicious seller has never sold a product in the current price range and product category [62].
Stimuli
We implemented two versions of the feedback profile inter- face - one that includes the parallel coordinates visualization for the treatment group (Fig. 2a) and a classical eBay-like feedback profile for the control group (Fig. 2b). Unlike eBay, we added the product category to each review. Thus, in both
3eBay.co.uk for UK from 22.02.2015 to 22.05.2015 and eBay.de for Germany from 07.04.2015 to 07.07.2015
Case 1 Discriminative behavior for the context- attributeproduct category
Product Silver coin, £28.99
Seller 1 (m) 387 (97.5%), 1 (0.3%), 9 (2.2%) Seller 2 (h) 277 (97.2%), 0 (0%), 8 (2.8%)
Attack The malicious seller received a comparably high rate of negative ratings for the product category “coins”.
Case 2 Discriminative behavior forprice Product Canon EOS 650D, £466.54 Seller 1 (m) 567 (98.8%), 0 (0%), 7 (1.2%) Seller 2 (h) 281 (98.3%), 0 (0%), 5 (1.7%)
Attack The malicious seller received a comparably high rate of negative ratings for expensive items.
Case 3 Decreasing quality overtime Product DVD - box, £26.54
Seller 1 (h) 188 (96.9%), 1 (0.5%), 5 (2.6%) Seller 2 (m) 195 (97.0%), 1 (0.5%), 5 (2.5%)
Attack The malicious seller received a comparably high rate of negative ratings for very recent transactions.
Case 4 Reputation bootstrapping Product Apple iPhone 5, £256.50 Seller 1 (m) 142 (100%), 0 (0%), 0 (0%) Seller 2 (h) 79 (100%), 0 (0%), 0 (0%)
Attack The malicious seller has not received any re- views for the category “mobile phones” and expensive items, while the honest seller has.
Table 2: Cases 1-4;Productshows items the participants had to buy,Seller 1/2shows the absolute and relative number of positive, neutral and negative ratings for the honest (h) and the malicious (m) seller andAttackshortly describes the situation
interfaces exactly the same data are displayed (rating, prod- uct name, category, price, time and reviews), and only the interactions are different. While the treatment group could focus on relations between highlighted attributes and on corre- sponding reviews, the control group could click on number of positive/neutral/negative reviews for specific time-frames to view corresponding reviews (exactly as in eBay). Data types were also left exactly as in eBay: rating and time are ordinal, price is continuous, product category is nominal.
In both interfaces, the participants could switch between the two seller profiles for each case using two buttons. The web- sites were implemented using HTML, CSS, and JavaScript
(a) Screenshot of the “new” reputation profile interface including the inter- active parallel coordinates visualization for the treatment group
(b) Screenshot of the eBay-like reputation profile interface for the control group
Figure 2: Screenshots of the feedback profile interfaces for both groups4
with the d3.js-library [11]. Participants completed the study using a Chrome browser running on a PC computer.
Materials
Pre-study questionnaire
The pre-study questionnaire involved 13 questions. The first three questions addressed the age, gender and occupation. The following nine questions referred to the participants’ experi- ence with online auction website like eBay both as a buyer and a seller.
Case questionnaires
For each of the four cases, we created a task description that included all details of the product (picture, exact title, price, shipping time and condition) which the participants had to consider buying, as well as the instruction to compare the two seller reputation profiles on the screen. Having compared the profiles, they had to answer five questions: In question 1 the participants had to choose which of both sellers they’d prefer for that specific item on a 5 point Likert scale (RQ1). Fur- thermore they were asked to write down why they made this decision (RQ2). This is particularly important for the analysis of the sensemaking process as they could have selected the honest seller for the wrong reasons. Thirdly they were asked if they would “buy from one or both sellers” or “look for a different seller” and describe why they made this decision (RQ3). The distinction between preference and willingness to buy refers to the difference betweenreliability trustand
4Figure 2a contains the German words “angezeigt werden” instead of the English equivalent “shown”. This error occurred when the UI was translated from German (first build) into English for the initial UK- based usability study. However, none of the UK usability testers, UK pre-testers or UK main study users reported noticing. Also there were no significant differences in the results between UK and Germany.
decision trust, since having a preference for one seller might not necessarily lead to a buying decision.
Post-study questionnaire
The post-study questionnaire contained the 10-item System Usability Scale (SUS) [12, 37] in order to assess self-reported usability of the interfaces for both the control and treatment group (RQ5). Additionally, after completing the SUS, the participants in the treatment group were asked to rate four further items to assess the new visualization interface. The first item concerned the intention to use the new visualization in the future, while the two next items asked about perceived usefulness of the new visualization for enhancing the buying experience and for determining the seller’s trustworthiness, re- spectively. These items were adopted from the research stream on technology acceptance modeling [14, 60]. Finally, the users were asked to directly estimate the cost-benefit relation of the new visualization by rating the item ”I find that the benefits of using the system are bigger than the effort of using it” [6].
Initial Usability Study
Prior to the main study, we conducted a usability evaluation of the parallel coordinates visualization with 10 UK participants at the University College London (UCL) using the “discount usability techniques” by Nielsen [45]. We combined user and task observation with the simplified thinking aloud. Our goal was not to create a product with the best possible usability, but to achieve a usability level that is suitable for the main study. In particular, the goals were that the users (1) can start using the system after a short explanation, (2) do not need to remember a lot about the interaction possibilities and (3) avoid critical mistakes such as solving a simple task wrongly due to the UI design.
We documented all slips and mistakes during the trials and improved the design accordingly. For example, some users tried to click on a non-clickable part of the interface, or did not notice that some other interface elements were in fact clickable, or found some labels too small. We also tested the interview guide and the pre- and post-study questionnaires for the main study. The cases used in the usability study were later used in the main study with slight improvements.
Main Study
The main study was first conducted at UCL in the UK and then at Friedrich-Alexander University Erlangen-N¨urnberg (FAU) in Germany. All study materials were translated into German by two native speakers independently, and discussed to resolve disagreements. While we are not aware of any empirically validated translations of the SUS into German, we used the translation by the SAP User Experience Community [13]5. The study was pre-tested in both languages with five UK and five German participants.
Participants
Participants were recruited using a standardized participant recruitment website, internal flyering, and internal mailing lists. 40 UK and 41 German participants with and without prior eBay experience [57] were randomly assigned to either the treatment group (n= 40), or the control group (n= 41). The age of the participants ranged from 18 to 41 years (Median= 24,SD= 4.5), and 35 were female. The study was approved by UCL’s ethics review board and by FAU’s data protection office, and all participants provided the required informed consent.
Procedure
The study took place in usability labs at both universities, and lasted 50 minutes on average. To avoid priming the partici- pants for fraud detection, they were asked to assist in a “usabil- ity test of online marketplace features”. The study involved three major phases. In the pre-study phase, the participants filled in the pre-study questionnaire and answered some initial questions regarding their experience with online marketplaces.
In the second phase, participants watched a short video that introduced the structure and functionality of the particular feedback profile interface. After providing a brief explanation of the overall procedure, the experimenter handed out the first case questionnaire. The sequence of the four cases was randomized to measure overall learning effects. The answer to each case questionnaire involved three sub-steps: (1) The participants read the task description (which product they need to buy) and compared the two feedback profiles of the sellers offering their item on the screen. (2) The participants answered the five case-related questions about their decision to buy in written form. (3) When they finished writing, the experimenter asked them to orally describe why they made their decisions.
In the third phase, the participants filled in the SUS question- naire. The treatment group then answered further questions on the usage of the new interface. At the end of the study, participants were fully debriefed. All participants were paid
£7 / 10efor their time.
5The exact explanation of the translation methodology can be found on the corresponding website [13].
RESULTS
Online Auction Buying Experience
Participants reported their lifetime total purchases made on online auction websites. Responses ranged from 0 to 300 (Mean= 38.24,Median= 15,SD= 54.0). The median cutoff score was used to categorize participants as Lower-Experience or Higher-Experience. In line with prior research [8], females reported more purchases (Mean= 53.2,SD= 65.5) than males (Mean= 26.8, SD = 40.4),t = 2.23, p = 0.03. Also, the German group reported more purchases (Mean= 55.1,SD= 62.5) than the UK group (Mean= 21.0,SD= 37.1),t= 2.97, p<0.01, which is consistent with 24 German participants being female as compared to 11 UK participants. While we believe prior experience to be a greater predictor of behavior, future work may consider gender and cultural differences.
RQ1 - Detection of Malicious Sellers (Reliability Trust) All Participants
For each case, participants reported a preference for Seller 1 or Seller 2 on a 5-point Likert scale (with 3 representing no preference between the two sellers). The scale was recoded to -2 (malicious seller) to +2 (honest seller). A 2 (Condition: Old, New Interface)×4 (Case: DVD, Phone, Coin, Camera) re- peated measures ANOVA was conducted on seller preference.
There was a significant main effect of Condition (F1,79= 14.84, p<0.001,η2= 0.16) such that those with the New Interface had a stronger preference for the honest seller (supporting RQ1-H1). There was a significant main effect of Case (F3,237
= 9.05,p<0.001,η2= 0.10) as well as a Case×Condition interaction (F3,237= 9.45, p<0.001,η2= 0.11). Post-hoc t-tests (Fig. 3b) show that those in the New Interface condition had a stronger preference for the honest seller relative to the Old Interface condition for the Phone, Coin, and Camera cases.
For the DVD case, those in the Old Interface condition had a stronger preference for the honest seller.
Accuracy in detecting the malicious seller was 56% in the Old Interface condition and 77% in the New Interface condition, representing a significant difference in detection rate,χ2(2, N=324)=16.44,p<0.001.
Considering Online Auction Buying Experience
The above detection analysis was repeated using buying expe- rience as an additional independent factor. There was a signif- icant main effect of Condition (F1,77= 12.94,p= 0.003,η2
= 0.14) such that those with the New Interface had a stronger preference for the honest seller. Importantly, there was a Case
×Condition ×Experience interaction (F3,231 = 4.23, p = 0.006,η2= 0.05). Post-hoct-tests (Fig. 3c & 3d) determine that, in general, those with Lower experience were better able to make use of the New Interface (except for the reverse find- ing for the DVD case). For those with Higher experience, there was overall better detection performance (supporting RQ1-H2A), although post-hoct-tests reveal that this was not driven by a single Case type. There were also significant main effects of Case, Condition, and Experience (allFs>9.51) as well as a Case×Condition interaction (F3,231= 9.38,p<
0.001,η2= 0.11).
(a) Sensemaking Score for each Case, for the New and Old Interface Conditions.
(b) All participants: Preference for either the honest seller (positive values) or the malicious seller (negative values) for each of the four Cases, as well as the overall mean value
(c) Participants with higher eBay experience: Preference for either the honest seller (positive values) or the malicious seller (negative values) for each of the four Cases, as well as the overall mean value
(d) Participants with lower eBay experience: Preference for either the honest seller (positive values) or the malicious seller (negative values) for each of the four Cases, as well as the overall mean value
Figure 3: Results for Research Questions 1-3.
To assess learning over the four Cases, the repeated measures ANOVA was conducted on seller preference and order. No main effects nor interactions involving order were statistically significant (allFs<1.3), not supporting RQ1-H2B.
RQ2 - Sensemaking and Understanding
For each case, participants provided a written and oral account of the reasoning behind their decision. After data collection, in- dependent raters determined whether these accounts contained a priori specified criteria for noticing that one seller is mali- cious and the other honest. For example, for the mobile phone, these criteria were: “Both sellers have 100% positive feed- back”, “Seller 1 has no feedback for mobile phones”, “Seller 1 has no feedback for specified price range, mostly sold cheap items (clothes)”, “Seller 2 has positive reviews for mobile phones”, and “Seller 2 sold many technical items”. For each fact, raters scored 0 (not mentioned), 1 (partially mentioned), or 2 (entirely mentioned). Cohen’s Kappa was computed as a measure of inter-rater reliability. For the German group, Kappaobserved= 0.65,Kappamax= 0.94,p<0.001. For the English group,Kappaobserved = 0.62,Kappamax= 0.72,p<
0.001. These are deemed to be of “substantial agreement”
by accepted benchmarks [36], thus the ratings were averaged between the two independent raters.
A “Sensemaking Score” was computed by summing the fact ratings for each case, divided by the total possible fact ratings.
Thus, scores ranged from 0 to 1. Overall, Sensemaking Score was higher in the New Interface condition (Mean= 0.36,SD
= 0.14) than the Old Interface condition (Mean= 0.25,SD= 0.13),t= 3.80,p<0.001.
A 2 (Interface Condition)×4 (Case)×2 (Buyer Experience) repeated measures ANOVA was conducted on Sensemaking Score. There was a main effect of Condition (F1,77= 12.58, p=0.001,η2= 0.14) such that those in the New Interface Condition had higher Sensemaking Scores (Fig. 3a). Post-hoc t-tests reveal that those in the New Interface Condition had higher Sensemaking Scores for all cases (allts>3.1) except for the DVD Case (t = 0.73, p = 0.47). There was also a main effect of Buyer Experience (F1,77= 12.14, p=0.001, η2= 0.14), such that those with higher Buyer Experience had higher Sensemaking Scores. Furthermore, there was a strong
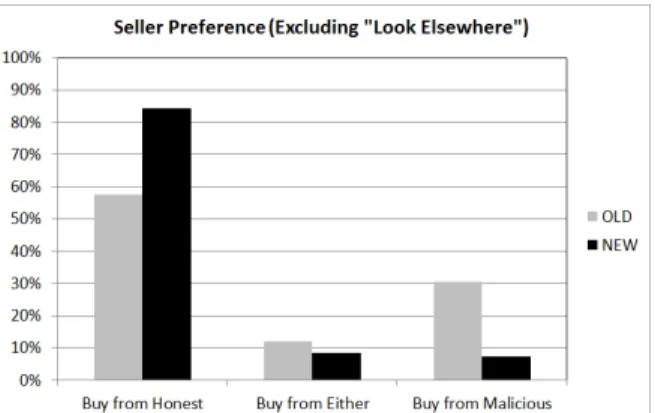
Figure 4: Among choices to buy (as opposed to look else- where), proportion of respondents who selected the malicious seller, the honest seller, or either seller.
association between Sensemaking Score and preference for the honest seller (r2= 0.39,p<0.001), supporting RQ2-H3.
RQ3 - Influence on Decision Making (Decision Trust) For each case, participants endorsed whether they would buy from one or both of the presented sellers, or would look for an- other seller. A 2 (Interface Condition)×4 (Case)×2 (Buyer Experience) repeated measures ANOVA was conducted on the preference to look for another seller. There was a main effect of Case (F3,231= 25.9,p<0.001,η2= 0.25) such that participants were more likely to prefer an alternative seller for the Camera (Mean= 0.77,SD= 0.43) versus other items (Mean= 0.30,SD= 0.46). There were no other significant main effects or interactions (not supporting RQ3-H4).
Furthermore, aχ2test on the decisions to buy from the avail- able sellers revealed that those in the New interface condition were more likely to select the honest seller over the malicious seller or no preference for one of the sellers,χ2(2,N=188)
=18.85,p<0.001 (supporting RQ3-H5A; see Fig. 4). Fur- thermore, a larger share of the Old Interface group preferred the malicious seller (supporting RQ3-H5B).
RQ4 - Response Time (Efficiency)
Time to reach a decision was recorded for each case presen- tation. A 2 (Interface Condition)×4 (Order of Presentation)
×2 (Buyer Experience) repeated measures ANOVA was con- ducted on response time. There was a significant main effect of Order of Presentation (F3,225= 11.16,p<0.001,η2= 0.13) consistent with an overall monotonic learning curve (Figure 5, supporting RQ4-H6B, but not supporting RQ4-H6A).
RQ5 - Subjective Assessments of Usability System Usability Scale
The System Usability Scale (SUS) is a ten item self-reported standardized scoring procedure which outputs scores ranging from 0 to 100. A previous meta-analysis (n = 2,324) of us- ability studies revealed a negatively skewed distribution of SUS scores with a mean of 70.14 (Median= 75,SD= 21.7) [5]. In the present study, SUS scores ranged from 27.5 to 100 (Mean= 74.3,Median= 77.5,SD= 15.8). This suggests that
Figure 5: Response time by order of case presentation, consis- tent with an overall monotonic learning curve.
subjective usability in the present study was slightly higher, although generally not different than the typical study. A 2 (In- terface Condition)×2 (Buyer Experience) univariate ANOVA was conducted on SUS score, revealing no significant main effects nor interaction (allFs<1.88), not supporting RQ5-H7.
Table 3 reports that SUS scores did not significantly correlate with preference for the honest seller in either visualization condition, not supporting RQ5-H8A.
Utility of the New Interface
Those in the New Interface condition expressed on a 5-point Likert scale that they would use the new system if it was avail- able on eBay (Mean= 4.32,SD= 0.93). They also indicated that the new system enhances their buying experience (Mean
= 3.81,SD = 1.05) and the effectiveness of getting insight into seller’s trustworthiness (Mean= 4.22,SD= 0.65). They agreed that the benefits of using the system are bigger than the effort of using it (Mean= 4.12,SD= 0.98). One-sample t-tests reveal that the responses were all significantly greater than 3 (the neutral response), allts>3.80.
Preference for the honest seller correlated against the Post-Test Questionnaire responses for both the Old and New Interface (Table 3). For those in the Old Interface condition, there was positive correlation with lifetime eBay purchase experience.
For those in the New Interface condition, we found positive correlations with four of the five self-report questions, indi- cating that those who performed better also found the system superior on several characteristics (supporting RQ5-H8B).
DISCUSSION
The goal of this study was to investigate the users’ ability to detect and understand the behavior of malicious sellers in electronic marketplaces. We compared an eBay-like feedback profile against a new feedback profile including an interac- tive visualization in a controlled between subjects experiment.
Each participant considered four cases, each consisting of two sellers selling the same item for the same price. For each case, one of the sellers was honest, whereas the other was malicious.
We found that those using the new interface were better able to detect the malicious seller. However, performance depended on the case. The best choices using the new interface were
Preference for Honest Seller
Measure Old Style New Style
Sensemaking Score .65∗∗ .47∗∗
Lifetime eBay Purchases .32∗ .23
SUS Score .30 .08
PQ “Intention to Use” – .34∗
PQ “Buying experience” – .36∗
PQ “Trustworthiness assessment” – .42∗∗
PQ “Benefits bigger than costs” – .33∗ Table 3: Correlation (Pearson’s R) of preference for hon- est seller (performance) with eBay experience, Sensemaking Score and self-report measures from the post-questionnaire (PQ). *p<.05; **p<0.01
made in the “phone” and “coin” cases, where the clue was to look at the seller behavior in single product categories. The participants in both groups looked for reviews for comparable items, thus intuitively focusing on the product category first.
Here, the new interface made it easier to filter by single prod- uct groups. The outcomes of the “camera” case even indicate that using the old interface, users are not able to find any cor- relations between feedback and price. Again, the possibility to filter by price made it easier to solve this case with the new interface. Unlike these three cases, participants performed better using the old interface with the “DVD” case. There, the malicious seller’s negative reviews were very recent compared with the honest seller. As eBay’s current feedback profile already provides the possibility to filter by time (last month, in the last 6 months, in the last 12 months), participants using the old interface could directly refer to this. With the new interface, the majority of participants was also able to make a correct decision. However, the addition of further information might have distracted users, leading to suboptimal preferences.
The difference in detection ability between the old and the new interface was more pronounced for participants with lower pre- vious eBay experience, indicating that particularly these users could benefit from an advanced presentation and interaction possibilities. Using the old eBay-like interface, they were only able to detect the decreasing quality over time attack.
Similar effects could be determined for sensemaking. Here, the participants could gain better insights on the past behavior of a seller using the new interface, and only in the “DVD” case there was no significant difference between the groups. Fur- thermore, we found a strong correlation between sensemaking and correct preference.
A third interesting effect is that the new interface, while having strong influence on reliability trust (malicious seller detection), did not have significant influence on decision trust. Instead, decision trust was significantly influenced by cases, users preferring to buy the camera elsewhere significantly more often than other items. This may show that decision trust
is influenced not only by reliability trust, but also by other factors, such as the value of the item. However, users that decided to buy from available sellers selected the honest seller significantly more often in the new interface.
While there were no differences between completion times between the two interface styles, those with lower previous experience reported the new system as less usable. Post-test questionnaires also demonstrated that those who performed well with the aid of the new interface found the system to be superior on a range of characteristics. Although usabil- ity can become an adoption barrier, perceived usefulness is a stronger adoption factor than usability [14, 60]. If early adopters perceive the system as useful, other users may join in. We provide initial evidence for this adoption scenario. In order to profit from the distinct advantages of both interfaces, parallel coordinates could be ancillary, and not alternative, to the old interface, e.g., for cheap items users may not want to engage in additional interactions.
CONCLUSION
The findings described in this paper suggest that enhanced presentation of reputation data in form of an interactive par- allel coordinates visualization can notably increase the users’
ability to detect and understand malicious seller behavior in electronic marketplaces. Using the old interface, particularly inexperienced participants were not able to detect any of the attacks except the decreasing quality over time. Thus, the new interface can support users in selecting a more trustworthy seller, and might therefore lead to less fraud in a real-world environment. To our knowledge, this is the first study of users’
ability to detect attacks toward online reputation systems.
Our setup has some limitations. We used a simplified version of eBay’s feedback profile, as we did not provide a link to the description of the auction item, and we removed the star rating of further characteristics such as “item as described”, as well as all seller replies to comments. As we focused on context-based attacks, further research is needed to determine how users deal with other attacks, such as unfair ratings. More- over, participants being asked to “solve” the cases may have analyzed the seller profiles more critically than in a real-life situation. An additional issue that requires investigation is comparing more than two sellers. We furthermore did not ask about visualization experience, but randomly assigned partici- pants to conditions. It could also be interesting to analyze the behavior of users with different experiences in this context.
Overall, this work provides a new perspective on the very topical issue of robustness of reputation systems and thus can encourage researchers to utilize the cognitive capabilities and the experience of the users in addition to creating more robust reputation metrics.
ACKNOWLEDGMENTS
J. S¨anger, N. H¨ansch and Z. Benenson were supported by the Bavarian State Ministry of Education, Science and the Arts as part of the FORSEC research association. B. Glass and M. A. Sasse were funded by EPSRC Grant EP/K033476/1 Deterrence of Deception in Socio-Technical Systems.
REFERENCES
1. Rehab Alnemr and Christoph Meinel. 2011. Why rating is not enough: A study on online reputation systems. In Collaborative Computing: Networking, Applications and Worksharing (CollaborateCom), 2011 7th International Conference on. IEEE, 415–421.
2. Donovan Artz and Yolanda Gil. 2007. A survey of trust in computer science and the Semantic Web.Web Semantics 5, 2 (2007), 58–71.DOI:
http://dx.doi.org/10.1016/j.websem.2007.03.002
3. S.B. Azhar and M.J. Rissanen. 2011. Evaluation of Parallel Coordinates for Interactive Alarm Filtering. In Information Visualisation (IV), 2011 15th International Conference on. 102–109.DOI:
http://dx.doi.org/10.1109/IV.2011.30
4. Sulin Ba and Paul A Pavlou. 2002. Evidence of the effect of trust building technology in electronic markets: Price premiums and buyer behavior.MIS quarterly(2002), 243–268.
5. Aaron Bangor, Philip T Kortum, and James T Miller.
2008. An empirical evaluation of the system usability scale.Intl. Journal of Human–Computer Interaction24, 6 (2008), 574–594.
6. Zinaida Benenson, Anna Girard, and Ioannis Krontiris.
2015. User Acceptance Factors for Anonymous
Credentials: An Empirical Investigation. InWorkshop on the Economics of Information Security (WEIS).
7. Gary Bente, Odile Baptist, and Haug Leuschner. 2012. To buy or not to buy: Influence of seller photos and
reputation on buyer trust and purchase behavior.
International Journal of Human-Computer Studies70, 1 (2012), 1–13.
8. Gregory S Black. 2005. Is eBay for everyone? An assessment of consumer demographics.SAM Advanced Management Journal70, 1 (2005), 50.
9. Gary E Bolton, Elena Katok, and Axel Ockenfels. 2004.
How effective are electronic reputation mechanisms? An experimental investigation.Management science50, 11 (2004), 1587–1602.
10. Philip Bonhard, Clare Harries, John McCarthy, and M Angela Sasse. 2006. Accounting for taste: using profile similarity to improve recommender systems. In Proceedings of the SIGCHI conference on Human Factors in computing systems. ACM, 1057–1066.
11. Michael Bostock, Vadim Ogievetsky, and Jeffrey Heer.
2011. D3data-driven documents.Visualization and Computer Graphics, IEEE Transactions on17, 12 (2011), 2301–2309.
12. John Brooke. 1996. SUS - A quick and dirty usability scale.Usability evaluation in industry189 (1996), 194.
13. SAP User Experience Community. 2015. System Usability Scale – jetzt auch auf Deutsch.
https://experience.sap.com/skillup/
system-usability-scale-jetzt-auch-auf-deutsch. (2015).
[Online; last access on September 15th, 2015].
14. Fred D. Davis, Richard P. Bagozzi, and Paul R. Warshaw.
1989. User acceptance of computer technology: a comparison of two theoretical models.Management science35, 8 (1989), 982–1003.
15. Chrysanthos Dellarocas. 2000. Immunizing online reputation reporting systems against unfair ratings and discriminatory behavior. InProceedings of the 2nd ACM Conference on Electronic Commerce. ACM, New York, 150–157.DOI:http://dx.doi.org/10.1145/352871.352889
16. Andreas Diekmann, Ben Jann, Wojtek Przepiorka, and Stefan Wehrli. 2013. Reputation Formation and the Evolution of Cooperation in Anonymous Online Markets.
American Sociological Review(2013).DOI:
http://dx.doi.org/10.1177/0003122413512316
17. Liran Einav, Chiara Farronato, Jonathan D Levin, and Neel Sundaresan. 2013.Sales Mechanisms in Online Markets: What Happened to Internet Auctions?
Technical Report. National Bureau of Economic Research.
18. Diego Gambetta. 1988. Can We Trust Trust? InTrust:
Making and Breaking Cooperative Relations, Diego Gambetta (Ed.). Basil Blackwell, Oxford, 213–237.
19. Anindya Ghose, Panagiotis G Ipeirotis, and Arun Sundararajan. 2009. The dimensions of reputation in electronic markets.NYU Center for Digital Economy Research Working Paper No. CeDER-06-02(2009).
20. Nathan Griffiths. 2005. Task delegation using
experience-based multi-dimensional trust. InProceedings of the fourth international joint conference on
Autonomous agents and multiagent systems. ACM, 489–496.
21. Stephan Hammer, Rolf Kiefhaber, Matthias Redlin, Elisabeth Andre, and Theo Ungerer. 2013. A User-Centric Study Of Reputation Metrics in Online Communities. InProceedings of the 3rd Workshop on Trust, Reputation and User Modeling (TRUM’13). Rome Italy.
22. Jeffrey Heer and Maneesh Agrawala. 2008. Design considerations for collaborative visual analytics.
Information visualization7, 1 (2008), 49–62.
23. Julian Heinrich and Daniel Weiskopf. 2013. State of the Art of Parallel Coordinates. InSTAR Proceedings of Eurographics 2013. Eurographics Association, 95–116.
24. Kevin Hoffman, David Zage, and Cristina Nita-Rotaru.
2009. A Survey of Attack and Defense Techniques for Reputation Systems.ACM Comput. Surv.42, 1, Article 1 (Dec. 2009), 31 pages.DOI:
http://dx.doi.org/10.1145/1592451.1592452
25. Daniel Houser and John Wooders. 2006. Reputation in auctions: Theory, and evidence from eBay.Journal of Economics & Management Strategy15, 2 (2006), 353–369.
26. Alfred Inselberg. 1985. The plane with parallel coordinates.The Visual Computer1, 2 (1985), 69–91.
DOI:http://dx.doi.org/10.1007/BF01898350
27. Alfred Inselberg. 2009.Parallel Coordinates: Visual Multidimensional Geometry and Its Applications.
Springer.
28. Jimmy Johansson and Camilla Forsell. 2016. Evaluation of Parallel Coordinates: Overview, Categorization and Guidelines for Future Research.IEEE Trans. Vis. Comput.
Graph.22, 1 (2016), 579–588.DOI:
http://dx.doi.org/10.1109/TVCG.2015.2466992
29. Audun Jøsang and Jennifer Golbeck. 2009. Challenges for robust trust and reputation systems. InProceedings of the 5th International Workshop on Security and Trust Management. Saint Malo France.
30. Audun Jøsang, Roslan Ismail, and Colin Boyd. 2007. A survey of trust and reputation systems for online service provision.Decision Support Systems43, 2 (2007), 618–644.DOI:
http://dx.doi.org/10.1016/j.dss.2005.05.019
31. Audun Jsang. 2012. Robustness of Trust and Reputation Systems: Does It Matter? InTrust Management VI, Theo Dimitrakos, Rajat Moona, Dhiren Patel, and D.Harrison McKnight (Eds.). IFIP Advances in Information and Communication Technology, Vol. 374. Springer Berlin Heidelberg, 253–262.DOI:
http://dx.doi.org/10.1007/978-3-642-29852-3_21
32. Daniel Keim, Gennady Andrienko, Jean-Daniel Fekete, Carsten G¨org, J¨orn Kohlhammer, and Guy Melanc¸on.
2008. Visual Analytics: Definition, Process, and Challenges. InInformation Visualization, Andreas Kerren, JohnT. Stasko, Jean-Daniel Fekete, and Chris North (Eds.). Lecture Notes in Computer Science, Vol.
4950. Springer Berlin Heidelberg, 154–175.
33. Daniel A. Keim. 2001. Visual Exploration of Large Data Sets.Commun. ACM44, 8 (Aug. 2001), 38–44.DOI:
http://dx.doi.org/10.1145/381641.381656
34. Reid Kerr and Robin Cohen. 2009. Smart Cheaters Do Prosper: Defeating Trust and Reputation Systems. In Proceedings of The 8th International Conference on Autonomous Agents and Multiagent Systems - Volume 2 (AAMAS ’09). International Foundation for Autonomous Agents and Multiagent Systems, Richland SC, 993–1000.
35. Eleni Koutrouli and Aphrodite Tsalgatidou. 2012.
Taxonomy of attacks and defense mechanisms in P2P reputation systems - Lessons for reputation system designers.Computer Science Review6, 2-3 (2012), 47–70.
DOI:http://dx.doi.org/10.1016/j.cosrev.2012.01.002
36. J Richard Landis and Gary G Koch. 1977. The
measurement of observer agreement for categorical data.
biometrics(1977), 159–174.
37. James R Lewis and Jeff Sauro. 2009. The factor structure of the system usability scale. InHuman Centered Design.
Springer, 94–103.
38. Benedikt Loepp, Katja Herrmanny, and J¨urgen Ziegler.
2015. Blended Recommending: Integrating Interactive Information Filtering and Algorithmic Recommender Techniques. InProceedings of the 33rd Annual ACM Conference on Human Factors in Computing Systems.
ACM, 975–984.
39. Zaki Malik and Athman Bouguettaya. 2009. Rateweb:
Reputation assessment for trust establishment among web services.The VLDB JournalThe International Journal on Very Large Data Bases18, 4 (2009), 885–911.
40. Stephen Marsh. 1994.Formalising Trust as a
Computational Concept. Ph.D. Dissertation. University of Stirling, Stirling.http://homepage.mac.com/smarsh2003/
SteveMarsh/Publications_files/Trust-thesis.pdf
41. Stephen Marsh, Anirban Basu, and Natasha Dwyer. 2012.
Rendering unto cæsar the things that are cæsars:
Complex trust models and human understanding. InTrust Management VI. Springer, 191–200.
42. David Masclet and Thierry P´enard. 2012. Do reputation feedback systems really improve trust among anonymous traders? An experimental study.Applied Economics44, 35 (2012), 4553–4573.
43. D. Harrison McKnight and Normal L. Chervany. 1996.
The meanings of trust.Technical Report MISRC Working Paper Series 96-04, University of Minnesota,
Management Information Systems Reseach Center (1996).
44. Mikhail I Melnik and James Alm. 2002. Does a seller’s ecommerce reputation matter? Evidence from eBay auctions.Journal of Industrial Economics(2002), 337–349.
45. Jakob Nielsen. 1994.Usability engineering. Elsevier.
46. Paul A Pavlou and Angelika Dimoka. 2006. The nature and role of feedback text comments in online
marketplaces: Implications for trust building, price premiums, and seller differentiation.Information Systems Research17, 4 (2006), 392–414.
47. Martin Rehak, Milos Gregor, Michal Pechoucek, and Jeffrey Bradshaw. 2006. Representing Context for Multiagent Trust Modeling. InProceedings of the IEEE/WIC/ACM International Conference on Intelligent Agent Technology. Hongkong China, 737–746.DOI:
http://dx.doi.org/10.1109/IAT.2006.107
48. Paul Resnick, Ko Kuwabara, Richard Zeckhauser, and Eric Friedman. 2000. Reputation systems.Commun.
ACM43, 12 (2000), 45–48.DOI:
http://dx.doi.org/10.1145/355112.355122
49. Paul Resnick and Hal R Varian. 1997. Recommender systems.Commun. ACM40, 3 (1997), 56–58.
50. Paul Resnick and Richard Zeckhauser. 2002. Trust among strangers in internet transactions: Empirical analysis of ebays reputation system.The Economics of the Internet and E-commerce11, 2 (2002), 23–25.
51. Paul Resnick, Richard Zeckhauser, John Swanson, and Kate Lockwood. 2006. The value of reputation on eBay:
A controlled experiment.Experimental Economics9, 2 (2006), 79–101.
52. Jens Riegelsberger, Martina Angela Sasse, and John D.
McCarthy. 2005. The mechanics of trust: A framework for research and design.Int. J. Hum.-Comput. Stud.62, 3 (2005), 381–422.DOI:
http://dx.doi.org/10.1016/j.ijhcs.2005.01.001
53. Bob Rietjens. 2006. Trust and reputation on eBay:
Towards a legal framework for feedback intermediaries.
Information & Communications Technology Law15, 1 (2006), 55–78.
54. Denise M Rousseau, Sim B Sitkin, Ronald S Burt, and Colin Camerer. 1998. Not so different after all: A cross-discipline view of trust.Academy of management review23, 3 (1998), 393–404.
55. Daniel M Russell, Mark J Stefik, Peter Pirolli, and Stuart K Card. 1993. The cost structure of sensemaking.
InProceedings of the INTERACT’93 and CHI’93 conference on Human factors in computing systems.
ACM, 269–276.
56. Johannes S¨anger and G¨unther Pernul. 2014. Visualizing Transaction Context in Trust and Reputation Systems. In Ninth International Conference on Availability,
Reliability and Security, ARES 2014, Fribourg, Switzerland, September 8-12, 2014. 94–103.DOI:
http://dx.doi.org/10.1109/ARES.2014.19
57. Christine Satchell and Paul Dourish. 2009. Beyond the user. InProceedings of the 21st Annual Conference of the Australian Computer-Human Interaction Special Interest Group on Design: Open 24/7 - OZCHI ’09. ACM Press, New York, New York, USA, 9.DOI:
http://dx.doi.org/10.1145/1738826.1738829
58. Galit Shmueli, Wolfgang Jank, Aleks Aris, Catherine Plaisant, and Ben Shneiderman. 2006. Exploring auction databases through interactive visualization.Decision Support Systems42, 3 (2006), 1521–1538.
59. Mohammad Gias Uddin, Mohammad Zulkernine, and Sheikh Iqbal Ahamed. 2008. CAT: a context-aware trust model for open and dynamic systems. InProceedings of the 2008 ACM symposium on Applied computing. ACM, 2024–2029.
60. Viswanath Venkatesh, Michael G. Morris, Gordon B.
Davis, and Fred D. Davis. 2003. User acceptance of information technology: Toward a unified view.MIS quarterly(2003), 425–478.
61. Edward J. Wegman. 1987.Hyperdimensional data analysis using parallel coordinates. Fairfax and Va.
62. Yuan Yao, Sini Ruohomaa, and Feng Xu. 2012.
Addressing Common Vulnerabilities of Reputation Systems for Electronic Commerce.JTAER7, 1 (2012), 1–20.
http://www.jtaer.com/apr2012/Yao_Ruohomaa_Xu_p1.pdf
63. Koji Yatani, Michael Novati, Andrew Trusty, and Khai N.
Truong. 2011. Review spotlight. InProceedings of the 2011 annual conference on Human factors in computing systems - CHI ’11. ACM Press, New York, New York, USA, 1541.DOI:
http://dx.doi.org/10.1145/1978942.1979167
64. Haibin Zhang, Yan Wang, and Xiuzhen Zhang. 2012. A trust vector approach to transaction context-aware trust evaluation in e-commerce and e-service environments. In Proceedings of the 5th IEEE International Conference on Service-Oriented Computing and Applications. Vol.
SOCA. Taipei Taiwan, 1–8.DOI:
http://dx.doi.org/10.1109/SOCA.2012.6449461