1
NE Atlantic continental slope stability from a numerical modeling
1
perspective
2 3
Bellwald, B.1,2*, Urlaub, M.3, Hjelstuen, B.O.1, Sejrup, H.P.1, Sørensen, M.B.1, Forsberg, C.F.4, 4
Vanneste, M.4 5
1Department of Earth Science, University of Bergen, Bergen, Norway 6
2Now at: Volcanic Basin Petroleum Research (VBPR) AS, Oslo, Norway 7
3GEOMAR Helmholtz Centre for Ocean Research Kiel, Kiel, Germany 8
4Norwegian Geotechnical Institute (NGI), Oslo, Norway 9
*benjamin@vbpr.no 10
2 Abstract
11
Trough mouth fans are environments characterized by high sediment supply during glacial stages and 12
the occurrence of large-scale instabilities. The geological record indicates that several of these 13
environments have failed repeatedly resulting in large submarine landslides. The roles of sedimentation 14
rate, weak layers, glacial loading and unloading as well as seismic activity on triggering megaslides in 15
trough-mouth-fan systems is still unclear. A better understanding of the preconditioning factors, triggers 16
and consequences of these landslides is crucial due to the hazard they pose to coastal communities and 17
offshore industries.
18
In this paper, we focus on the North Sea Trough Mouth Fan, which is the result of massive glacial 19
sediment input delivered to the shelf edge through the Norwegian Channel, southeast Nordic Seas 20
margin. The Tampen Slide, one of several large paleo-landslides that have happened within the North 21
Sea Trough Mouth Fan, took place at c. 130 ka (end of MIS 6), and removed an estimated 1800 km3 of 22
sediment.
23
Here, we use boundary conditions from the Tampen Slide and 2D Finite Element Modeling (Abaqus 24
software from Simulia) to evaluate the effects of variations in sedimentation rates as well as sediment 25
properties on the generation of excess pore pressure, fluid flow, and slope stability along the axis of the 26
trough-mouth-fan system. The model domain, 40 km in length and 2 km in height, is dominated by 27
glacigenic debris flows and glacimarine sediment deposits. We use geotechnical data measured on 28
samples of glacigenic and glacimarine sediment deposits from the nearby Ormen Lange gas field area 29
to constrain the model. We evaluate the stability of the slope under various scenarios, including constant 30
sediment loading, episodic changes in sedimentation rates and abrupt pulses in sediment delivery for a 31
61 kyr period (MIS 6). The models show that increased sedimentation rates during glacial stages do not 32
generate sufficient excess pore pressure to set off a landslide. Furthermore, the simulated overpressures 33
for the different sedimentation scenarios do not significantly differ at the end of the model runs. The 34
results also highlight the importance of a basal glacimarine sediment layer underneath the rapidly- 35
deposited sediments for the build-up of overpressure. Consequently, this glacimarine sediment layer has 36
the inherited potential to act as a weak layer facilitating instability. However, as overpressure due to 37
3
sediment deposition alone does not result in slope failure, we couple the preconditioned slope with 38
earthquake ground shaking. Based on attenuation models, an earthquake of approximately M6.9 or 39
larger at a short distance from the Tampen Slide headwall could have triggered the landslide. Therefore, 40
we suggest glacial sedimentation and a glacimarine sediment layer to represent preconditioning factors, 41
and seismic shaking as the final trigger mechanism for the Tampen Slide, i.e. similar to the situation that 42
lead to the development of the Storegga Slide in the same area.
43 44
Keywords: North Sea Trough Mouth Fan – Tampen Slide – Slope stability – Overpressure – Trigger 45
mechanism – Earthquake – Quaternary – Glaciation – North Atlantic – Glacial geomorphology 46
4 1. Introduction
47
Evidence of submarine landslides is found both on low-latitude unglaciated and high-latitude (formerly) 48
glacial-dominated continental margins (e.g. Canals et al., 2004). The largest submarine landslides, e.g.
49
the Storegga Slide, tend to occur on continental slopes with remarkably low gradients (<2°). Despite 50
this low dip, the remobilized slide masses runout over distances of several hundreds of kilometers 51
(Hampton et al., 1996). Submarine landslides often develop as retrogressive translational failures, 52
characterized by bedding-parallel glide planes that are separated by distinct escarpments (Hampton et 53
al., 1996; Masson et al., 2010). The gravitational load and generation of overpressure linked to the rapid 54
deposition of glacigenic debris flows (GDFs), plumite deposits and (glaci-)marine sediments seems to 55
play a significant role for the initiation of large submarine landslides on glaciated margins (Bryn et al., 56
2005; Tripsanas et al., 2008; L’Heureux et al., 2013). Differences in the strength behavior of marine 57
clays and glacial clays are a key aspect for the development of these failures (Kvalstad et al., 2005b).
58
Due to their potential for seafloor infrastructure damage and tsunami generation, submarine landslides 59
may have a significant socio-economic impact (e.g. Pope et al., 2017). High sedimentation rates, 60
changing sea levels, gas hydrate dissociation and earthquake shaking are frequently discussed as 61
processes that affect slope stability in the submarine environment (e.g. Leynaud et al., 2009). The pre- 62
conditioning and trigger mechanisms are, however, not always easy to establish (Masson et al., 2010).
63
It is, however, essential for geohazard and risk assessments to understand and distinguish between 64
preconditioning factors and factors that trigger slope failure, as well as understanding the potential 65
consequences. Overpressure is generally considered as a key aspect in most – if not all – pre- 66
conditioning factors (Vanneste et al., 2014).
67
Sediment accumulation can outpace the dissipation of pore fluids if rates are high and/or permeability 68
is low. Overpressure, here defined as pore pressure in excess of hydrostatic pressure, reduces the 69
effective stress in the sediments. Overpressure can exist in deep and shallow formations and it most 70
likely occurs where fine-grained sediments having low-permeability (<10-16 m2) inhibit pore fluid 71
migration or at locations affected by large forcing mechanisms, such as rapid sediment deposition 72
(Swarbrick and Osborne, 1998; Flemings et al., 2008; Scheider et al., 2009; Dugan and Sheahan, 2012).
73
5
Large-scale slope failures have happened in regions where sedimentation rates are high (McAdoo et al., 74
2000; Urgeles and Camerlenghi, 2013). Having an important role in the pre-conditioning of subaquatic 75
slopes, rapid sedimentation can set the conditions for the occurrence and volumes of large submarine 76
mass movements (Masson et al., 2006; Dugan and Sheahan, 2012; Stoecklin et al., 2017). Numerical 77
modeling indicates that rapid and prolonged sediment delivery from rivers or ice streams can generate 78
sufficient overpressure to directly cause failure of nearly flat slopes (Stoecklin et al., 2017), or weaken 79
the slope to such an extent that a moderate earthquake can cause failure (Stigall and Dugan, 2010).
80
Overpressure generated by the rapid loading of glacial deposits during short periods of peak glaciations 81
on top of marine sediments is likely one of the main preconditioning factors for the Storegga Slide (Fig.
82
1) (Berg et al., 2005), and overpressure remnants are still observed behind its upper headwall (Strout 83
and Tjelta, 2005). Oozes underlying Pleistocene glacial sediments have been suggested to affect lateral 84
fluid migration (Bryn et al., 2005). In order to predict the amount of overpressure that can be generated 85
by sediment deposition over time, i.e. during consolidation, information about sedimentation rates as 86
well as the compressibility and permeability of the sediments and how these parameters change with 87
increasing overburden stress and compaction is required (Urlaub et al., 2012; Kvalstad et al., 2005a).
88
So-called weak layers are often considered to host the slip facilitating translational failure at all scales 89
(Locat et al., 2014). Examples are the Storegga Slide (Bryn et al., 2005; Solheim et al., 2005), the 90
intermediate-sized Cap Blanc Slide (Urlaub et al., 2018) or the much smaller Finneidfjord Slide 91
(Vanneste et al., 2012). In this study, we define a weak layer as any geological layer or a sequence of 92
layers promoting slope instability. Trough mouth fans (TMFs) are depositional systems characteristic 93
for high-latitude (formerly) glacial continental margins. TMFs are largely built up by (stacked) GDFs 94
that were deposited in periods when ice streams reached the shelf edge (King et al., 1996; Laberg and 95
Vorren, 1996; Elverhøi et al., 1997). There is ample evidence of the occurrence of submarine landslides 96
in these TMFs (King et al., 1996; Vorren et al., 1998; Sejrup et al., 2005; Nygård et al., 2005; Hjelstuen 97
et al., 2007; Rebesco et al., 2013), and TMFs are excellent records to study the relationship between 98
large submarine landslides and ice-sheet changes on different types of margins (Vorren and Laberg, 99
1997; Pope et al., 2018). The seafloor typically dips less than 3° in TMF areas (Gales et al., 2018).
100
6
Furthermore, seismicity in TMFs was most likely higher shortly after the deglaciation due to glacio- 101
isostatic rebound (Byrkjeland et al., 2000; Owen et al., 2007; Lee, 2009). Following the suggestion of 102
Hjelstuen et al. (2007), megaslides are here defined as mass transport deposits with volumes larger than 103
1000 km3. 104
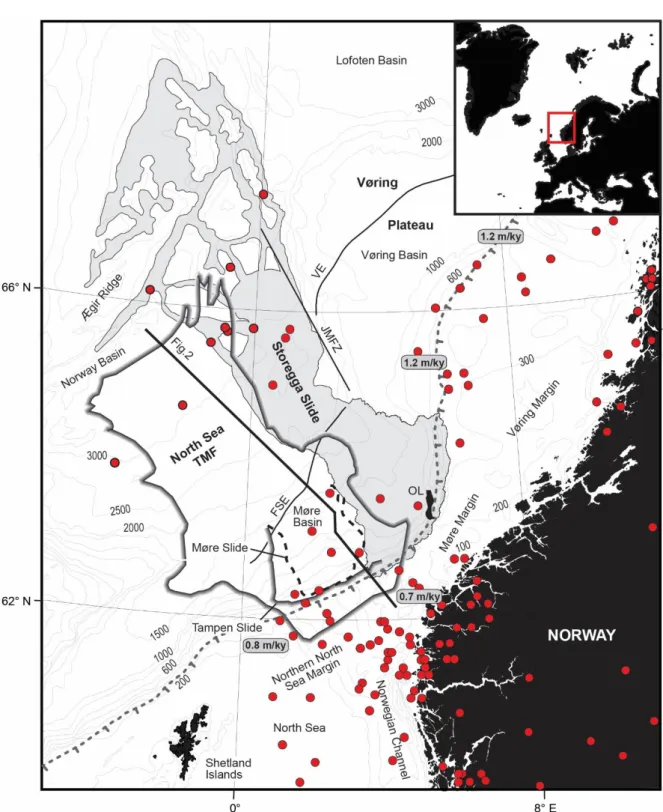
In this study, we model the stability of the slope across the North Sea TMF (Fig. 1) during Pleistocene 105
climate changes, focusing on the effect of rapid sediment deposition and seismic shaking. This type of 106
modeling has previously not been published on TMF systems and has the potential to contribute to 107
identify controlling factors of slope stability on the North Atlantic margin, where the volumes involved 108
in submarine landslides are one or several orders of magnitude higher than their counterparts on active 109
margins (e.g. Hühnerbach et al., 2004; Urgeles and Camerlenghi, 2013). The study presented herein 110
addresses the following questions: (1) Can increased sedimentation rates at the North Sea TMF during 111
a period with shelf edge glaciation generate sufficient overpressure on a ~1° slope to cause slope failure?, 112
(2) What is the effect of a glacimarine sediment layer at the base of rapidly deposited GDFs on slope 113
stability?, (3) How important is the sedimentation pattern during the glacial period on slope stability?, 114
and (4) What earthquake magnitude is required to trigger megaslides on a slope preconditioned by 115
glacial sediment? Given some uncertainties in sediment parameters, as is often the case for submarine 116
slope stability assessments (Vanneste et al., 2014), we emphasize that the results of our study should be 117
interpreted in a qualitative rather than quantitative way.
118 119
2. Geological setting 120
The Pleistocene North Sea TMF lies at the outlet of the Norwegian Channel on the northern North Sea 121
Margin (Fig. 1). Spreading over an area of 110,000 km2 and built up by nearly 40,000 km3 of sediments 122
(Sejrup et al., 1996; King et al., 1996; Nygård et al., 2005; Hjelstuen et al., 2012), it is the largest 123
Pleistocene TMF along the Norwegian continental margin (Fig. 1). The North Sea TMF is located in a 124
region which has experienced subsidence rates of 0.7-0.8 m/kyr during the mid- and late-Quaternary 125
(Sejrup et al., 2004). The fan has mainly been fed by erosional products delivered to the upper 126
continental slope by the fast-flowing Norwegian Channel Ice Stream during maximum Pleistocene 127
7
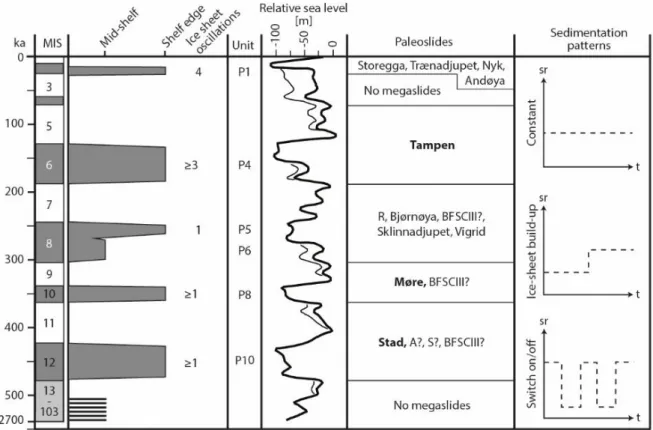
glaciations in Marine Isotope Stages (MIS) 2, 6, 8, 10, and probably 12 (Fig. 3) (Sejrup et al., 2003;
128
Nygård et al., 2005). The sediments deposited in the early Quaternary (2.6-0.8 Ma), however, are 129
sourced from the Norwegian mainland in the east (Batchelor et al., 2017). The shelf geometry northeast 130
of the North Sea TMF is uniform over a c. 150 km long distance, with a width of c. 60 km.
131
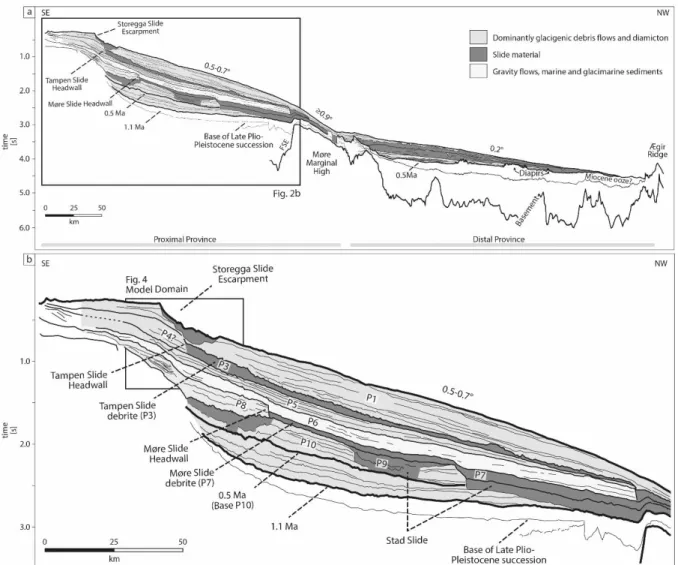
The volcanic Møre Marginal High (Fig. 2) divides the wedge-shaped North Sea TMF into two main 132
provinces, a proximal fan province characterized by an alteration between deposits of GDFs, 133
glacimarine sedimentation and slide escarpments and deposits, and a distal fan province dominated by 134
slide debrites (Nygård et al., 2005). The Pleistocene sedimentary column within the proximal province 135
has been divided into ten sequences (P1-P10) (Fig. 2) (King et al., 1996; Nygård et al., 2005), reflecting 136
the change in the sedimentary processes through glacial-interglacial cycles. Sequences P1, P4, P5, P8 137
and P10 are dominated by GDFs, identified as acoustically transparent stacked lobate lenses in the 138
acoustic data (Sejrup et al., 1996; King et al., 1998; Nygård et al., 2002). The glacimarine sediments (P2 139
and P6) drape the GDFs and have an acoustically laminated seismic facies, which is only visible where 140
the sediment package is thick enough. These glacimarine deposits are characterized as more fine-grained 141
sediments with lower unit weights and shear strengths, and higher water contents, void ratios, 142
permeabilities, consolidation coefficients, compressibilities, plasticity and sensitivity values compared 143
to the GDFs (King et al., 1998; Berg et al., 2005; L’Heureux et al., 2013; Llopart et al., 2014).
144
The three slide debrites (P3, P7 and P9) identified in the North Sea TMF are characterized by an 145
acoustically chaotic facies between a smooth lower and irregular upper surfaces. The Tampen Slide 146
(Figs. 1, 2), one of numerous prominent megaslides along the Norwegian-Barents Sea continental 147
margin (e.g. King et al., 1996; Solheim et al., 2005; Hjelstuen et al., 2007), is the most recent submarine 148
landslide initiated at the North Sea TMF. It is suggested to be of late MIS 6 age (~130 ka, Nygård et al., 149
2007). It has been suggested that MIS 6 was characterized by at least three shelf edge ice sheet 150
oscillations (Fig. 3) (Nygård et al., 2005). The debrite of the Tampen Slide (P3 in Fig. 2) has been traced 151
from c. 500 m water depth at the shelf break to more than 2000 m water depth some 200 km basin-ward, 152
and its ~300 m-high headwall is located c. 10 km west of the shelf break (Fig. 2). Nygård et al. (2005) 153
8
estimated a sediment volume of 1400 km3 failing along a 0.2-0.7°, and locally steeper (1°), slope for the 154
Tampen Slide.
155
Additional to the ~130 ka old Tampen Slide, the North Sea TMF experienced megaslides during MIS 9 156
(Møre Slide) and MIS 11-12 (Stad Slide; Fig. 3) (Nygård et al., 2005; Solheim et al., 2005; Hjelstuen 157
and Grinde, 2016). The TMF did not fail during the last glacial-interglacial cycle; however, the ~8100 158
cal. yrs BP Storegga Slide happened nearby (Figs. 1, 2) (Bryn et al., 2005; Haflidason et al., 2005;
159
calibration curve from published articles). These megaslides affect different areas of the North Sea TMF 160
(Hjelstuen et al., 2007), as the Pleistocene ice-stream patterns have changed and sediment sources varied 161
(Batchelor et al., 2017).
162
In the study area, average sedimentation rates are in the order of c. 1 m/kyr for the glacial and deglacial 163
periods (Lekens et al., 2005; Nygård et al., 2007), whereas the rates during interglacials fall in the range 164
of 0.05-0.10 m/ka, i.e. only a fraction of the rate documented for glacial periods (Haflidason et al., 1998).
165
Locally higher sedimentation rates of up to 36 m/ka are estimated near the Storegga Slide headwall 166
during the last deglaciation (Hjelstuen et al., 2004). The excess load of rapidly-deposited glacial 167
sediments and the disappearing ice sheets are suggested to have enhanced the local stress field and, in 168
turn, the seismic activity in the region (Byrkjeland et al., 2000).
169 170
3. Model configuration and slope stability analysis 171
172
In this study, we use the Finite Element Modeling software ABAQUS (6.13-1) from Simulia to test 173
various hypotheses to describe the potential for slope failure in the entire model domain at any time 174
during deposition. We therefore perform a fully-coupled fluid flow-stress analysis using a model setup 175
that accounts for large displacements using the finite strain theory.
176
3.1 Model setup and input parameters 177
9
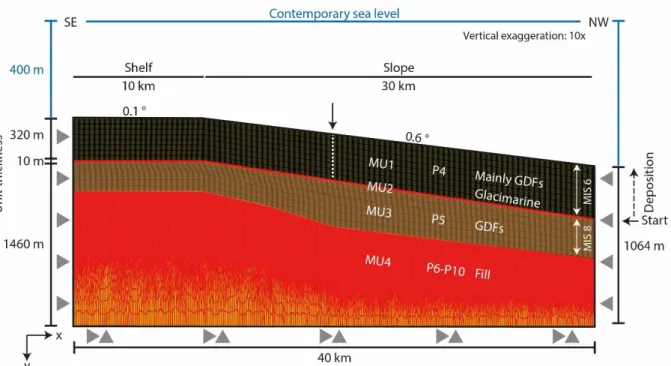
The Finite Element 2D Model input is partly based on the continental slope setting in the area of the 178
Tampen Slide headwall including seismic reflection data interpreted by Nygård et al. (2005) (Fig. 2).
179
The model domain has been subdivided into four simplified discrete Model Units (MU) (Fig. 4; Tab. 1).
180
The seismic sequences P6-P10 (Figs. 2, 4) are summarized as “fill” material and represent MU4. We 181
consider that MU4 is in stress equilibrium, assuming that the MIS 9 Møre Slide released the overpressure 182
that might had accumulated before failure. GDF deposits representing MIS 8 (P5, 300-243 ka), which 183
show the best-developed mounded seismic facies on the North Sea TMF (Nygård et al., 2005), overlie 184
the “fill”-fundament and represent MU3. We assume that the deposits representing the MIS 8 deglacial 185
and the MIS 7 interglacial, which cannot be identified in the seismic data, have been eroded by the 186
Tampen Slide. A 10 m thick layer of stratified fine-grained glacimarine sediments is therefore included 187
for this time period, defining MU2 (Fig. 4; Tab. 1). We estimate this layer to have a thickness of 10 m 188
based on deglacial and interglacial sedimentation rates in the study area (Haflidason et al., 1998; Becker 189
et al., 2018). The thickness of the sediments removed by the Tampen Slide (MU1) is estimated based 190
on the intact stratigraphy upwards of the Tampen Slide headwall and extrapolated to simulate pre-failure 191
conditions. We further assume MU1 to be thickest ~20 km downslope of the Tampen Slide headwall, 192
corresponding with the right lateral boundary of the model. Characterized as relatively uniform in its 193
rheological properties, MU1 consists of mainly GDFs deposited during MIS 6 (Tab. 1).
194
Whereas the Storegga Slide developed retrogressively (Gauer et al., 2005), such behavior is not evident 195
from the present seismic data in the Tampen Slide region. As we assume that the Tampen Slide was not 196
initiated by the destabilization of a locally steeper slope, modeling a laterally complete profile is not 197
expected to add significantly to the modeling results. We therefore laterally limit the model domain to 198
40 km, consisting of a 10 km wide continental shelf and 30 km of continental slope. The paleo-slope 199
dip used in the model (0.6°) runs parallel to the basal reflector of the Tampen Slide (Fig. 4).
200
Sediment properties 201
The three materials used in the model are characterized by GDFs (MU3), mainly GDFs (MU1) and 202
glacimarine sediments (MU2) (Fig. 4, Tab. 1). All deposits are modelled as non-linear porous 203
10
elastoplastic materials, described by the Modified Cam Clay constitutive model. All soil units are 204
inferred to have a Poisson ratio (ν) of 0.3, and a friction angle (φ) of 28°. These values are based on 205
measurements performed on GDFs from a similar geological setting, i.e. the upper-middle continental 206
slope of the Storfjorden TMF (Llopart et al., 2014). The dry density (ρdry) is 1.8 g/cm3 for glacimarine 207
deposits and 2.0 g/cm3 for the GDF-dominated modeling units (Tab. 2) (King et al., 1998).
208
For the consolidation properties (compressibility (λ) and permeability (k)) we use values measured on 209
samples of glacial debris and glacimarine deposits from the nearby Ormen Lange gas field area on the 210
upper Møre continental slope (Kvalstad et al., 2005a) (Fig. 1, Tab. 2). Even if the composition of glacial 211
sediments is documented to vary in time and space (King et al., 1996), the use of these values can be 212
justified as we expect similar depositional environments and similar sediments to be represented in the 213
neighboring North Sea TMF. The slope of the normal compression line in the Modified Cam Clay model 214
(λ), hereafter referred to as compressibility for simplicity, decreases with decreasing void ratio, 215
averaging at 0.09 for GDFs and 0.29 for glacimarine deposits. The compressibility of mainly glacial 216
debris (MU1) is 0.1 for all void ratios due to lack of consolidation tests for this sediment type.
217
Permeability (k) is a function of porosity (n), and is defined as log10(k) = 11.5 · n – 14.6 for packages 218
consisting of GDFs and mainly GDFs, and log10(k) = 7.6 · n – 13.8 for glacimarine deposits. The void 219
ratio at 1 kPa (e0, void ratio at seafloor) is set to 3.5 (equals a porosity of 0.78) for the glacimarine 220
sediments and 1.2 (equals a porosity of 0.55) for the GDF-dominated modelling units (Tab. 2).
221
Simulating sediment deposition during MIS 6 222
We simulate sediment deposition during MIS 6, at the end of which the Tampen Slide occurred, by 223
consecutively “switching on” eight elements rows. Displacement and pore-pressure plane-strain 224
elements are activated and stacked on top of the elements of the model in a sequence of steps. The load 225
is gradually increasing over time within the deposited elements. Pore pressure development and slope 226
stability are analyzed in both the newly deposited as well as the pre-existing sediments during the 227
deposition of the element rows which define MU1.
228
11
Back-stripping of the stratigraphy allowed to better estimate the real sediment thicknesses at the time of 229
deposition. Using a calculated decompacted MU1 thickness of ~340 m at the location of the Tampen 230
Slide headwall, each row is ~40 m thick. An average compaction of 30 % caused by rapid glacial 231
sediment loading is comparable to previous studies, in which compaction was estimated to up to 40 % 232
(Hjelstuen et al., 2005).
233
Meshing, boundary and initial conditions 234
The mesh used in the modelling consists of 27,000 8-node biquadratic displacement, bilinear pore 235
pressure elements with reduced integration (Fig. 4). The elements have a size of 40x40 m in MU1 and 236
10x40 m in MU2, while a coarser mesh size was vertically adapted down in the model domain. These 237
differences in element size are reasonable, as the uppermost sediment package is the area of interest and 238
as changes in mechanical properties are less pronounced at larger depths (Hamilton, 1976; Karig and 239
Hou, 1992). The element size also increases towards the lateral boundaries. The model does not allow 240
any displacement at its base, while its lateral boundaries are constrained in the x-direction and free at its 241
top. The lateral-landward and bottom boundaries are impermeable (Fig. 4), whereas fluids are free to 242
flow from the surface, where overpressure is zero. The different model units extend over the entire 243
length of the model domain and are permeable at their upper and lower boundaries (Fig. 4).
244
For the initial conditions of the model, we assume that the sediments are normally consolidated, with a 245
void ratio defined according to stress conditions and overpressure defined to be zero. This can be 246
justified as (i) a major landslide (Møre Slide; Fig. 2) is assumed to release overpressure and reset the 247
stress regime to overconsolidated conditions with zero excess pore pressure, and (ii) a long interglacial 248
time period (243-191 ka; MIS 7) preceded the time of initiation of our model (Fig. 4), during which 249
large amounts of fluids are expected to have escaped and overpressures to have dissipated as sediments 250
have been deposited at low rates.
251
3.2 Model runs 252
Based on the age constrains of sequence P4 and the Tampen Slide (Nygård et al., 2005), we suggest that 253
MU1 represents MIS 6 and that the Tampen Slide was initiated at the end of this MIS (~130 ka). We 254
12
initiate our model at the beginning of MIS 6, and then run it in eight steps and a total of 61 kyr, 255
representing the sedimentation history during MIS 6. The added soils are consolidating in the process.
256
Gravitational loads for the individual elements are ramped up during the step, with no load in the 257
beginning and complete load at the end of a step.
258
Uncertainties in timing and sediment decompaction have a large effect on the sedimentation rates. While 259
the thickness of sequence P4 can be estimated with confidence, there are no age dates available from 260
this 340 m thick sequence. In order to address this uncertainty, we ran models with three different 261
sedimentation scenarios to identify situations in which particularly high pore pressures may be 262
generated.
263
The first scenario, considered the reference model, uses constant sedimentation rates of 3.3 m/kyr for 264
MIS 6 and geotechnical values measured on samples from nearby locations (Kvalstad et al., 2005a). The 265
goal of the reference model was to evaluate if constant temporal sediment loading has a destabilizing 266
effect. Previous modelling studies have identified compressibility as a key factor for overpressure 267
generation due to sediment deposition (Urlaub et al., 2012; Urlaub et al., 2015). We therefore use a 268
higher compressibility value for the uppermost layer (MU1) than provided by Kvalstad et al. (2005a) in 269
one scenario.
270
Ice-sheet configurations and sedimentation rates might change during a marine isotope stage (Becker et 271
al., 2018). In the second scenario, the sedimentation rates follow a pattern similar to the last glacial (MIS 272
2), with an increase in sediment accumulation in the second half of the glacial (Hjelstuen et al., 2004).
273
Such an ice sheet configuration has also been suggested for MIS 8 (Fig. 3) (Nygård et al., 2005). In this 274
scenario, three element rows (equivalent to c. 120 m decompacted sediment) are deposited in the first 275
30 ka, and five element rows (equivalent to c. 200 m decompacted sediment) in the last 30 ka. This 276
scenario should test if episodically high sedimentation rates may generate a significant amount of 277
overpressure.
278
Sequence P4 can be separated into three GDF sequences, each having a maximum thickness of 100-200 279
m (Nygård et al., 2005). These seismostratigraphic observations could indicate rapid on-off switching 280
13
of the Norwegian Channel Ice Stream, suggested for other glacials (Nygård et al., 2007; Becker et al., 281
2018). Thus, in the third scenario, the GDF sequences of MU1 are each defined by two rows of high 282
sedimentation rates. These rows were separated from each other by one row with half the sedimentation 283
rate, and each GDF sequence was then deposited over 12 kyr. This model scenario evaluates the effect 284
of pulses of high sedimentation rates on slope stability.
285 286
3.3 Slope stability analysis and earthquake calculation 287
The overpressure ratio (λ*), defined as the excess pore pressure (pe) divided by the vertical effective 288
stress (σ’v) and the excess pore pressure, is a useful measure for the degree of overpressurization of the 289
slope. For example, for a slope gradient of ~1° consisting of homogenous sediment with a friction angle 290
of 30˚, an overpressure ratio of 0.96 is required to induce slope failure without any external force (Urlaub 291
et al., 2015).
292
𝜆∗= (𝑝−𝑝ℎ
𝜎𝑣−𝑝ℎ) = 𝑝𝑒
𝜎′𝑣+𝑝𝑒 (1) 293
For the case that overpressure generated by rapid sedimentation is insufficient to initiate slope failure, 294
we couple the 2D Finite Element Modeling with cyclic loading. Earthquakes can contribute to the 295
destabilization of a slope, as the horizontal component of the earthquake acceleration generates shear 296
stresses (Hampton et al., 1996). According to finite slope stability models and following the approach 297
of ten Brink et al. (2009), earthquake-triggered submarine landslides in soft sediments occur when the 298
shear stress on the slip surface exceeds the undrained shear strength of the sediment (e.g. Morgenstern, 299
1967). This condition is expressed by the Factor of Safety (FoS) as 300
𝐹𝑜𝑆 =𝜎𝑣′∙𝑡𝑎𝑛𝛷𝑐𝑟𝑖𝑡
𝜏+𝐹𝑒𝑞 (2)
301
where σ’v is the vertical effective stress, Φcrit the critical friction angle, τ the shear stress and Feq the 302
earthquake acceleration shear stress parallel to the slope. In order to initiate slope failure (FoS≤1), we 303
calculate 304
𝐹𝑒𝑞= (𝜎𝑣′∙ 𝑡𝑎𝑛𝛷𝑐𝑟𝑖𝑡) − 𝜏 (3) 305
In previous studies (ten Brink et al., 2009; Stigall and Dugan, 2010), the critical horizontal earthquake 306
acceleration ky has been calculated to 307
14 𝑘𝑦 =𝜎𝐹𝑒𝑞
𝑣′+𝑝𝑒=(𝜎𝑣′∙𝑡𝑎𝑛𝛷𝜎 𝑐𝑟𝑖𝑡)−𝜏
𝑣′+𝑝𝑒 (4)
308
where pe is the excess pore pressure.
309
We follow ten Brink et al. (2009) and link the critical acceleration, ky, to the spectral acceleration 310
required for triggering slope failure, kPSA(T=0.75), as 311
𝑘𝑃𝑆𝐴(𝑇=0.75) = 𝑘𝑦
0.15∙3.5 (5)
312
This relation is applied by ten Brink et al. (2009) for the slopes offshore Eastern North America which 313
are geologically and tectonically similar to our study area, and assume the relation to be a reasonable 314
choice for our application. We then relate the obtained kPSA(T=0.75)-value to earthquake magnitude and 315
distance by considering an empirical ground motion prediction equation (GMPE). As no GMPE has 316
been developed according to modern standards based on Norwegian data, we adopt the recent relation 317
by Pezeshk et al. (2015) which is valid for Eastern North America, where ground motion characteristics 318
are similar to our study area.
319 320
4. Results 321
We assess the effect of different scenarios of temporal sediment loading, compressibility contrasts, and 322
a glacimarine sediment layer on pore pressure generation and slope stability. The results are presented 323
as vertical profiles located 10 km downslope from the shelf break (x = 20 km, Fig. 4). This location 324
represents the Tampen Slide headwall (Fig. 2), and likely the onset of failure assuming that the landslide 325
did not develop retrogressively.
326
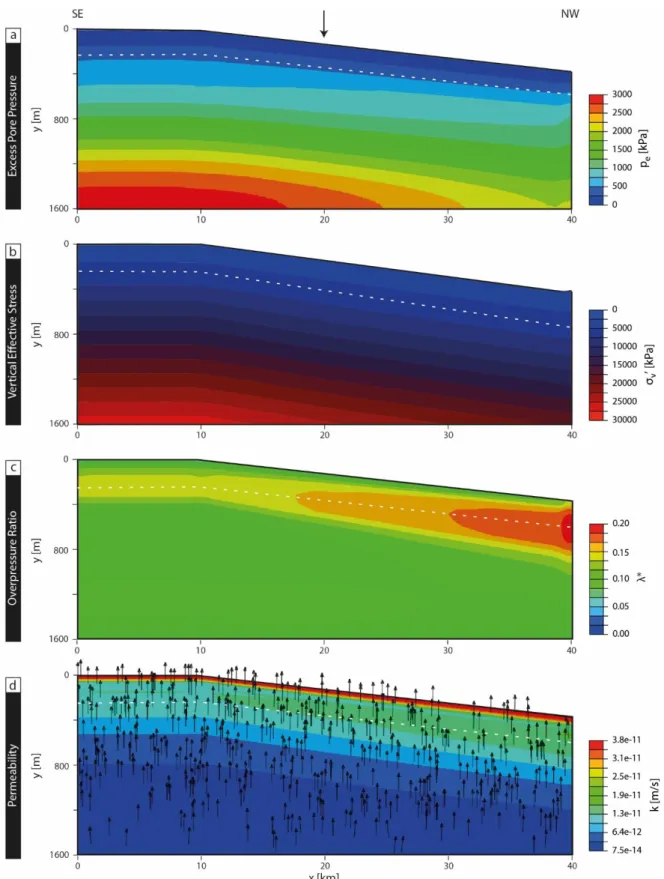
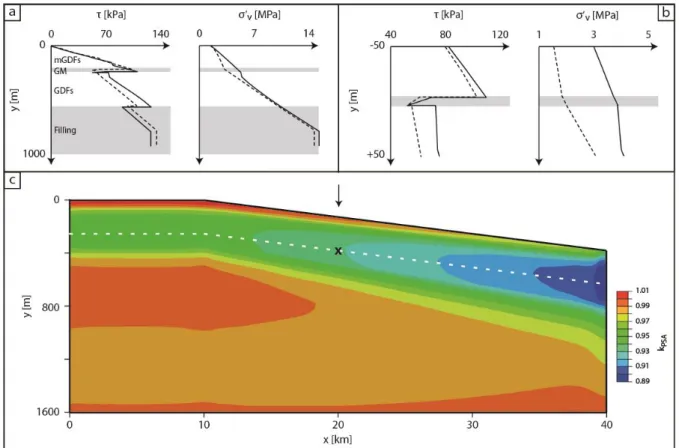
4.1 Reference model 327
Fig. 5 presents the results of the reference model, characterized by constant sedimentation rates and 328
measured hydro-geomechanical sediment properties (Tab. 3), after the 61 ka long time span of MIS 6.
329
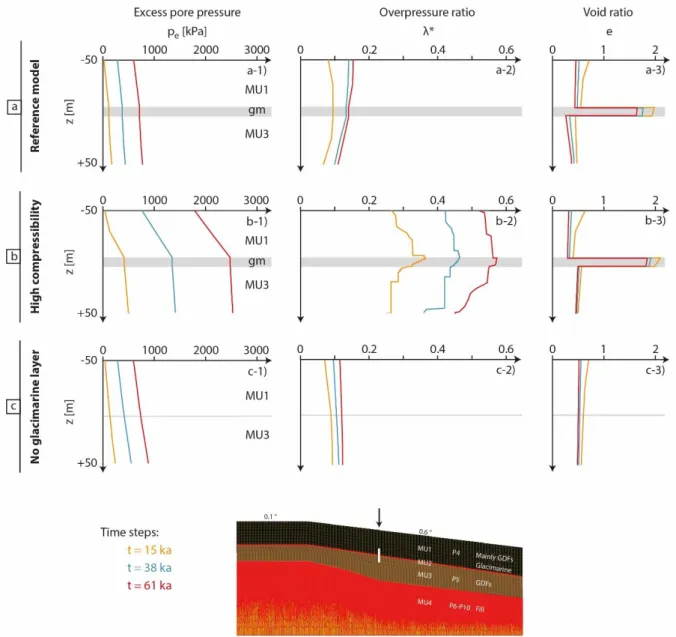
The results show that excess pore pressure (pe) increases continuously with depth and time (Figs. 5a, 330
7a-1) to 800 kPa at ~500 m below seafloor (bsf). Below this level, the excess pore pressure increases to 331
3000 kPa towards the bottom of the model (Fig. 5a). The vertical effective stress (σ’v) is increasing 332
constantly from 0 kPa at the seafloor to 30000 kPa at the base of the model (Fig. 5b).
333
15
The constant sedimentation rates of 3.3 m/kyr during MIS 6 result in maximum overpressure ratios (λ*) 334
of 0.16 at depths of ~200 m bsf, with λ*-values varying from 0.1 to 0.16 within the rapidly-deposited 335
MU1 (Figs. 5c, 7a-2). While λ* rapidly increases during the deposition of the first two rows, its rate of 336
increase is lower during the deposition of the last six rows (Fig. 7a-2). The fluid gradients indicate an 337
eastwards-oriented fluid flow, which is dominated by a vertical component (Fig. 5d). Although sediment 338
depths with maximum overpressure ratios are likely to be affected by the Tampen Slide, less than 16%
339
of the total overburden stress taken up by the excess pore pressure is insufficient to cause slope failure.
340
Thus, constant sedimentation rates in the North Sea TMF during MIS 6 most likely did not generate 341
sufficient excess pore pressure to cause slope failure.
342
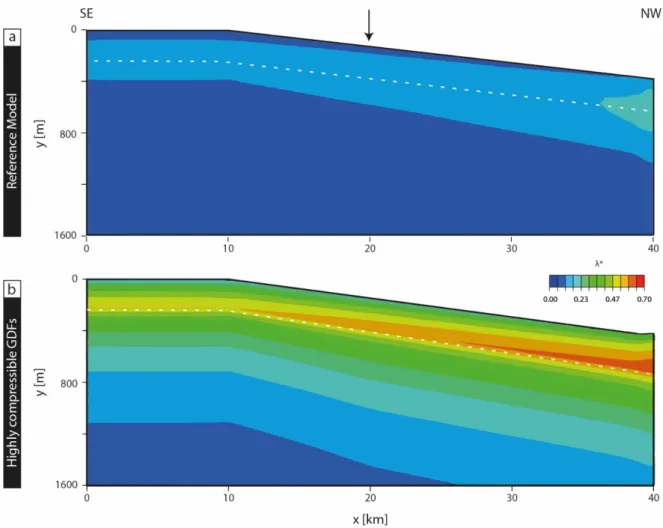
4.1.1 Changes in compressibility 343
Deterministic sensitivity analyses on models used in previous studies (Urlaub et al., 2015) showed a 344
high sensitivity of overpressure generation to compressibility. Therefore, we also ran the reference 345
model under the assumption that the material characterizing MU1 is more compressible than expected.
346
Therefore, the compressibility of MU1 was increased from 0.1 in the reference model to 0.13 for the 347
compressibility test (Tab. 2, Fig. 6). The results from this model run show that the excess pore pressure 348
rises with a steep gradient from the seafloor to values of 2500 kPa at the base of the highly-compressible 349
layers (Fig. 7b-1), and that the pe-values are more than doubled compared to the pe-values in the 350
reference model when using an increased compressibility (Fig. 7a-1). Excess pore pressures increase 351
with a much lower gradient for low-compressible sediment properties in MU1 (Fig. 7a-1). Within the 352
underlying MU3, the excess pore pressures rise with the same gradients for both model runs.
353
This model run results in overpressure ratios of 0.55 at the top of the glacimarine layer at the profile 354
location (MU2, Figs. 6, 7b-2). The highest overpressure ratios of 0.7 occur at the right–hand-size 355
boundary of the model (Fig. 6b), where the deposited sediment package is thickest. Overpressure ratios 356
decrease both atop and below MU2. Both a normal- and a high-compressible MU1 result in overpressure 357
generation with time, with most of the overpressure generated during the first 15 ka (Figs. 7a-2, 7b-2).
358
However, we note that utilizing a higher compressibility results in more significant overpressure ratio 359
increases between the different time steps (Figs. 7a-2, 7b-2). Thus, the model run shows that an increase 360
16
in compressibility from 0.1 to 0.13 has large effects on overpressure generation. An increase of 33 % in 361
compressibility results in an increase of 200 % of overpressure. On the other hand, void ratio values, 362
decreasing through time, are comparable for both the reference and the enhanced compressibility model 363
runs (Figs. 7a-3, 7b-3).
364
4.1.2 Glacimarine layer 365
The modelling shows that the highest overpressure ratios occur within the glacimarine layer (Figs. 5-7).
366
Therefore, this unit could represent the level in the model domain which is closest to fail or to act as a 367
slip plane. The overpressure ratio increases with depth, and reaches its maximum values at the top of 368
the glacimarine layer or slightly above (Figs. 7a-2, 7b-2). The glacimarine layer is furthermore 369
characterized by a higher void ratio, which slightly decreases with time (Figs. 7a-3, 7b-3). While excess 370
pore pressures are more or less constant within the glacimarine layer (Fig. 7a-1, 7b-1), the overpressure 371
ratios decrease in this unit (Fig. 7a-2, 7b-2), which probably can be explained by an increase in vertical 372
effective stresses. Similar pe-gradients are observed for MU1 in the reference model compared to the 373
model scenario from which the glacimarine layer was excluded (Figs. 7a-1, 7c-1). The glacimarine layer 374
results in increased overpressure ratios in MU1 for the compressibility test run (Fig. 7b-1). Removing 375
the glacimarine layer results in lower excess pore pressures and overpressure ratios, and no contrast in 376
the void ratio values (Fig. 7c). The inherited effect of the glacimarine draping sediment layer at the base 377
of the rapidly deposited GDFs is thus an increase in the gradients of both excess pore pressures and 378
overpressure ratios in MU1 as well as a contrast in permeability.
379
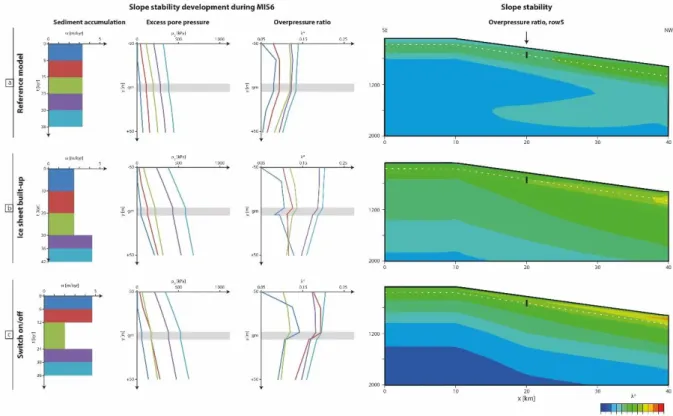
4.2 Variability in sedimentation rates 380
The first five rows of the model, comprising ~200 m of sediments, were activated after different periods 381
to test the effect of different temporal or staged loading on slope stability. In the reference model (Fig.
382
8a), these rows were constantly deposited with a rate of 3.3 m/kyr. During this model run, the excess 383
pore pressure and overpressure ratio at the top of the glacimarine layer steadily increase to values of 384
~450 kPa and 0.13, respectively. While pe is showing a constant increase in time, λ* has a stronger rise 385
during the deposition of rows 1 and 3 (Fig. 8a). We also note that the overpressure ratio is highest within 386
the glacimarine layer itself, but that the differences to the neighboring sediments are small.
387
17
The model run of an ice-sheet build-up scenario (Fig. 8b), with sedimentation rates of 2.4 m/kyr for the 388
first three rows and increased sedimentation rates of 4.2 m/kyr for the last two rows, results in higher 389
pe- and λ*-values at the top of the glacimarine layer compared to the reference model. The excess pore 390
pressure and overpressure ratio increase significantly during the deposition of the first rapidly-loaded 391
row (row 4), and reach a maximum of 0.2 at the depth of the glacimarine layer. The excess pore pressure 392
in MU1 is similar to the excess pore pressure generated in the reference model. The vertical and lateral 393
profiles show that the highest overpressure values of this scenario are not generated within the 394
glacimarine layer, but rather at the interface of the glacimarine layer and the rapidly-deposited GDFs 395
(Fig. 8b).
396
In the switch on/off scenario (Fig. 8c), excess pore pressures increase during the deposition of the four 397
rapidly-deposited rows (4.2 m/kyr, rows 1-2 and 4-5), whereas no change is observed when deposition 398
is slow (2.1 m/kyr, row 3). Overpressure ratios of 0.2 are generated at the top of the glacimarine layer 399
at the end of both pulses of rapid sedimentation. Episodically high sedimentation rates may generate 400
increases of +300 kPa per row in excess pore pressure and +0.07 per row in overpressure ratio. However, 401
episodically high overpressure dissipation starts once the episode of high load is terminated. During the 402
anticipated switch-off phase of the ice stream, the overpressure ratio is significantly decreasing to values 403
of ~0.1 in the glacimarine layer. Unlike the other two scenarios, the switch on/off scenario shows highest 404
overpressure ratios within MU1 and not in the glacimarine layer where overpressure decreases. At the 405
end of the model run (5 rows or 200 m of sediment), the overpressure ratio is ~0.05 higher compared to 406
the reference model for depths affected by the Tampen Slide.
407
In summary, these models show that the excess pore pressure increases either continuously or more 408
abruptly in time depending on the sedimentation pattern. However, the overpressure ratio in the 409
glacimarine layer and MU1 generated after the deposition of the five rows do not significantly vary for 410
the different sedimentation patterns. We also observe that episodically high sedimentation rates cannot 411
compensate for the dissipating pore pressure during periods of low sedimentation. Maximum 412
overpressure ratios develop either at the interface between the glacimarine layer and MU1, or within 413
MU1. Rapid sedimentation rates result in maximum overpressured slopes at depths expected to be the 414
18
base of the Tampen Slide or above, whereas lower overpressures are generated for constant 415
sedimentation rates. The model shows that the maximum overpressure ratio at the end of row 5 is 0.2, 416
and that the totally generated overpressure is low.
417
4.3 Slope stability and the effect of seismic shaking 418
The results obtained from the various models, and particularly the overpressure ratio (λ*) and the Factor 419
of Safety (FoS), were used to analyze slope stability. The FoS, defined by the failure-resisting strength 420
of the sediment divided by failure-inducing stresses (Formula 2), was >1 at any time of deposition, and 421
the slope is therefore considered stable. As sedimentation-related pore pressure generation cannot 422
explain the Tampen Slide, we consider the possibility of having an earthquake as an external trigger 423
mechanism. Highest overpressure ratios (Fig. 7a-2, 7b-2), and shear stress values of up to ~110 kPa are 424
observed within the glacimarine layer of the reference model (Figs. 9a, b), indicating that the slope is 425
closest to failure at this depth not only for the selected profile, but for the entire model. The required 426
additional horizontal loading by earthquakes (Feq) to cause instability is in the order of 1.9 MPa. The 427
critical horizontal earthquake acceleration (ky) at the location of the Tampen Slide headwall at the depth 428
of the glacimarine layer is calculated to 0.49 g, which corresponds to kPSA(T=0.75) = 0.93 g (Fig. 9c). By 429
applying the empirical ground motion prediction equation of Pezeshk et al. (2015), this level of ground 430
shaking can be generated by an earthquake of magnitude M6.9 or larger in the immediate vicinity of the 431
slide headwall, or by an event with M7.5 or larger at a distance of up to 3.5 km from the Tampen Slide 432
headwall.
433 434
5. Discussion 435
Here, we evaluate the effect of different glacial sedimentation patterns and the 10 m-thick glacimarine 436
sediment layer on overpressure generation and slope stability of the North Sea TMF. Potential trigger 437
mechanisms for the Tampen Slide and future slide activity in the ~1˚-dipping North Sea TMF are 438
discussed based on seismic and overpressure quantification. Finally, we discuss the results from this 439
study in a global perspective.
440
5.1 Effect of glacial sedimentation patterns on slope stability 441
19
The modelling shows that excess pore pressures build up due to the deposition of GDFs during MIS 6.
442
The highest excess pore pressures and overpressure ratios are related to increased sediment 443
accumulation in the second half of the model run or during extreme episodic pulses, whereas constant 444
sedimentation rates result in a more stable slope, i.e. with less excess pore pressure generation. However, 445
the magnitude of the resulting overpressure ratios at the end of the glacial stage does not vary 446
significantly between the different models. We explain the lower overpressure ratios generated after 447
time periods with decreased sedimentation rates (Figs. 8b, 8c) by pore pressure dissipation when 448
sedimentation rates were low to medium. The sedimentation rates used for the model are based on 449
stratigraphical constraints (Fig. 2). However, other studies indicate higher sedimentation rates along the 450
Norwegian shelf break (Dimakis et al., 2000; Hjelstuen et al., 2004; Nygård et al., 2007). Previous 451
studies also suggest that shelf-edge glaciations only lasted for short periods (Nygård et al., 2007; Becker 452
et al., 2018). Thus, loading the North Sea TMF over a very short time period with extremely high 453
sediment volumes could generate sufficient overpressure for slope failure. However, in order to fulfill 454
the age constrains of MU1 (61 ka), such periods characterized by extreme loading would have to be 455
compensated by periods characterized by low sedimentation rates, which is rather unlikely during shelf 456
edge glaciations. The model runs indicate that an ice stream needs to be located near the shelf edge for 457
high sedimentation rates to be maintained for most of a glaciation in order to create a slope more 458
vulnerable to fail. Studies from the Gulf of Mexico show that sedimentation rates of 6-9 m/ka resulted 459
in overpressure ratios of 0.7-0.8 (Schneider et al., 2009), indicating that even a doubling of the 460
sedimentation rates at the North Sea TMF would probably not lead to overpressure-driven slope failure.
461
Our models suggest that compressibility has a large effect on overpressure generation (Figs. 6, 7b).
462
Strongly increased overpressure ratios (Fig. 7b-2) indicate that sediments characterized by a higher 463
compressibility could have contributed to slope instability along the gently-dipping seabed of the North 464
Sea TMF. However, compressibility values >0.13 for MU1 would be required to generate sufficient 465
overpressure, which may be within the measuring error. This test showed that small changes in 466
compressibility have a high impact on overpressure generation.
467
20
Numerical slope stability analysis of the Santa Barbara basin of the California borderland suggests that 468
pre-conditioning through rapid sedimentation has controlled the emergence of large, slope-parallel 469
landslides on the northern flank of that basin (Stoecklin et al., 2017). However, high sedimentation rates 470
at the North Sea TMF during glacial stages cannot generate sufficient overpressure to cause slope failure 471
on the ~1˚-dipping seabed. Different temporal sedimentation patterns do not significantly affect the 472
amount of overpressure generated at the end of the model runs. The model scenarios assume 473
overpressure to be zero at the beginning of the simulations, which is a rather conservative estimation.
474
The role of ice load on the continental shelf and fluid migration from Miocene ooze layers have not been 475
included as contributing factors to overpressure generation. Glacial unloading related to a melting 476
Norwegian Channel Ice Stream most likely resulted in fluid migration away from the slope and towards 477
the shelf, making the slope more stable. However, as the Norwegian Channel Ice Stream must have been 478
warm-based, and ice overload did not significantly exceed the water column, ice unloading is probably 479
only having a minor effect. Loading and unloading of the slope by ice sheet advances and retreats has 480
been shown to have only minor effects on continental slope stability (Kratzke, 2018), and can thus be 481
neglected.
482
5.2 Potential of glacimarine deposits acting as a weak layers 483
Bedding-parallel layers may represent so-called weak layers which play a key role in the development 484
of slope failures (Haflidason et al., 2003; Berg et al., 2005; L’Heureux et al., 2013; Locat et al., 2014).
485
However, slopes have been modelled to be prone to fail along preferential horizons at defined depths 486
without the presence of an intrinsic weak layer (Stoecklin et al., 2017). For the North Sea TMF, 487
observations in the seismic profiles show that sediments mainly consisting of GDFs (MIS 6) have been 488
removed above a package consisting of GDFs (MIS 8) during the Tampen Slide (Fig. 2). We note that 489
no glacimarine sediment package has been resolved in the seismic profile of the study area, but 490
deglaciation packages have been observed for the time periods related to MIS 2 and MIS 6 on the Vøring 491
Plateau (Fig. 1) (Haflidason et al., 2003; Lekens et al., 2005). Therefore, we suggest that such a deglacial 492
and/or interglacial package has also existed in the area affected by the Tampen Slide, but has either been 493
eroded by the megaslide or is too thin to be resolved in the seismic profiles (vertical resolution of c. 10 494
21
m, Nygård et al., 2005). The surface parallel to the seafloor, at a depth correlating with the glacimarine 495
sediment deposits, is characterized by highest void ratios, highest overpressure ratios and highest shear 496
stresses (Figs. 7, 9).
497
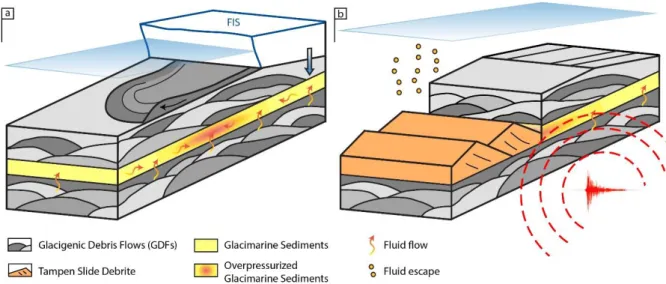
The high permeability of the glacimarine layer could have accommodated vertically-oriented fluid flow 498
(Fig. 10a). At the same time the low-permeable overlying package, mainly consisting of GDFs, acted as 499
a barrier for vertical fluid flow. Combining these two effects would explain the highest overpressures at 500
the very top of the glacimarine layer (Fig. 7). Thus, permeability contrasts linked to the glacimarine 501
layer would significantly contribute to the preconditioning of the Tampen Slide. Gas accumulation 502
below GDFs has also been suggested by ocean bottom seismometer investigations in the Storegga Slide 503
area (Mienert et al., 2005b), and support our hypothesis that GDFs are a trap to vertical fluid flow. We 504
suggest fluids to accumulate at the top of the glacimarine layer.
505
Therefore, we conclude that the glacimarine layer itself or the interface of the glacimarine layer with the 506
overlying GDF-dominated sequence most likely acted as a weak layer for the Tampen Slide (Fig. 10a).
507
Similar failure planes are found in fine-grained depositional units, such as plumite or glacimarine and 508
hemipelagic sediments (Haflidason et al., 2003; Berg et al., 2005), on the mid-Norwegian continental 509
margin, or in laminated glacimarine clays at the upper continental slope off Vesterålen (L’Heureux et 510
al., 2013). Reported excess pore pressures of up to 0.2 within contouritic sediments below GDFs in the 511
Storegga Slide area (Bryn et al., 2003), which also correlate with zones of anomalously low s-wave 512
velocities (Mienert et al., 2005b), support the result of our model simulations. Although the stability at 513
the expected Tampen Slide failure depth is reduced, overpressure-driven slope failure is not suggested.
514
The effect of sedimentological and geotechnical properties of glacimarine layers beneath rapidly 515
deposited glacial debris has previously been discussed at different locations within the North Atlantic.
516
These layers are reported to have higher water contents and lower shear strengths (Lucchi et al., 2012), 517
and are suggested to develop local overpressure zones (Bryn et al., 2003; Mienert et al., 2005b; Berg et 518
al., 2005; Llopart et al., 2014). Coarser-grained glacial deposits overlain by less-permeable glacial 519
sediments in the Barents Sea have been suggested to be charged by fluids and to act as weak beds 520
(Bellwald and Planke, 2018).
521
22
5.3 Quantification of trigger mechanisms of the Tampen Slide 522
It seems that high sedimentation rates alone did not lead to failure of the Tampen Slide, even if using 523
increased compressibility values for the deposited GDFs in MIS 6. Gas hydrates, indicated by the 524
presence of a bottom simulating reflector, are suggested to have contributed to the triggering of the 525
Storegga Slide (Bünz et al., 2003; Mienert et al., 2005a). However, gas hydrates are rather unlikely to 526
be built within GDFs (Bünz et al., 2003; Mienert et al., 2005a), and no gas hydrate indicators have been 527
observed in conventional seismic profiles of the North Sea TMF. Therefore, gas hydrates are rather 528
unlikely to have acted as an additional fluid source affecting overpressure build-up for the Tampen Slide.
529
However, even if not identified in the seismic profiles, the presence of gas hydrates at the North Sea 530
TMF at the age of the Tampen Slide cannot be excluded.
531
The Tampen Slide could have been initiated at a locally steeper slope at the lower continental slope (Fig.
532
2), similarly to which has been proposed for the Storegga Slide (Gauer et al., 2005; Kvalstad et al., 533
2005b), and then developed retrogressively. However, as the lower slope of the North Sea TMF is 534
beyond the main depocenters of GDFs (Fig. 2), initiation in the steepest region could be problematic for 535
the build-up of sufficient pore pressure. The Miocene ooze layer, suggested to favor increased fluid flow 536
in the lower slopes of the Storegga Slide (Riis et al., 2005), is overlain by a significantly thicker 537
Pleistocene sediment sequence in the North Sea TMF, and has thus not been included in the simulations.
538
As the morphology of the Tampen Slide does not indicate retrogressive slide development (Nygård et 539
al., 2005) and as overpressure does not appear sufficient for slope failure at the position of its headwall, 540
we suggest that an external trigger is the most likely cause for the initiation of the Tampen Slide.
541
Our model results show that an earthquake of M6.9 or larger at a short distance from the Tampen Slide 542
headwall could have triggered the Tampen Slide (Fig. 10b). At present, there is still a higher seismicity 543
around the Quaternary depocenters than elsewhere along the Norwegian continental margin (Byrkjeland 544
et al., 2000). An earthquake of magnitude M5.4 occurred in the distal part of the North Sea TMF as late 545
as in 1988 (Norwegian National Seismic Network; www.skjelv.no), in an area where no active 546
postglacial faults have been mapped. Faults with the potential for accommodating earthquakes of such 547
magnitudes have not been identified in the North Sea TMF. However, seismic events in response to 548
23
glacio-isostatic rebound offshore Norway, accommodating earthquakes of M6.5-7 without breaking the 549
surface, are considered to be likely (Bungum et al., 2005). Studies within the Storegga Slide region 550
demonstrated the potential for large postglacial earthquakes to occur and to be able to shake sediment 551
layers to a length and degree, which may lead to slope failure for sediments with a deposition-related 552
low FoS (Solheim et al., 2005; Bungum et al., 2005; Lindholm et al., 2005). Severe seismic loading has 553
also been proposed for slope failures within glacimarine sediments off Vesterålen (L’Heureux et al., 554
2013). Studies from SE Canadian continental slopes suggest that the build-up of overpressure, linked to 555
deposition of GDFs (Aksu and Hiscott, 1992; Hiscott and Aksu, 1994), allows earthquake-triggered 556
failures along slopes with gradients as low as 1° (Tripsanas et al., 2008; Piper, 2014). An earthquake 557
has also been suggested to be the final trigger for submarine mass movements of slopes controlled by 558
high sedimentation rates in the Santa Barbara Basin (Stoecklin et al., 2017). Thus, we suggest an 559
earthquake at the end of MIS 6, coupled with moderate overpressure from rapid sedimentation, to have 560
acted as the additional driving stress necessary for slope failure for the Tampen Slide (Fig. 10b). This 561
earthquake could either have been triggered by stress changes related to sediment deposited on the North 562
Sea TMF itself or by crustal readjustment after the ice sheet retreat, similar to what has been suggested 563
for large slope failures on the continental slope off SE Canada (Piper et al., 2003). Slope stability is 564
reported to increase with increasing frequencies of earthquakes and decreasing sedimentation rates (ten 565
Brink et al., 2016). Thus, an individual high-magnitude earthquake in this seismically moderate region, 566
characterized by high sedimentation rates during glacial stages, seems to be a possible final trigger 567
mechanism. A high peak spectral acceleration with a short duration will not induce slope failure.
568
However, this point has already been accounted for in the approach we follow (ten Brink et al., 2009).
569
The modelling attempt of this study included only one dimension of earthquake shaking, whereas 570
seismic waves in reality affect the sedimentary sequence in three dimensions (Carlton and Kaynia, 571
2016). The lower earthquake frequencies are closer to the resonance frequency of sediment layers and 572
attenuate more slowly within the sediments. Consequently lower earthquake frequencies have longer 573
durations and a higher potential for fluid mobilization than the higher frequencies. Thus, we suggest that 574
lower earthquake frequencies are more important for slope failure initiation (Kramer, 1996).
575
24
Increased submarine landslide activity at glacial-interglacial transitions has previously been documented 576
(Maslin et al., 2004; Owen et al., 2007; Urgeles and Camerlenghi, 2013). We suggest that the earthquake 577
that may have initiated the Tampen Slide took place at the transition into MIS 5, when overpressure 578
ratios and seismic activity are assumed to be highest. This timing probably indicates a large difference 579
between slide initiation at the North Sea TMF and the Storegga Slide, which occurred ~15 kyr after peak 580
glaciation (Haflidason et al., 2005). However, due to sparse chronostratigraphical constrains, we cannot 581
exclude that the Tampen Slide was triggered during the MIS 5 interglacial or later. In that case the 582
Tampen Slide had a similar delay as the Storegga Slide.
583
5.4 Limitations of the numerical modeling study 584
The numerical models incorporate uncertainties resulting from the limited resolution of seismic data for 585
reconstruction of the sediment architecture, stratigraphy, as well as a lack of in-situ physical, 586
mechanical, and seismological properties of the prevalent sedimentary units explained below in detail.
587
There are actually no deep-drilling results available from the area, and geotechnical parameters are 588
scarce. Furthermore, high-resolution 3D seismic data were not available either. Thus, the overall results 589
of the numerical modeling conducted in this study should be understood qualitatively and the provided 590
estimates of pore pressure levels and earthquake magnitudes considered as approximations of these 591
values. Nevertheless, the parameters used are based on extensive geohazard assessment investigations 592
for the nearby Ormen Lange gas field development (Kvalstad et al., 2005; and other) in a comparable 593
geological setting. Aiming to test how slope stability changes with increasing overburden stresses, we 594
used a reasonable range of parameters for the numerical simulations.
595
1) Physical and hydro-geomechanical sediment properties: As no hydro-geomechanical information is 596
available from the North Sea TMF, we used hydro-geomechanical sediment properties measured on 597
samples from the nearby Ormen Lange gas field area (Kvalstad et al., 2005; and others). Even though 598
the composition of glacial sediments are known to vary in time and space (King et al., 1996), the 599
similarity in environmental conditions allow for such a transfer. Due to limits in seismic resolution (max.
600
frequency of c. 10 m; Nygård et al., 2005) and an absence of wells, we summarize the composition of 601
model unit MU1 to be mainly GDFs.
602
25
2) Stratigraphy: We simulated sediment deposition during MIS 6, and followed the suggestions that the 603
Tampen Slide occurred at the end of this marine isotope stage (Nygård et al., 2005). However, the 604
chronology of the North Sea TMF and the suggested date of the Tampen Slide, on which we base the 605
sedimentation rates and overpressure build-up, are not well constrained or understood. Improvements 606
in the chronological framework of the North Sea TMF are thus crucial to improve the modeling of 607
sedimentation-related overpressure and triggering of megaslides.
608
3) Pre-slide stress conditions: Our model further assumed overpressure to be zero at the beginning of 609
the simulations. However, there might be some overpressure at the model initiation, as suggested by 610
lateral fluid migration sourced from Miocene oozes in the explanation of the early Holocene Storegga 611
Slide (Bryn et al., 2005; Riis et al., 2005). However, the pre-slide conditions are impossible to 612
reconstruct with the currently available data.
613
4) Seismological properties: The model was coupled to seismic shaking, which is based on formulas 614
valid for eastern North America (ten Brink et al., 2009). The input parameters for these formulas are not 615
calibrated against Scandinavia, and might be different for our study area. However, we assume a similar 616
response due to similarities in geological and tectonical settings (Pezeshk et al., 2015). Thus, the 617
earthquake triggering the overpressured slopes of the Tampen Slide could have been of lower magnitude 618
than what we modeled in our study.
619
5.5 Implications and global relevance 620
Potential links between climate-controlled sedimentation, slope preconditioning, seismic activity and 621
megasliding are demonstrated by numerical modeling of the Tampen Slide. However, the slopes of the 622
North Sea TMF seem not to have failed in glacial stages with similar sedimentological and seismological 623
conditions to the ones found at the end of MIS 6 (Fig. 3) (Nygård et al., 2005). It is not yet understood 624
why megaslides at the North Sea TMF occurred in some periods characterized by rapid sedimentation, 625
whereas the fan seems not affected by large slope failure in other periods. Megaslides during the last 626
glacial/deglacial cycle have also not been observed along the Barents Sea margin (Hjelstuen et al., 2007).
627
Lateral overpressure migration into the Storegga Slide area (Bryn et al., 2005) or the absence of a 628
deglacial/interglacial sediment package at the base of the GDFs could additionally favor slope stability 629
26
in this period. The observation that the North Sea TMF did not fail during some shelf edge glaciations 630
generating GDFs supports an earthquake as the ultimate trigger mechanism for the Tampen Slide.
631
This study shows that changing glacial sedimentation patterns are not significant for the build-up of 632
overpressure towards the end of glacial stages, but that the generation of overpressure is more depending 633
on the total sediment overload. Our model runs indicate that overpressure ratios increase at a very low 634
rate during periods characterized by glacial sedimentation, which are supposed to be some magnitudes 635
higher compared to interglacial sedimentation rates (e.g. Lekens et al., 2005; Becker et al., 2018). Low 636
seismicity, low interglacial sedimentation rates, and ongoing overpressure dissipation (Byrkjeland et al., 637
2000, Haflidason et al., 1998) result in a margin that at present is more stable than shortly after the last 638
glacial retreat. Dissipating overpressures, related to decreased sedimentation rates and fluids being 639
discharged into the modern system, have been reported by Strout and Tjelta (2005) from the Storegga 640
Slide area and by Dugan and Flemings (2002) for the New Jersey margin. However, dissipating 641
overpressures in the region of the North Sea TMF indicate that overpressures might still be present in 642
the shallow sub-surface of the study area (Fig. 10b).
643
The effect of a glacimarine layer at the base of a package dominated by GDFs is modeled in this study, 644
and could be applied to different TMF systems and glacially-affected margins all over the globe. The 645
deposition of such thin layers seems to be fundamental for the evaluation of major slope failure in 646
different glacial-interglacial cycles. However, there are still numerous uncertainties about weak layers.
647
Probably required for megaslides, our knowledge about the thickness and geotechnical properties of 648
these layers is limited. High-resolution 3D seismic data and deep boreholes for in-situ logging and 649
sampling for geological and geotechnical data will also contribute to a better characterization of weak 650
layers. High-resolution seismic data are also expected to resolve geological expressions on a meter-scale 651
and provide information related to overpressure and fan morphologies relevant for fluid migration.
652
Packages of GDFs overlying the glacimarine layer are suggested to act as seals for vertical fluid flow.
653
Glacial sediments trapping fluids below have been observed in other previously glaciated environments 654
(Dumke et al., 2014; Bellwald and Planke, 2018).
655