Zealand, Using Pore ‐ Water Geochemistry and Numerical Modeling
Min Luo1,2,3 , Marta E. Torres3 , Sabine Kasten4,5,6, and Joshu J. Mountjoy7
1Shanghai Engineering Research Center of Hadal Science and Technology, College of Marine Sciences, Shanghai Ocean University, Shanghai, China,2Laboratory for Marine Geology, Qingdao National Laboratory for Marine Science and Technology, Qingdao, China,3College of Earth, Ocean, and Atmospheric Science, Oregon State University, Corvallis, OR, USA,4Alfred Wegener Institute Helmholtz Centre for Polar and Marine Research, Bremerhaven, Germany,5MARUM- Center for Marine Environmental Sciences, University of Bremen, Bremen, Germany,6Faculty of Geosciences, University of Bremen, Bremen, Germany,7National Institute of Water and Atmospheric Research, Wellington, New Zealand
Abstract
The Tuaheni Landslide Complex (TLC) on the Hikurangi Margin is subject to reactivation, yet the timing of slide emplacement remains unknown. Here we modeled pore‐water data collected from the TLC during the International Ocean Discovery Program (IODP) Expedition 372 in 2017/2018 using a transient‐state reaction‐transport modeling approach. Our simulations reveal that the TLC was formed by two separate depositional events and that the most recent one occurred 12.5 ± 2.5 ka as a coherent ~40 m sediment block that carried its initial pore‐water signature. In addition, we show that the rapid burial of pore‐water SO42−in the pre‐slide sediments consumed an additional ~5.6 × 10⁹mole of CH4over the entire Tuaheni South following the most recent depositional event. Thesefindings provide significant insights into the nature and timing of the TLC and highlight the role of slope failure on subsurface methane cycling on millennial timescales.Plain Language Summary
One remarkable feature of the Tuaheni Landslide Complex (TLC) is the geomorphic signature of ongoing post‐slide deformation of the slide debris, analogous to slow‐moving terrestrial earthflows and rock glaciers. To reconstruct the temporal history of the TLC and evaluate its potential effect on subsurface methane cycling, we modeled the pore‐water data collected from the TLC using a nonsteady‐state model. We demonstrate that this landslide complex was formed by two separate depositional events and that the most recent one occurred 12.5 ± 2.5 ka as a coherent ~40 m sediment block.In addition, modeled response of the methane cycling rates to the slide mass emplacement shows that the rapid burial of pore‐water SO42−in the pre‐slide sediments into the newly developed methanic zone consumed an additional ~70 mol m−2of CH4over the 12.5 kyr that followed the most recent depositional event. This is thefirst study that provides the age constraint of the TLC and highlights the role of slope failure on subsurface methane cycling on millennial timescales.
1. Introduction
Submarine mass failure is widespread on both active and passive continental margins and is recognized as a major offshore geohazard worldwide (Yamada et al., 2012). Triggers for slope failure are manifold; in addi- tion to mechanical forcing such as earthquake motion, the buildup of excess pore pressure caused by sea levelfluctuations, rapid sediment loading, andfluidflow related processes (e.g., gas charging, gas hydrate dissociation, and mud volcanism) has been commonly called upon as controlling factors in slope instability (e.g., Locat & Lee, 2002). Reconstructing the timing and development of past submarine slides is challenging, but this information is key to unravel the mechanisms of landslide initiation.
The pore‐water record is very sensitive to recent perturbations such as changes in methaneflux, organic car- bon rain rate, and rapid sedimentary events (e.g., Chen et al., 2019; de Lange, 1983; Fischer et al., 2013;
Henkel et al., 2011; Henkel et al., 2012; Hensen et al., 2003; Luo et al., 2015; Zabel & Schulz, 2001). In dynamic depositional settings, pore‐water species involved in early diagenetic processes can exhibit
©2020. American Geophysical Union.
All Rights Reserved.
Key Points:
• The Tuaheni Landslide Complex was formed by two separate depositional events
• The most recent depositional event occurred 12.5 ± 2.5 ka as a coherent
~40 m sediment block
• Burial of sulfate in the pre‐slide sediments consumed an additional
~5.6 × 10⁹mol of methane over the entire Tuaheni South
Supporting Information:
• Supporting Information S1
Correspondence to:
M. Luo,
mluo@shou.edu.cn
Citation:
Luo, M., Torres, M. E., Kasten, S., &
Mountjoy, J. J. (2020). Constraining the age and evolution of the Tuaheni Landslide Complex, Hikurangi Margin, New Zealand, using pore-water geo- chemistry and numerical modeling.
Geophysical Research Letters,47, e2020GL087243. https://doi.org/
10.1029/2020GL087243
Received 30 JAN 2020 Accepted 1 MAY 2020
Accepted article online 10 MAY 2020
transient‐state features that hold a historical record of sediment perturbations. For instance, typical nonsteady‐state sulfate profiles (concave‐up, concave‐down,“S”‐type shapes) that developed in response to mass transport deposits (MTDs) have been observed in a variety of marine settings and have been used to constrain the age of the most recent event that disturbed the pore‐water profiles (Henkel et al., 2011;
Henkel et al., 2012; Hensen et al., 2003; Hong et al., 2014; Zabel & Schulz, 2001). Dating such deposits can further be correlated to documented geological events (e.g., earthquakes), thereby shedding light upon the causal links among various geological processes (Henkel et al., 2011; Strasser et al., 2013).
Slope instability is widely recognized along the Hikurangi Margin, especially on its northern sector (Barnes et al., 2010; Collot et al., 2001; Faure et al., 2006; Kukowski et al., 2010; Mountjoy et al., 2009; Pedley et al., 2010; Watson et al., 2019). A prominent example is the Tuaheni Landslide Complex (TLC) where
~145 km2of slope sediment has been destabilized and a large deposit emplaced in water depths of 500–
900 m (Mountjoy et al., 2009). Intensive multibeam bathymetric mapping and 2‐D and 3‐D seismic investi- gations provide significant insight into the surface morphology and intradebris structure of the TLC, which indicates compressional deformation in the upper regions of the slide, extensional deformation in the distal sector, and separation of the deposit into two units by a continuous seismic reflector (Gross et al., 2018;
Mountjoy et al., 2014). One remarkable feature of the TLC is the geomorphic signature of ongoing post‐slide deformation of the slide debris analogous to slow‐moving terrestrial earthflows and rock glaciers (Haeberli et al., 2006; Hungr et al., 2001). Seismic imaging shows that approximately 50% of the entire land- slide is located within the gas hydrate stability zone (GHSZ) and that the transition from a compressional to an extensional regime of the slide debris coincides with the predicted landward upper limit of the GHSZ at
~650 mbsl (meters below sea level) (Gross et al., 2018; Mountjoy et al., 2014). This observation led to the hypothesis that slide reactivation was associated with the occurrence of gas hydrate within the TLC debris (Mountjoy et al., 2014). The TLC was drilled with the MeBo200 during the RVSONNEexpedition in 2016 with the aim of unraveling the factors controlling slope destabilization on the northern Hikurangi Margin (Huhn, 2016). Subsequently, IODP Expedition 372 in 2017/2018 revisited this area to further test the hypoth- eses that link gas hydrates to the creeping behavior of the TLC (Pecher et al., 2019). Analysis of drill‐core sediments from IODP Site U1517 and reinterpretation of 3‐D seismic data have led to the inference that the lower unit of the landslide debris is a minimally disturbed primary depositional unit and that deforma- tion is concentrated in the upper ~40 m thick unit (Couvin et al., 2020).
In this study, we apply a transient‐state reaction‐transport model to simulate the temporal development of the pore‐water system in the extensional section of the TLC. We primarily use data from IODP Site U1517 but also include available MeBo200 data to extend our interpretations toward a more regional view. Our model results provide information on the thickness, timing, and nature of the slide package, which are con- sistent with lithostratigraphic observations and with recent models of gas hydrate dynamics in this region.
We also show that not enough methane is generated in situ to sustain gas hydrate formation, such that the hydrate deposits recovered below the TLC must have a deep or recycled supply of methane. Our results of intensified anaerobic oxidation of methane stimulated by sulfate present in the pre‐slide sediments can have significant implications for methane budgets along continental margins that experience slope failure, illustrating the role that sediment failure has on the subsurface methane cycling.
2. Materials and Methods
2.1. Sampling
During the RVSONNE“SLAMZ”expedition, conventional gravity coring sampled the upper ~3 m of the TLC and Site GeoB20831 was then drilled using the robotic seafloor drill rig MARUM‐MeBo200 to ~80 mbsf (meters below seafloor). Site GeoB20831 targeted the extensional sector of TLC at ~720 m water depth and was complemented with Site GeoB20803, located just upslope to the NW of Site GeoB20831 but also in the extensional sector of the slide (Figure 1). The recovered sediments at Sites GeoB20803 and GeoB20831 are mainly composed of clayey silt, but most of sediments in the interval between ~30 and 60 mbsf were lost dur- ing MeBo200 drilling operations (Huhn, 2016). The pore water was extracted using rhizon samplers for grav- ity cores and a titanium squeezer for MeBo200 cores. IODP Expedition 372 Site U1517 was drilled at approximately the same location as GeoB20831. Recovery was significantly better for Site U1517, which shows that the dominant lithology in the landslide is clayey silt to silty clay with sandy interbeds. The full
10.1029/2020GL087243
Geophysical Research Letters
cored section to ~180 mbsf was divided intofive lithostratigraphic units (I–V), with the base of the TLC being placed at the boundary of Units III and IV at ~67 mbsf (Figure S1 in the supporting information) (Pecher et al., 2019). Pore‐water and headspace hydrocarbon samples were collected following the IODP routine protocols detailed in Pecher et al. (2019).
2.2. Geochemical Analyses
We report sulfate (SO42−), total alkalinity (TA), and ammonium (NH4+) data for Sites GeoB20803 and GeoB20831 with the aim of documenting similar pore‐water features in the extensional sector of the TLC.
Detailed analytical methods for SO42−, TA, and NH4+are provided in the supporting information. Pore‐ water, hydrocarbon, and solid phase data for Site U1517 used in this study were analyzed onboard the JOIDES Resolution. All the analytical methods are given in the supporting information.
2.3. Reaction‐Transport Modeling
A one‐dimensional reaction‐transport model was applied to simulate two solid phases (POC and adsorbed NH4+),five dissolved species (SO42−, CH4, NH4+, Ca2+, and Mg2+), and TA. We assume that POC and adsorbed NH4+
are transported through the sediments only by burial with prescribed compaction; this assumption is justified because we are only concerned with anaerobic diagenesis below the bioturbated Figure 1.(a) Tectonic setting of New Zealand. (b) Bathymetric map showing the sampling sites. (c) Seismic profile In‐Line 1778 crossing Site U1517 with inter- preted key horizons. (d) Interpreted seismic units on In‐Line 1778 in accordance with lithostratigraphic units. The depth interval of gas hydrate occurrence inferred from Cl−anomalies is marked by yellow color on the lithologic unit column. Figures are modified from Pecher et al. (2019).
zone. We assume that solutes are transported only by molecular diffusion and pore‐water burial. Aqueous fluid advection is neglected here because seismic data indicate that only free gas is present beneath the TLC debris (Gross et al., 2018) and pore‐water profiles show no indication of aqueousfluid advection (Pecher et al., 2019). Major reactions considered in the model are particulate organic carbon (POC) degrada- tion via sulfate reduction (POCSR), methanogenesis (ME), anaerobic oxidation of methane (AOM), authi- genic carbonate precipitation, and NH4+adsorption by sediment particles. Note that in our model TA was approximated by carbonate alkalinity (HCO3−+ 2CO32−) that makes up most of the TA in typical anoxic sediments (Sauvage et al., 2014). Therefore, the changes of TA were assumed to be only controlled by the bicarbonate (HCO3−) production via POC degradation and AOM and by its consumption via authigenic car- bonate precipitation. A full description of the model can be found in the supporting information.
3. Results and Discussion
3.1. General Geochemical Trends
The pore‐water data from Site U1517 have been published in the Expedition 372 report for this site (Pecher et al., 2019). Here we briefly summarize the general downcore trends of the pore‐water species of interest.
The SO42−profile features a quasi‐linear decrease trend that appears to represent a quasi‐steady‐state con- dition. However, the two distinct peaks in the profiles of TA and NH4+and a decreasing trend of Ca2+with different gradients point to a characteristic transient‐state system (Figure S1). The observed repetition of the diagenetic sequence is ascribed to rapid burial of sediments by the emplacement of an overlying slide mass;
that is, not enough time has elapsed since the deposition for diffusion to erase the different concentration gradients of pore‐water species in the stacked sediment packages. Furthermore, POC contents generally vary between 0.2 and 1.5 wt.% without a prominent downcore trend, also pointing to a transient change in POC flux at the seafloor most likely resulting from nonconstant sediment deposition (Figure S1). Although com- plete pore‐water profiles of MeBo200 cores are lacking due to poor recovery between ~30 and 60 mbsf, the available MeBo200 data generally follow the downcore trends of those of Site U1517 (Figure S1), indicating that the transient pore‐water system is not a localized effect.
The nonsteady‐state pore‐water profiles induced by MTDs are common in continental margin sediments and were well exemplified in dynamic depositional settings, such as the Argentine Basin (Henkel et al., 2011;
Henkel et al., 2012; Hensen et al., 2003), the Krishna‐Godavari Basin of eastern Indian margin (Hong et al., 2014), the Congo deep‐sea fan (Zabel & Schulz, 2001), and the Japan Trench (Strasser et al., 2013).
In contrast to previous studies where SO42−profiles exhibited diagnostic nonsteady‐state shapes (e.g.,“S” and kink types), Site U1517 has a quasi‐linear SO42−profile without any residual SO42−concentration in the fast‐buried sediment section. Therefore, the nearly re‐equilibrated SO42−profile of Site U1517 cannot be used to ambiguously determine the age of the most recent depositional event, but it provides a constraint on its minimum age. Because of this limitation, we relied on the transient‐state profiles of TA, NH4+, and Ca2+to further estimate the time elapsed since the emplacement of the most recent slide.
3.2. The Nature and Timing of TLC
Based on results from the seismic and lithostratigraphic observations (Figures 1 and S1), we tested the fol- lowing three scenarios using the transient‐state reaction‐transport modeling to uncover the nature and tim- ing of the TLC (Figure S2).
3.2.1. Scenario 1: Remobilization of a Highly Homogenized 40 m Thick Sediment Block
In this scenario, we assume that the TLC is composed of two depositional events corresponding to lithostra- tigraphic Units II and III and that the remobilized sediment package in the later event (3–42 mbsf) was well mixed during slide transport and thus pore‐water concentrations were homogenized to seawater values. The pore‐water profiles prior to the emplacement of the most recent depositional event (pre‐slide) were con- strained by the measured data below 42 mbsf, assuming that the depth of sulfate‐methane transition (SMT) is the same as that of the present‐day condition (17 mbsf) (Figure S3). Following slope failure, each cell in the upper 40 m was assigned seawater values for all dissolved species, whereas the underlying cells were shifted downward and carried their original concentrations (Figure 2a). The simulation then continued using the average post‐event sedimentation rate of 0.03 cm year−1estimated from the ~3 m Holocene hemi- pelagic drape. A compilation of all the parameters applied in the steady‐state and transient‐state modeling runs is given in Tables S3 and S4, respectively.
10.1029/2020GL087243
Geophysical Research Letters
The observed SO42−concentration profile could be simulated after running the model for 50 kyr (Figure 2a).
However, when the model was run for 50 kyr to satisfy the sulfate constraints, the simulated profiles of TA, NH4+
, and Ca2+notably deviated from the measured data; rather, running the model for 25 kyr yields Figure 2.(a) Transient state model results showing the evolution of SO42−, TA, and NH4+starting from the initial condition assuming a homogenized 40 m sediment block with pore‐water constituents characterized by seawater values. (b) Transient state model results showing the evolution of SO42−, TA, and NH4+starting from the initial condition assuming an intact 40 m sediment block with pore‐water constituents maintaining original values before being remobilized. The bestfits to the measured SO42−, TA, and NH4+were achieved after running the model for 10–15 kyr. (c) Transient state model results showing the evolution of SO42−, TA, and NH4+starting from the initial condition assuming an intact 65 m sediment block with pore‐water constituents maintaining original values before being remobilized. Note that the evolutions of CH4, Ca2+, and Mg2+in the three scenarios are shown in Figure S4. Red dots represent measured data.
optimalfits for TA, NH4+, and Ca2+(Figures 2a and S4). If the model is run longer than 50 kyr, none of the measured profiles can be simulated (figures not shown). Since we could notfit all measured pore‐water spe- cies using a single elapsed timeframe, we conclude that our assumption of deposition of a homogenized 40 m sediment section of slide debris is not warranted. Hence, we dismiss the likelihood of the emplacement of a well‐mixed, homogenous sediment package during the most recent depositional event.
3.2.2. Scenario 2: Deposition of a Relatively Intact 40 m Sediment Block
Similar to Scenario 1, in Scenario 2 we also assume that the TLC is com- posed of two separate depositional events with the recent one being 40 m in thickness, but in this case we assume that the 40 m sediment block was transported downslope as an intact sediment block. The model was first run to steady state to obtain pore‐water profiles of pre‐slide setting, as we did for Scenario 1. We then reconstructed the pore‐water profiles for an intact remobilized sediment block constrained by the data in upper the 40 mbsf (Figure S5). Instead of using seawater values, we assigned the modeled pore‐water concentrations to each cell in the upper 40 m of the pre‐slide setting. As shown in Figure 2b, the residual SO42−was comple- tely consumed due to POCSR and AOM after ~10 kyr. This timing repre- sents the minimum age of the most recent slide, since no information is recorded once the residual SO42−in the pre‐slide sediment was totally consumed. The measured profiles of TA and NH4+
are bestfitted after a period of 10–15 kyr (Figure 2b). Hence, we infer that the recent slide took place approximately 12.5 ± 2.5 ka. It is apparent that our modeled profiles of CH4and Mg2+do not reproduce the observed data (Figure S4). The much lower measured CH4concentrations relative to the model predic- tion are caused by a great loss of CH4via degassing following core retrieval and sampling, which is common for headspace CH4measurements. The prominent deviation of Mg2+and Ca2+concentrations predicted by the simulation from the measured ones is attributed to ash alteration reac- tions and accompanying secondary clay mineral formation (e.g., Murray et al., 2018). The ash alteration reactions were also evidenced by an increase in Sr2+concentrations accompanied by a decrease in87Sr/86Sr at Site U1517 (Screaton et al., 2019). Although these reactions were not included in the model reaction terms, they do not significantly affect our age estimation of the TLC.
Reconstructing the pore‐water profiles for the pre‐slide setting is chal- lenging because sulfate data, a key constraint for organic matter degra- dation and AOM, do not exist. The age estimate derived from this kind of nonsteady‐state modeling exercise is highly dependent on the assumed initial conditions. Therefore, we tested the sensitivity of our results to two additional depths of the pre‐slide SMT of 11 and 23 mbsf to compare it with our baseline model (SMT = 17 mbsf). Simulated evolutions of pore‐water profiles for the sensitivity analysis are presented in Figures S6 and S7. The sensitivity tests show that a variation in the depth position of the SMT of ±6 m yields the age estimation approximately ranging from 5 to 15 kyr.
Dependent on the lithology, rheology, and failure kinematics, when slope failure occurs, the slide mass can be mobilized asfluidized sediment with unrecognizable internal sedimentary structure. However, our model results do not support this scenario. Instead, we suggest that slope failure in the TLC does not remold and homogenize the entire slide mass; rather, the block's internal structure and pore‐water signature are main- tained during remobilization, and the extensional sector continues creeping.
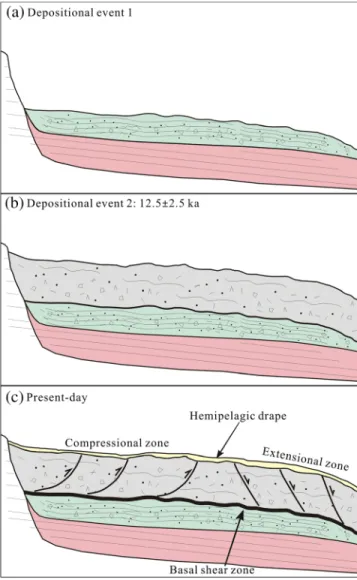
Figure 3.Cartoon illustrating the evolutionary history of Tuaheni Landslide Complex. (a) Depositional Event 1 corresponding to the lithostratigraphic Unit III. (b) Depositional Event 2 approximately at 12.5 ± 2.5 ka. The relocated materials were represented by the lithostratigraphic Unit II. (c) Present‐day condition with TLC being overlain by the thin hemipelagic drape corresponding to lithostratigraphic Unit I. The sediment block remobilized during depositional Event 2 is hypothesized to be slowly creeping along the basal shear zone at the boundary of lithostratigraphic Unit II/III based on the seismic
interpretations of Mountjoy et al. (2014) and Gross et al. (2018). Note that the coloration of sediment blocks highlights the different depositional events that happened in different time periods.
10.1029/2020GL087243
Geophysical Research Letters
3.2.3. Scenario 3: Deposition of a Relatively Intact 65 m Sediment Block
In Scenario 3, we test the scenario that the entire slide mass (Units II & III) was remobilized as one single block rather than two separate depositional events; that is, we assume that the 65 m intact sediment block was redeposited instantaneously on top of the pre‐slide sediments. To achieve this, we simply changed the thickness of the intact block in Scenario 2 to 65 m and maintained other assumptions and model approaches.
Under this circumstance, measured SO42−data were reproduced when running the model for 40 kyr, but the modeled TA and NH4+profiles failed to simulate the observations (Figure 2c). Thus, we postulate that the scenario of emplacing a 65 m intact sediment block as a single slide mass is unlikely.
In summary, our simulations indicate that the TLC was formed by two depositional events as illustrated in Figure 3. The earlier event corresponds to lithostratigraphic Unit III, followed by the recent emplacement of the later event represented by lithostratigraphic Unit II. We infer that the emplacement of this most recent
~40 m thick sediment took place at 12.5 ± 2.5 ka. This event did not occur as a catastrophic failure in which the whole sediment block was well mixed and homogenized; instead, the sediments were remobilized as a coherent sediment package downslope.
3.3. Consistency With Other Independent Findings 3.3.1. Seismic and Lithologic Observations
Seismic imaging shows that the TLC is composed by two landslide debris units with distinct seismic facies separated by a clear but discontinuous intradebris reflector (Gross et al., 2018; Mountjoy et al., 2014).
These two seismic units correspond to lithostratigraphic Units II (~3–41 mbsf) and III (~41–66 mbsf) recog- nized by coring at Site U1517 (Figure 1). Lithologically, Unit II is characterized by very thin to thin‐bedded sand and mud sequences interpreted to represent a succession of stacked turbidites (Figure S1). The presence of highly irregular basal contacts, small‐scale subvertical microfaults, and contorted beds reflects syn‐emplacement or postemplacement deformation related to landslide processes or earthquakes. The bed thickness is larger, and overall, the grain size is smaller in Unit III compared to Unit II. The clayey silt inter- vals with clasts and convolute bedding likely represent plastically deformed, matrix‐supported MTDs (Pecher et al., 2019). More recently, Unit III was interpreted as in situ channelfill deposits rather than part of the slide mass, thus being genetically not linked to Unit II (Couvin et al., 2020). Therefore, the differences in seismic facies and lithology between lithostratigraphic Units II and III are consistent with ourfinding that the TLC was formed by two separate depositional events or that the slide mass was only restricted to Unit II.
In addition, lithostratigraphic results show that the debris mass is overlain by a 3 m thick, hemipelagic sedi- ment drape of Holocene age. This means that the formation of the TLC could not have occurred prior to the Holocene, which serves as support for our age estimate of the most recent emplacement of slide mass (12.5 ± 2.5 ka).
3.3.2. Recent Gas Hydrate Formation
Screaton et al. (2019) attributed the observed positive anomalies in pore‐water chloride (Cl−) concentrations between ~90 and 179 mbsf at Site U1517 to recent gas hydrate formation. By simulating the broad maximum of the Cl−profile, these authors showed that the recent gas hydrate formation was caused by rapid sedimen- tation due to the emplacement of a slide mass. An optimalfit to the data was achieved when using the assumptions of a ~40 m thick slide mass emplaced at ~11 ka (Screaton et al., 2019). This completely indepen- dent modeling exercise lends further support for our postulated nature and timing of the TLC.
3.4. Effect of the Recent Slide Event on Subsurface Methane Cycling
Our model results predict that, under present‐day conditions, methanogenesis generated the maximum CH4
concentration of ~42 mM at the base of the modeled sediment column (150 mbsf). This value is lower than the methane concentration needed to sustain the observed gas hydrate present below 100 mbsf following the algorithm of Tishchenko et al. (2005) (Figure S4). The discrepancy between in situ methane production and methane hydrate presence points to an additional deeper methane source. Transport of methane to the GHSZ from depth was postulated by Burwicz et al. (2011) and Piñero et al. (2013) to explain the occurrence of gas hydrate deposits worldwide; these authors show that upward methane supply is needed to produce enhanced gas hydrate accumulation along continental margins, which cannot be sustained by in situ methanogenesis alone.
Rapid emplacement of the slide mass at Site U1517 led to methane release from gas hydrate dissociation as hydrates were buried beneath the base of GHSZ, which was followed by gas hydrate regeneration when the released methane ascended into the GHSZ (Screaton et al., 2019). In addition to influencing gas hydrate dynamics, the emplacement of a recent slide mass also played a role in regulating AOM in shallow sediments. Rate profiles of POCSR, methanogenesis, and AOM at 5, 10, 15, and 40 ka under Scenario 2 are shown in Figure S8. Because of the assumption of an instantaneous burial of the pre‐slide sediments, POCSR and AOM both occur in the methanic zone before the residual sulfate in the pre‐slide sedi- ments was completely depleted. Upon the emplacement of the recent slide mass, SO42−in the pre‐slide sediments was buried into the methanic zone, stimulating AOM at the interface between the remobilized sediment block and pre‐slide sediments (Figures S2 and S8). As a result, the depth‐integrated AOM rate was high when the emplacement occurred at approximately 12.5 ka and decreased significantly since then as trapped sulfate was consumed (Figure 4). If we assume that the AOM rate under the condition of no‐slide emplacement is the same as the present‐day value (Table S5), we can estimate that an additional 70 mol m−2of CH4was consumed by AOM due to the burial of SO42−over the time period of 12.5 kyr that followed the most recent landslide emplacement. Considering the area of the entire Tuaheni South landslide debris of ~80 km2(Mountjoy et al., 2009), we infer that ~5.6 × 10⁹mole of CH4was con- sumed solely by the buried SO42−since the most recent slide emplacement. If methanogenesis has proceeded for the last 12.5 kyr at the same rate as under present‐day conditions (Figure S8 and Table S5), the amount of CH4produced in the Tuaheni South is equivalent to ~1.4 × 10¹⁰mol. This means that ~40% of methane pro- duced by methanogenesis was consumed by the enhanced AOM due to the recent slide event. As slope fail- ure is widespread on both active and passive continental margins, burial of pore‐water SO42−, an important electron acceptor for microbial metabolism of CH4, may have a significant impact on subsurface CH4 cycling, gas hydrate formation, and biosphere on millennial timescales.
4. Conclusions
Several numerical modeling tests were applied to simulate the observed nonsteady‐state pore‐water profiles at Site U1517 with the aim of understanding the nature and timing of the TLC. Our results show that the TLC was formed by two depositional events with the most recent slide emplacement happening 12.5 ± 2.5 ka and that this recent event remobilized the debris mass as an intact sediment block preserving its initial pore‐water signature. The emplacement of the slide mass buried pore‐water SO42−into the metha- nic zone, thereby influencing subsurface carbon cycling by providing additional but limited amount of elec- tron acceptors for oxidizing CH4. Ourfindings have implications for elucidating the mode of slope failure and highlight the potential important role of slide emplacements for subsurface methane cycling on millennial timescales.
References
Barnes, P. M., Lamarche, G., Bialas, J., Henrys, S., Pecher, I., Netzeband, G. L., et al. (2010). Tectonic and geological framework for gas hydrates and cold seeps on the Hikurangi subduction margin, New Zealand.Marine Geology,272(1‐4), 26–48. https://doi.org/10.1016/j.
margeo.2009.03.012
Burwicz, E. B., Rüpke, L., & Wallmann, K. (2011). Estimation of the global amount of submarine gas hydrates formed via microbial methane formation based on numerical reaction‐transport modeling and a novel parameterization of Holocene sedimentation.
Geochimica et Cosmochimica Acta,75(16), 4562–4576.
Chen, L., Luo, M., Dale, A. W., Rashid, H., Lin, G., & Chen, D. (2019). Reconstructing organic matter sources and rain rates in the southern West Pacific Warm Pool during the transition from the deglaciation period to early Holocene.Chemical Geology,529, 119291. http://
www.sciencedirect.com/science/article/pii/S0009254119303985
Collot, J.‐Y., Lewis, K., Lamarche, G., & Lallemand, S. (2001). The giant Ruatoria debris avalanche on the northern Hikurangi margin, New Zealand: Result of oblique seamount subduction.Journal of Geophysical Research,106(B9), 19271–19297. https://doi.org/10.1029/
2001JB900004
Couvin, B., Georgiopoulou, A., Mountjoy, J. J., Amy, L., Crutchley, G. J., Brunet, M., et al. (2020). A new depositional model for the Tuaheni Landslide Complex, Hikurangi Margin, New Zealand.Geological Society, London, Special Publications,500, SP500‐2019‐180. https://doi.
org/10.1144/SP500‐2019‐180 Figure 4.Changes of depth‐integrated AOM rates over the last 12.5 kyr under Scenario 2 (solid curve). The dash line represents the AOM rate without the emplacement of the recent slide mass.
10.1029/2020GL087243
Geophysical Research Letters
Acknowledgments We thank the scientific parties, technical staff, and crews of IODP Expeditions 372 and 375 and SONNE Expedition SO247. Shipboard data of JOIDES Resolutionare available from the IODP database (http://iodp.tamu.
edu/database/). MeBo200 data used in this study are available from Mendeley data repository (https://doi.org/
10.17632/wr384w4fjg.1). This research was partially funded by NSF Grant OCE‐1753665 to M. E. Torres and by NSFC Grants 41730528 and 91858208 to M. Luo. J. J. Mountjoy was funded by the Royal Society of New Zealand Marsden Fund Grant NIW1603. We thank Rose M. Cory (the editor of GRL) and two anonymous reviewers for their constructive comments on the manuscript.
de Lange, G. J. (1983). Geochemical evidence of a massive slide in the southern Norwegian Sea.Nature,305(5933), 420–422.
Faure, K., Greinert, J., Pecher, I. A., Graham, I. J., Massoth, G. J., de Ronde, C. E. J., et al. (2006). Methane seepage and its relation to slumping and gas hydrate at the Hikurangi margin, New Zealand.New Zealand Journal of Geology and Geophysics,49(4), 503–516.
https://doi.org/10.1080/00288306.2006.9515184
Fischer, D., Mogollón, J. M., Strasser, M., Pape, T., Bohrmann, G., Fekete, N., et al. (2013). Subduction zone earthquake as potential trigger of submarine hydrocarbon seepage.Nature Geoscience,6(8), 647–651. https://doi.org/10.1038/ngeo1886
Gross, F., Mountjoy, J. J., Crutchley, G. J., Böttner, C., Koch, S., Bialas, J., et al. (2018). Free gas distribution and basal shear zone devel- opment in a subaqueous landslide—Insight from 3‐D seismic imaging of the Tuaheni Landslide Complex, New Zealand.Earth and Planetary Science Letters,502, 231–243. http://www.sciencedirect.com/science/article/pii/S0012821X18305338, https://doi.org/10.1016/
j.epsl.2018.09.002
Haeberli, W., Hallet, B., Arenson, L., Elconin, R., Humlum, O., Kääb, A., et al. (2006). Permafrost creep and rock glacier dynamics.
Permafrost and Periglacial Processes,17(3), 189–214. https://onlinelibrary.wiley.com/doi/abs/10.1002/ppp.561
Henkel, S., Schwenk, T., Hanebuth, T. J. J., Strasser, M., Riedinger, N., Formolo, M., et al. (2012). Pore water geochemistry as a tool for identifying and dating recent mass‐transport deposits. In Y. Yamada, K. Kawamura, K. Ikehara, Y. Ogawa, R. Urgeles, D. Mosher, et al.
(Eds.), (pp. 87–97). Netherlands: Springer.
Henkel, S., Strasser, M., Schwenk, T., Hanebuth, T. J. J., Hüsener, J., Arnold, G. L., et al. (2011). An interdisciplinary investigation of a recent submarine mass transport deposit at the continental margin off Uruguay.Geochemistry, Geophysics, Geosystems,12, Q08009.
https://doi.org/10.1029/2011GC003669
Hensen, C., Zabel, M., Pfeifer, K., Schwenk, T., Kasten, S., Riedinger, N., et al. (2003). Control of sulfate pore‐water profiles by sedimentary events and the significance of anaerobic oxidation of methane for the burial of sulfur in marine sediments.Geochimica et Cosmochimica Acta,67(14), 2631–2647. https://doi.org/10.1016/S0016‐7037(03)00199‐6
Hong, W.‐L., Solomon, E. A., & Torres, M. E. (2014). A kinetic‐model approach to quantify the effect of mass transport deposits on pore water profiles in the Krishna‐Godavari Basin, Bay of Bengal.Marine and Petroleum Geology,58, 223–232. http://www.sciencedirect.
com/science/article/pii/S0264817214002219
Huhn, K. (2016). Cruise Report SONNE SO247‐SlamZ: Slide activity on the Hikurangi Margin. Retrieved from
Hungr, O., Evans, S. G., Bovis, M. J., & Hutchinson, J. N. (2001). A review of the classification of landslides of theflow type.Environmental and Engineering Geoscience,7(3), 221–238.
Kukowski, N., Greinert, J., & Henrys, S. (2010). Morphometric and critical taper analysis of the Rock Garden region, Hikurangi Margin, New Zealand: Implications for slope stability and potential tsunami generation.Marine Geology,272(1), 141–153. http://www.science- direct.com/science/article/pii/S002532270900142X
Locat, J., & Lee, H. J. (2002). Submarine landslides: Advances and challenges.Canadian Geotechnical Journal,39(1), 193–212. https://doi.
org/10.1139/t01‐089
Luo, M., Dale, A. W., Wallmann, K., Hensen, C., Gieskes, J., Yan, W., & Chen, D. (2015). Estimating the time of pockmark formation in the SW Xisha Uplift (South China Sea) using reaction‐transport modeling.Marine Geology,364, 21–31. http://www.sciencedirect.com/
science/article/pii/S0025322715000730
Mountjoy, J. J., McKean, J., Barnes, P. M., & Pettinga, J. R. (2009). Terrestrial‐style slow‐moving earthflow kinematics in a submarine landslide complex.Marine Geology,267(3), 114–127. http://www.sciencedirect.com/science/article/pii/S0025322709002461 Mountjoy, J. J., Pecher, I., Henrys, S., Crutchley, G., Barnes, P. M., & Plaza‐Faverola, A. (2014). Shallow methane hydrate system controls
ongoing, downslope sediment transport in a low‐velocity active submarine landslide complex, Hikurangi Margin, New Zealand.
Geochemistry, Geophysics, Geosystems,15, 4137–4156. https://doi.org/10.1002/2014GC005379
Murray, N. A., McManus, J., Palmer, M. R., Haley, B., & Manners, H. (2018). Diagenesis in tephra‐rich sediments from the Lesser Antilles Volcanic Arc: Porefluid constraints.Geochimica et Cosmochimica Acta,228, 119–135. http://www.sciencedirect.com/science/article/
pii/S0016703718301212
Pecher, I. A., Barnes, P. M., LeVay, L. J., & the Expedition 372 Scientists (2019). Creeping gas hydrate slides. InProceedings of the International Ocean Discovery Program(Vol. 372A, pp. 1–40). College Station, TX: International Ocean Discovery Program. https://doi.
org/10.14379/iodp.proc.14372A.12019
Pedley, K. L., Barnes, P. M., Pettinga, J. R., & Lewis, K. B. (2010). Seafloor structural geomorphic evolution of the accretionary frontal wedge in response to seamount subduction, Poverty Indentation, New Zealand.Marine Geology,270(1), 119–138. http://www.sciencedirect.
com/science/article/pii/S0025322709003156
Piñero, E., Marquardt, M., Hensen, C., Haeckel, M., & Wallmann, K. (2013). Estimation of the global inventory of methane hydrates in marine sediments using transfer functions.Biogeosciences,10(2), 959–975. https://www.biogeosciences.net/10/959/2013/
Sauvage, J., Spivack, A. J., Murray, R. W., & D'Hondt, S. (2014). Determination of in situ dissolved inorganic carbon concentration and alkalinity for marine sedimentary porewater.Chemical Geology,387, 66–73. http://www.sciencedirect.com/science/article/pii/
S0009254114002927
Screaton, E. J., Torres, M. E., Dugan, B., Heeschen, K. U., Mountjoy, J. J., Ayres, C., et al. (2019). Sedimentation controls on methane‐hydrate dynamics across glacial/interglacial stages: An example from International Ocean Discovery Program Site U1517, Hikurangi Margin.Geochemistry, Geophysics, Geosystems,20, 4906–4921. https://doi.org/10.1029/2019GC008603
Strasser, M., Kölling, M., Ferreira, C. D. S., Fink, H. G., Fujiwara, T., Henkel, S., et al., R/V Sonne Cruise SO219A, & JAMSTEC Cruise MR12‐E01 scientists (2013). A slump in the trench: Tracking the impact of the 2011 Tohoku‐Oki earthquake.Geology,41(8), 935–938.
https://doi.org/10.1130/G34477.1
Tishchenko, P., Hensen, C., Wallmann, K., & Wong, C. S. (2005). Calculation of the stability and solubility of methane hydrate in seawater.
Chemical Geology,219(1), 37–52.
Watson, S. J., Mountjoy, J. J., & Crutchley, G. (2019). Tectonic and geomorphic controls on the distribution of submarine landslides across active and passive margins, eastern New Zealand.Geological Society, London, Special Publications,500, SP500–2019‐2165. https://sp.
lyellcollection.org/content/specpubgsl/early/2019/12/18/SP500‐2019‐165.full.pdf
Yamada, Y., Kawamura, K., Ikehara, K., Ogawa, Y., Urgeles, R., Mosher, D., et al. (2012). Submarine mass movements and their conse- quences. In Y. Yamada, K. Kawamura, K. Ikehara, Y. Ogawa, R. Urgeles, D. Mosher, et al. (Eds.),Submarine Mass Movements and Their Consequences. In: Advances in Natural and Technological Hazard Research, (Vol.31, pp. 1–12). Netherlands: Springer. https://doi.org/
10.1007/978‐94‐007‐2162‐3_1
Zabel, M., & Schulz, H. D. (2001). Importance of submarine landslides for non‐steady state conditions in pore water systems—
Lower Zaire (Congo) deep‐sea fan.Marine Geology,176(1), 87–99. http://www.sciencedirect.com/science/article/pii/
S0025322701001645
References From the Supporting Information
Berg, P., Rysgaard, S., & Thamdrup, B. (2003). Dynamic modeling of early diagenesis and nutrient cycling. A case study in an Arctic marine sediment.American Journal of Science,303(10), 905–955. http://www.ajsonline.org/content/303/10/905.abstract
Gieskes, J. M., Gamo, T., & Brumsack, H. (1991). Chemical methods for interstitial water analysis aboard JOIDES Resolution.Ocean Drilling Program Technical Note, 15. https://doi.org/10.2973/odp.tn.2915.1991
Hall, P. O. J., & Aller, R. C. (1992). Rapid, small‐volume,flow injection analysis forΣCO2, and NH4+
in marine and freshwaters.Limnology and Oceanography,37(5), 1113–1119. https://doi.org/10.4319/lo.1992.37.5.1113
Regnier, P., Dale, A. W., Arndt, S., LaRowe, D., Mogollón, J., & Van Cappellen, P. (2011). Quantitative analysis of anaerobic oxidation of methane (AOM) in marine sediments: A modeling perspective.Earth‐Science Reviews,106(1), 105–130.
Wallmann, K., Aloisi, G., Haeckel, M., Tishchenko, P., Pavlova, G., Greinert, J., et al. (2008). Silicate weathering in anoxic marine sedi- ments.Geochimica et Cosmochimica Acta,72(12), 2895–2918. http://www.sciencedirect.com/science/article/pii/S0016703708001981, https://doi.org/10.1016/j.gca.2008.03.026
10.1029/2020GL087243