INTRODUCTION
Iron is an essential nutrient for life but is present at very low concentrations, typically less than 200 pmol l−1, in open ocean surface waters (De Baar & De Jong 2001). As a result of low ambient iron concentrations, open ocean phytoplankton may have lower intracell- ular iron quotas than coastal species (Sunda et al.
1991, Sunda & Huntsman 1995, Strzepek et al. 2011), optimize their iron use via reduction of iron-rich pro- teins (Strzepek & Harrison 2004), or exchange iron- containing proteins with non-iron-containing alter- natives (Erdner et al. 1999, Peers & Price 2006). Such changes appear to result in increased efficiency of
growth in low-iron environments (Raven 1988, 1990, Strzepek et al. 2011).
The major iron-containing protein pools in phyto- plankton are dominated by proteins involved in pho- tosynthesis, nitrate reduction and respiration (Raven 1988, Strzepek & Harrison 2004). Hemoproteins are involved in electron transport and catalysis, and in the control, storage and transport of oxygen and other small molecules (Hogle et al. 2014). Hemes, the prosthetic groups of hemoproteins, contain 1 iron ion per molecule, and many hemoproteins contain multi- ple hemes (Smith et al. 2010). Hemes are synthesized on the same biosynthetic pathway as chlorophyll and the molecules are related via their common tetrapyr-
© Inter-Research 2015 · www.int-res.com
*Corresponding author: mgledhill@geomar.de
Heme b quotas are low in Southern Ocean phytoplankton
Martha Gledhill
1, 2, 3,*, Loes J. A. Gerringa
2, Patrick Laan
2, Klaas R. Timmermans
21Ocean and Earth Science, University of Southampton, National Oceanography Centre, Southampton SO14 3ZH, UK
2Department of Biological Oceanography, Royal Netherlands Institute for Sea Research, PO Box 59, AB Den Burg (Texel), The Netherlands
3GEOMAR Helmholtz Centre for Ocean Research Kiel, Wischhofstr. 1-3, 24148 Kiel, Germany
ABSTRACT: Heme is the iron-containing prosthetic group of hemoproteins, and is thus required for photosynthesis, respiration and nitrate reduction in marine phytoplankton. Here we report concentrations of heme bin Southern Ocean phytoplankton and contrast our findings with those in coastal species. The concentration of particulate heme b(pmol l−1) observed at the end of the exponential growth phase was related to the concentration of dissolved iron in the culture media.
Small Southern Ocean phytoplankton species (< 6 μm in diameter) had heme bquotas <1 μmol mol−1carbon, the lowest yet reported for marine phytoplankton. Heme bwas also depleted in these species with respect to chlorophyll a. We calculated the amount of carbon accumulated per mole of heme bper second in our cultures (heme growth efficiency, HGE) and found that small Southern Ocean species can maintain growth rates, even while heme bcontent is reduced. Small Southern Ocean phytoplankton can thus produce more particulate carbon than larger Southern Ocean or small coastal species at equivalent iron concentrations. Combining primary productivity and heme bconcentrations reported for the open ocean, we found that HGE in natural populations was within the range of our laboratory culture results. HGE was also observed to be higher at open ocean stations characterized by low iron concentrations. Our results suggest that low heme b quotas do not necessarily result in reduced growth and that marine phytoplankton can optimize iron use by manipulating the intracellular hemoprotein pool.
KEY WORDS: Iron · Phaeocystissp. · Diatoms · Haptophyte · Limitation · Coastal phytoplankton · Nutrients
Resale or republication not permitted without written consent of the publisher
role ring structure (Tanaka & Tanaka 2007). Free heme is toxic (Espinas et al. 2012), so cellular heme concentrations are tightly regulated via complex feedback mechanisms that control tetrapyrrole syn- thesis (Tanaka & Tanaka 2007), and via heme oxyge- nase enzymes, which break down heme into bili - verdins and iron (Shekhawat & Verma 2010). The heme iron reservoir could represent as much as 40%
of the total intracellular iron pool in marine phyto- plankton (Raven 1988, Honey et al. 2013) in circum- stances where iron storage is not significant.
Heme can also be a direct source of iron for mar- ine bacteria, and there is evidence to suggest that marine bacteria utilize specific uptake pathways in order to directly access this source of iron (Hopkin- son et al. 2008, Roe et al. 2013, Hogle et al. 2014).
Hemoprotein concentrations are known to vary in response to iron availability, and intracellular iron concentrations have been shown to be a controlling factor for the biosynthesis of tetrapyrroles (Qi &
O’Brian 2002). Diurnal cycling of hemoproteins in diazotrophic cyano bacteria (Saito et al. 2011) and increases in heme oxygenase in red algae (Richaud
& Zabulon 1997) have been observed, suggesting that the heme-iron pool may represent a relatively mobile intracellular iron reservoir. Intracellular heme concentrations of marine phytoplankton grow- ing in low-iron environments might therefore be expected to be reduced, with potential impacts on both iron demand and heme-requiring metabolic processes such as photosynthesis or nitrate reduc- tion (Hogle et al. 2014).
Heme b (iron protoporphyrin IX) is perhaps the most versatile and ubiquitous heme, and is incor - porated into hemoproteins such as the globins, cytochromes, catalase and oxidases. In phytoplank- ton, heme bmakes up between 1 and 40% of the total cellular iron pool (Honey et al. 2013). However, no studies on heme abundance or regulation have so far been reported for species isolated from iron- limited regions of the ocean, although Gledhill et al.
(2013) have shown that concentrations of heme bin particulate material in the iron-limited high latitude North Atlantic and in the Southern Ocean are de - plete compared to more iron-replete regions such as the tropical North Atlantic. There is thus a need to examine the heme bquotas in phytoplankton species originating from low-iron regions of the ocean to bet- ter understand how marine phytoplankton modify their heme bprotein pool when growing at low-iron concentrations.
The aim of our study was therefore to investigate heme babundance in eukaryotic phytoplankton spe-
cies isolated from the Southern Ocean, one of the lowest iron environments in the ocean. We deter- mined the concentrations of heme baccumulated in phytoplankton grown in Southern Ocean seawater at the end of the exponential growth phase. We com- pared heme bto iron concentrations in the cultures, to particulate organic carbon (POC) and to chloro- phyll a (chl a). We utilized the concept of heme growth efficiency (HGE), which, analogous to Raven (1988) and Strzepek et al. (2011), we defined as the moles of carbon fixed per mole of heme bper second.
In this way we examined the overall impact of reduced heme content on carbon fixation in our phytoplankton cultures. We compared HGE calcu- lated for our Southern Ocean phytoplankton with that calculated from heme bconcentrations and pri- mary productivity data for 3 sets of previously pub- lished field data from contrasting regions — the Celtic Sea (Hickman et al. 2012, Honey et al. 2013), the Scotia Sea (Korb et al. 2012, Gledhill et al. 2013) and the Iceland Basin (Poulton et al. 2010, Gledhill et al. 2013) — to assess the relationship between low heme band phytoplankton productivity in the ocean.
MATERIALS AND METHODS Phytoplankton growth conditions
Batch cultures of Phaeocystis antarctica (CCMP 1871, isolated from the Bellinghausen Sea), Chaeto- ceros brevis(CCMP 163, isolated from the Southern Ocean), C. dichaeta(Royal Netherlands Institute for Sea Research [NIOZ] culture collection, isolated from the Southern Ocean) and P. globosa(NIOZ culture collection, isolated from the North Sea) were grown in triplicate in filtered Southern Ocean seawater (SOs, 0.2 μm, Sartobran, Sartorius) previously col- lected using trace metal clean sampling techniques from south of the Polar Front from a depth of 2−3 m using a ‘fish’ towed from RV ‘Polastern’ (Expedition 18/2, November 2000). Cultures were maintained in acid-washed (1 mol l−1hydrochloric acid) and Milli- Q-water-rinsed microwave sterilized polycarbonate bottles (Kawachi & Noel 2005). Sample and culture manipulations were carried out in a class 100 laminar flow hood following trace metal clean protocols (Sunda et al. 2005). Southern Ocean seawater was amended with the siderophore desferrioxamine (DFB, 5 nmol l−1, Sigma) or FeCl3(5 nmol l−1) to create 3 treatments: SOs, SOs+DFB and SOs+Fe. P.globosa and C. calcitrans(CCMP 1315, isolated from Japan- ese coastal waters) were grown in enriched SOs,
which contained added ethylenediaminetetraacetic acid (EDTA, 100 μmol l−1), cobalt (50 nmol l−1), molybdenum (100 nmol l−1), copper (20 nmol l−1), manganese (115 nmol l−1), zinc (80 nmol l−1), sele- nium (10 nmol l−1) and f/2 vitamins. Iron was added separately from a stock solution of 45 μmol l−1 FeEDTA to obtain final concentrations of 9, 15, 45 and 150 nmol l−1. All experiments were carried out using a 16 h:8 h light: dark cycle under cool white flu- orescent lights at 60 μmol quanta m−2s−1. P.antarc- tica, C. brevisand C. dichaetawere grown at 4°C, P.
globosaat 15°C and C. calcitransat 22°C. Cultures were maintained in experimental media for > 6 gen- erations prior to experiments. For consistency, and to avoid issues arising from colony formation in both Phaeocystisspecies, growth rates for all species were calculated from the slope of the natural log (F0, autofluorescence) obtained for dim-light adapted (15 min) cells using a PAM fluorometer (Walz, Germa ny) plotted against time. Cell abundance was also monitored daily for C. brevis, C. calcitrans and Phaeo cystis sp., by flow cytometry (Accuri C6, BD Biosciences, results not presented). Cultures of P.
globosa, P. antarctica and C. dichaeta were exam- ined in 5 ml settling chambers by microscopy (Zeiss Axiovert 25 inverted microscope, results not pre- sented). The PAM fluorometer was used for daily determination of variable versus maximum fluores- cence of photosystem II (Fv/Fm). The experiments were terminated and cells harvested when both cell numbers and fluorescence measurements indicated the exponential growth phase was ending.
Analysis of nutrients, dissolved iron and iron speciation in the culture media
Concentrations of the dissolved macronutrients (nitrate + nitrite [termed nitrate for simplicity], phos- phate and silicate) were determined on filtered (0.2 μm, 25 mm Acrodisc, Pall) samples using a seg- mented flow autoanalyzer (Grasshoff et al. 1983;
QuAAtro, SEAL Analytical). Samples for nitrate and phosphate were frozen (−20°C) prior to analysis, while samples for silicate were kept at 4°C. The detection limit was typically 0.1, 0.01 and 0.1 μmol l−1 for nitrate, phosphate and silicate, respectively. Total dissolved iron was determined by flow injection analysis with chemiluminescence detection on acidi- fied, filtered (0.2 μm, Sartobran, Sartorius) samples according to the methods described in De Baar et al.
(2008). Ligand concentrations and the associated conditional stability constants were determined on
filtered samples (0.2 μm) by competitive equilibrium adsorptive cathodic stripping voltammetry using 2-(2-thiazolylazo)-p-cresol as the competing ligand (Croot & Johansson 2000). Samples were frozen after collection and defrosted 24 h before analysis. Sample manipulation and data treatment were carried out as described elsewhere (Gerringa et al. 2014).
Analysis of phytoplankton
Samples for POC, particulate organic nitrogen (PON), chl aand heme bwere collected on glass fiber filters (pore size 0.7 μm, Whatman). Filters for POC and PON were ashed prior to use (400°C, 8 h). Filters were stored at −20°C prior to drying (60°C) and analysis with an elemental analyzer (Carlo Erba NA- 1500), which was standardized using chitin. Chl a was determined by fluorescence against a standard chl a solution according to the method of Holm- Hansen et al. (1965).
Heme bconcentrations were determined in phyto- plankton after extraction into ammoniacal detergent (Gledhill 2007). We used octyl β-glucopyranoside as the detergent to allow for determination of heme bby mass spectrometry (Gledhill 2014). Samples were stored frozen at −80°C prior to analysis. Heme b was quantified, after separation from other pigments, by high performance liquid chromatography−visible spectrophotometry using a diode array detector (DAD) (Gledhill 2007), and by selectively monitoring the major reactant ion (selective reaction monitoring [SRM], specific mass-to-charge ratio [m/z] = 557) pro- duced by collision-induced dissociation of heme b (m/z = 616) using an ion trap mass spectrometer (ESI- MS, LTQ-Velos, Thermo Scientific) operating in the positive ion mode (Gledhill 2014). Source conditions were optimized, and the instrument was tuned using standard iron (III) protoporphyrin IX. Masses were calibrated using the automatic instrument calibration procedure and a standard mass calibration solution (Thermo Scientific). Good agreement was observed between the 2 detection methods ([heme]DAD= 1.06 × [heme]SRM+ 3.6 pmol l−1, r2= 0.98, n = 30), with the intercept resulting in a potential difference of < 0.3%
to the heme concentration in C. calcitranscultures.
Concentrations derived from SRM are used in the present study, except for C. calcitrans, where a problem with the mass spectrometer meant that concentra- tions were calculated using visible spectrophotometry.
Heme bgrowth efficiency was calculated for phy - toplankton in culture. HGE is defined analogous to iron use efficiency after Raven (1988), as the moles of
carbon fixed per mole of heme bper second. In cul- ture, POC represents a good approximation for phytoplankton carbon and HGE was calculated from the growth rate (s−1) and the heme b:POC ratio according to the formula:
(1) Apparent HGE in 3 areas of the ocean was also cal- culated by combining previously published heme b concentrations (Gledhill et al. 2013, Honey et al.
2013) with primary productivity (PP) data obtained on the same cruises (Poulton et al. 2010, Hickman et al. 2012, Korb et al. 2012) according to the formula:
(2) where PP is given in mol C m−2s−2, and [heme b]is given in mol m−2. For field data we add the term
‘apparent’ as there are several uncertainties in both the determination of primary productivity and heme b due to approximations made in the calculations, methodological constraints and the complexity of community composition (Honey et al. 2013, Juranek
& Quay 2013). Integrated heme b concentrations were recalculated to match the depths for the pub- lished integrated primary productivity data. Thus, for the Celtic Sea, heme b concentrations were inte- grated over the whole water column and compared to the median total water column primary productiv- ity given in Table 2 from Hickman et al. (2012). In the Scotia Sea, our stations SSC4, SSP24 and SSP28 had mixed layer depths and integrated chl aconcentra- tions characteristic of ‘MID’, ‘SW-SG’ and ‘NW-SG’
(as defined in Table 2 of Korb et al. 2012), respec- tively, and heme b was thus integrated to upper mixed layer depths of 43, 61 and 54 m, respectively.
To calculate HGE for the Iceland Basin, heme bwas integrated to the mixed layer depth given in Table 1 of Poulton et al. (2010).
Statistical analysis of results was carried out using the software package Sigmaplot v.12.5 with ANOVA, or non-parametric ANOVA in cases of non-normal data distributions.
RESULTS Growth rates
Growth rates and Fv/Fm for the 5 species are presented in Fig. 1. The Southern Ocean species (Phaeocystis antarctica, Chaetoceros brevis and C.
dichaeta)had growth rates of up to 0.5 d−1and Fv/Fm
up to 0.5 in SOs or SOs+Fe, similar to values reported previously for Southern Ocean species growing near ambient iron concentrations (Timmermans et al.
2004, Hoffmann et al. 2008, Strzepek et al. 2011). In contrast, C. calcitrans repeatedly failed to grow in SOs or SOs+Fe, while P. globosawas able to grow in SOs+DFB, SOs and SOs+Fe, albeit with very low growth rates (0.13−0.20 d−1) and with significantly reduced Fv/Fm(p < 0.01). Consequently, these 2 spe- cies were grown in enriched SOs, with added vita- mins, EDTA and trace metals, when growth rates of
> 0.7 d−1and Fv/Fm> 0.6, i.e. values more typical for HGE heme
POC b 1
( )
=μ× −
apparent HGE = PP [heme ]b
Fig. 1. (A) Growth rates (d−1) and (B) variable versus maxi- mum fluorescence of photosystem II (Fv/Fm) for the Southern Ocean (Phaeocystis antarctica, Chaetoceros brevisand C.
dicheata) and coastal (P. globosa and C. calcitrans) phyto- plankton grown in Southern Ocean seawater (SOs) with added desferrioxamine (DFB), Fe and trace metals plus ethyl enediaminetetraacetic acid (EDTA) (enriched SOs).
Southern Ocean species were not grown in enriched SOs.
Growth in SOs+DFB could not be maintained for C.
dichaeta. Values are means ± SD. Significant differences between treatments within species are denoted by asterisks
(1-way ANOVA on ranks, *p < 0.01)
iron-replete conditions) were observed. No attempt was made to grow the Southern Ocean species in enriched SOs.
Culture media nutrient and iron concentrations Concentrations (means ± SD) of nitrate, phosphate and silicate in the culture media at the beginning of the experiments were 27.4 ± 1.0, 1.7 ± 0.1 and 64.9 ± 0.7 μmol l−1, respectively (n = 6). None of the species grown in these experiments completely reduced the nitrate, phosphate or silicate inventories in SOs or SOs+DFB to levels below the detection limit (Table 1). Of the Southern Ocean species, P. antarc- ticaconsumed the most nitrate, with concentrations
of nitrate depleted to levels below detection in SOs+Fe (Table 1). The amount of nitrate converted to PON in each bottle in experiments with no added iron for P. antarctica was rather variable, even though the total nitrogen (i.e. nitrate + PON) calcu- lated for each bottle was close to the concentration of nitrate determined at the start of the experiment (108
± 14% for SOs+DFB and 97 ± 7% for SOs). For cul- tures of P. globosa and C. calcitrans grown in enriched SOs, dissolved nitrate was completely removed from the media, and particulate organic nitrogen concentrations were determined to be 95 ± 16% (n = 6) and 82 ± 0.04% (n = 7) of the starting nitrate concentrations, respectively.
Iron concentrations in SOs averaged 0.35 ± 0.17 nmol l−1(n = 5) for the experiments on C. brevisand Nitrate Phosphate Silicate POC PON Chl a Heme b (μmol l−1) (μmol l−1) (μmol l−1) (μmol l−1) (μmol l−1) (nmol l−1) (pmol l−1) Phaeocystis antarctica
SOs 15.3 0.91 nd 69 10 12 ± 5 8.2 ± 0.5 <dl 0.17 nd 190 25 5.9 0.4 nd 119 22 SOs+DFB 10.9 0.46 nd 92 15 12 ± 5 10 ± 3
1.4 0.05 nd 140 32 15 0.92 nd 70 13 SOs+Fe 0.4 <dl nd 284 22 16 ± 5 11± 6
<dl <dl nd 114 19 <dl 0.1 nd 127 18 Chaetoceros brevis
SOs 21.7 ±1.9 1.35 ± 0.05 63.7 ± 0.8 35 ± 7 3.7 ± 0.8 6.6 ± 2.7 7.7 ± 3.0 SOs+DFB 25.5 ± 0.2 1.58 ± 0.14 65.5 ± 0.5 6.2 ±1.1 1.1± 0.3 1.1± 0.4 2.4 ± 0.5 SOs+Fe 16.5 ± 3.4 1.00 ± 0.11 58.2 ± 4.4 36 ± 4 5.9 ±1.0 13 ± 2 13 ± 3 Chaetoceros dichaeta
SOs 12.3 ± 4.2 0.70 ± 0.27 38.0 ± 8.9 52 ±13 7.3 ±1.5 6.9 ±1.6 49 ± 30 SOs+Fe 15.6 ±1.9 0.75 ± 0.14 43.4 ± 2.3 48 ±12 7.3 ± 2.1 11±1 47 ± 6 Phaeocystis globosa
SOs 24.6 ±1.0 1.61± 0.05 nd 16 ± 4 2.6 ± 0.3 1.8 ± 0.6 24 ± 4 SOs+DFB 24.8 ± 0.5 1.64 ± 0.02 nd 14 ± 3 1.6 ± 0.1 1.4 ± 0.2 16 ±1 SOs+Fe 22.0 ± 2.8 1.44 ± 0.16 nd 16 ± 4 2.5 ± 0.6 1.8 ± 0.5 35 ± 8 Enriched SOs (9 nM) <dl <dl nd 457 ± 50 29 ± 4 49 ± 3 528 ± 26 Enriched SOs (45 nM) <dl <dl nd 482 ±11 22.3 ±1.9 56 ± 4 800 ± 200 Chaetoceros calcitrans
Enriched SOs (15 nM) <dl <dl 51.1± 0.4 540a(n = 1) 20a(n = 1) 61± 7 1170 ± 80 Enriched SOs (45 nM) <dl <dl 50.5 ± 0.1 560 ± 34 19 ±1 63 ± 3 1430 ± 80 Enriched SOs (150 nM) <dl <dl 50.9 ± 2.9 480 ±140 21±1 76 ± 9 2000 ± 200
aTwo samples were lost during analysis
Table 1. Concentrations of nitrate, phosphate, silicate, particulate organic carbon (POC), particulate organic nitrogen (PON), chlorophyll a(chl a) and particulate heme bobserved in cultures of Southern Ocean (Phaeocystis antarctica, Chaetoceros bre- visand C. dichaeta) and temperate coastal (P. globosaand C. calcitrans) phytoplankton species at the end of the experiments.
For P. antarctica, data for nitrate, phosphate, POC and PON are presented individually (n = 1), because of high variability between experimental triplicates. Chl aand heme bconcentrations and all data for other species are given as means ± SD of experimental triplicates. SOs: Southern Ocean seawater; DFB: desferrioxamine; <dl: less than the detection limit;
nd: not determined
C. dichaeta, and 0.29 ± 0.01 nmol l−1(n = 3) for exper- iments on Phaeocystissp. The natural ligand (Li) con- centrations in SOs were very similar to the iron con- centration (0.36 ± 0.03 nmol Equivalents Fe l−1, n = 2), and conditional stability constants (log = 22.4 ± 0.01 mol−1, at 20°C) were typical for open ocean ligands (Gledhill & Buck 2012). Iron concen- trations were not measured in enriched SOs treat- ments. Dissolved iron concentrations and speciation were also determined in SOs treatments at the end of experiments on P. antarctica(0.33 ± 0.21, n = 2), C.
dichaeta(0.2 ± 0.03, n = 3) and P. globosa(0.36 ± 0.31, n = 3). Iron concentrations were thus not significantly reduced during the course of the experiments (t-test, p < 0.05). The observed increase in variability was likely indicative of small amounts of iron contamina- tion occurring during the course of the experiment.
Similarly, ligand concentrations and stability con- stants did not change, so that the overall average for ligand concentrations at the time that cells were har- vested was 0.24 ± 0.14 nmol Eq Fe l−1 (n = 6) and log was 22.8 ± 0.5 (n = 6). A simple ion pair- ing model (van den Berg 1984) was used to estimate a concentration of approximately 4 pmol l−1inorgan- ically complexed iron (Fe’) in SOs.
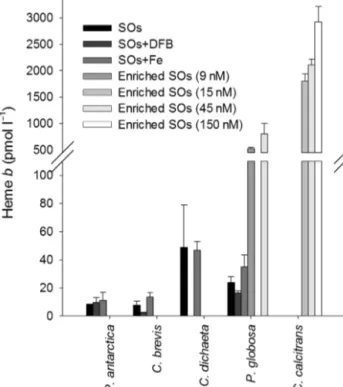
Heme bconcentrations
We present here the heme b concentrations (i.e.
pmol heme bl−1 culture medium) at the end of the growth period, in order to relate them to the dis- solved iron concentrations in a semi-quantitative mass balance approach. The lowest particulate heme bconcentrations were observed in cultures of C. bre- visin SOs+DFB (Fig. 2). In these C. breviscultures, approximately 1.0 ± 0.5% of the dissolved iron pres- ent at the beginning of the experiment was incorpo- rated into heme b. Particulate heme bconcentrations were higher in C. dichaetacultures when compared to the other Southern Ocean species. For C. dichaeta cultured in SOs, heme bconcentrations represented 14 ± 9% of the total dissolved iron inventory at the start of the experiments. Heme bconcentrations for P.
antarcticaand P. globosawere intermediate in value between C. brevis and C. dichaeta, and no signifi- cant differences were observed between SOs, SOs+DFB and SOs+Fe treatments (p < 0.01, ANOVA between treatments within species). Heme bconcen- trations observed in C. calcitransand P. globosacul- tured in enriched SOs were an order of magnitude higher than heme b concentrations observed in unenriched SOs (i.e. cultures grown without added
trace metals, EDTA and vitamins), reaching a maxi- mum of 2930 ± 300 pmol l−1for C. calcitransgrown with 150 nmol l−1iron (Fig. 2). At total iron concentra- tions of 15 nmol l−1, C. calcitransincorporated 8 ± 1%
of the total iron inventory into heme b.
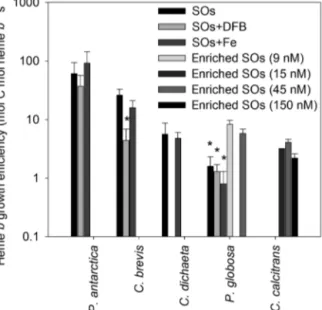
Heme bquotas, heme b:chl aratios and heme growth efficiency
In this study, heme bquotas (μmol heme bmol−1C) and heme b:chl aratios did not show significant vari- ability between treatments within species (Fig. 3).
However, significant differences in heme b:C were observed between species when all treatments were pooled (p < 0.01). Heme b:C ratios for C. brevisand P.
antarctica were thus significantly lower than those observed for P. globosa and C. calcitrans, and also lower than those reported previously for other spe- cies (Honey et al. 2013). Heme b:C ratios reported for P. antarctica compare well (overall average 0.08 ± 0.05 μmol mol−1) with Fe:C ratios of 2.0−2.7 μmol mol−1previously reported for P. antarctica grown at similar iron concentrations (Strzepek et al. 2011), given that heme b has previously been shown to
FeL Fe cond
K 3+
i( )
FeL Fe cond
K 3+
i( )
Fig. 2. Heme bconcentrations (pmol l−1) observed at the end of the exponential phase in Southern Ocean (Phaeocystis antarctica, Chaetoceros brevisand C. dicheata) and coastal (P. globosa and C. calcitrans) phytoplankton grown in Sou - thern Ocean seawater treatments. Values are means ± SD.
SOs: Southern Ocean seawater; DFB: desferrioxamine
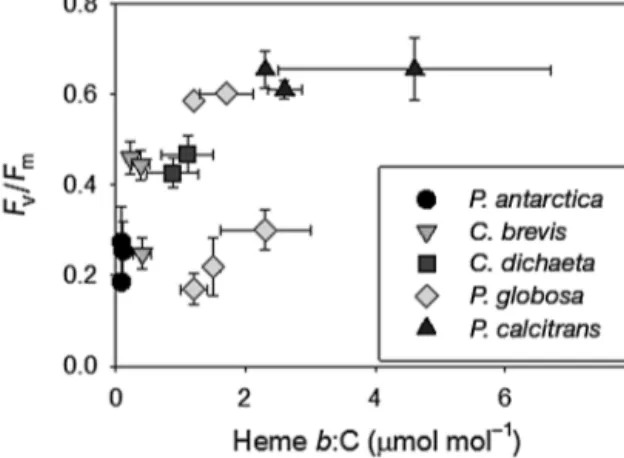
make up between 1 and 40% of the total cellular iron pool (Honey et al. 2013). Heme b:C and Fv/Fmwere weakly correlated (r = 0.55, p < 0.01, n = 46; Fig. 4), as particularly low Fv/Fm was observed for P. globosa grown in unenriched SOs treatments. Comparison of heme b with particulate organic nitrogen (Table 1) indicated that heme b:N ratios increased in treat- ments where nitrate was completely exhausted.
Heme bwas also significantly reduced relative to chl afor both P. antarcticaand C. brevis compared to P. globosa and C. calcitrans (Fig. 3B). Heme b was observed to be 3 orders of magnitude lower
than chlain these small Southern Ocean species, so that the relative abundances of heme b and chl a were similar to those observed in particulate mate- rial sampled in high-latitude, iron-deplete waters of the North Atlantic and Scotia Sea (Gledhill et al.
2013). Relative abundances of heme band chl ain C. dichaeta were intermediate in value, while the relative abundances of heme band chl ain P. globo - sa and C. calcitrans were similar to those reported previously for Phaeodactylum tricornutum, Thalas- siosira oceanica, T. weissflogii and Synechococcus sp. (Honey et al. 2013).
The impact of changes in heme bon growth was examined through the calculation of HGE. Compari- son within species indicated that a significantly lower HGE was observed for C. brevisand P. globosawhen grown with low iron availability (Fig. 5). When treat- ments were pooled (omitting treatments with signifi- cantly lower HGE), the small Southern Ocean spe- cies P. antarcticaand C. breviswere both observed to have significantly higher HGE than C. calcitrans, and there was an overall trend of decreasing HGE in the order P. antarctica> C. brevis> C. dichaeta≈P. glo- bosa≈C. calcitrans.
We calculated apparent HGE for the Celtic Sea, a coastal, iron-replete region (Hickman et al. 2012, Honey et al. 2013), the Iceland Basin (Poulton et al.
2010, Gledhill et al. 2013), a high-latitude, seasonally iron-limited region (Nielsdottir et al. 2009), and the Scotia Sea (Korb et al. 2012, Nielsdottir et al. 2012), a productive region of the Southern Ocean. Data used in these calculations are presented in Table 2. Inte- grated heme bconcentrations were recalculated to match depths for reported integrated primary pro- Fig. 3. Intracellular heme bconcentrations expressed rela-
tive to (A) carbon (μmol mol−1) in Southern Ocean (Phaeo- cystis antarctica, Chaetoceros brevisand C. dicheata) and coastal (P. globosa and C. calcitrans) phytoplankton species and (B) chlorophyll a(expressed as the molar ratio) in South- ern Ocean and coastal phytoplankton species. Values are means ± SD. Note log scale on y-axis. SOs: Southern Ocean
seawater; DFB: desferrioxamine
Fig. 4. Relationship between heme b:C (μmol mol−1) and quantum yield of photosystem II (Fv/Fm) in Southern Ocean (Phaeocystis antarctica, Chaetoceros brevisand C. dicheata) and coastal (P. globosa and C. calcitrans) phytoplankton
species in this study
ductivity data (Table 2), and results are presented in Fig. 6. Apparent HGE for the Celtic Sea averaged 2 ± 1 mol C mol heme b−1s−1(n = 4), while HGE ranged from 1 to 4.2 mol C mol heme b−1s−1(n = 3) in the Scotia Sea and from 1.0 to 27 mol C mol heme b−1s−1 (n = 10) in the high latitude North Atlantic.
DISCUSSION
We compared heme bconcentrations in batch cul- tures of the Southern Ocean haptophyte Phaeocystis antarctica and the diatoms Chaetoceros brevis and C. dichaetato those in the temperate coastal species P. globosaandC. calcitrans. We selected P. globosa and C. calcitransbecause they are similar in size to P.
antarctica and C. brevis (cell volumes of approxi- mately 100 μm3for Phaeocystissp., C. brevisand C.
calcitransas opposed to approximately 4000 μm3for C. dichaeta), but they were isolated from coastal environments (northwest Europe and Japan, respec- tively) and thus represented a contrast to the South- ern Ocean species with respect to potential iron requirements. It was interesting to note that our coastal species grew very poorly or not at all in unen- riched SOs. While the contrasting growth of our Southern Ocean and coastal species in SOs was in
accordance with variations in iron requirements reported previously (Timmermans et al. 2005, Hoff- mann et al. 2008, Lane et al. 2009, Strzepek et al.
2011), our experiments do not allow us to identify low iron concentrations as the sole cause for the low growth rates of the coastal species, as multiple trace elements and vitamins were added to the enriched media. Nevertheless, particulate heme bconcentra- tions in our experiments increased with iron concen- tration (Fig. 2), with up to one-sixth of dissolved iron converted to heme bwhen iron concentrations were similar to those observed in the ocean. Interestingly, even for C. calcitrans, heme bconcentrations were 8 ± 1% of the total iron inventory in cultures contain- ing 15 nM dissolved iron, suggesting that a large pro- Fig. 5. Heme growth efficiency (HGE, mol C mol heme b−1
s−1), determined for Southern Ocean (Phaeocystis antarctica, Chaetoceros brevisand C. dicheata) and coastal (P. globosa and C. calcitrans) phytoplankton species in our experiments.
Values are means ± SD. Significant differences between treatments within species are denoted by asterisks (1-way ANOVA on ranks, *p < 0.01). Note log scale on y-axis. SOs:
Southern Ocean seawater; DFB: desferrioxamine
Station Primary Heme b HGE
productivity (nmol m−2) (mol C mol (mmol C m−2d−1) hemeb−1s−1) Celtic Sea
B21 201 174 1.1
B22 369 217 1.6
OB1 251 276 0.9
U2 273 103 2.6
Scotia Sea
SSC4 17 270 0.6
SSP28 29 114 2.6
SSP3 233 579 4.2
Iceland Basin
IB204 17 70 2.8
IB209 11 115 1.1
IB212 23 81 3.2
IB222 10 31 3.7
IB226 41 44 11
IB243 49 76 7.4
IB260 41 19 25
IB274 28 27 12
IB285 65 28 27
IB286 41 59 7.9
Table 2. Integrated primary productivity, heme band heme growth efficiency (HGE) calculated from previously pub- lished field data. Celtic Sea median integrated primary pro- ductivity data for the whole water column were obtained from Hickman et al. (2012). Integrated heme bwas calcu- lated from Honey et al. (2013). Scotia Sea primary productiv- ity data were obtained from Korb et al. (2012). We used val- ues for ‘MID’, ‘SW-SG’ and ‘NW-SG’ as these regions had integrated chlorophyll a values that closely corresponded with values we calculated for integrated chlorophyll aat sta- tions SSC4, SSP28 and SSP3, respectively. We adjusted our values for integrated heme busing the upper mixed layer depth given in Korb et al. (2012). Iceland Basin primary productivity data were obtained from Poulton et al. (2010).
Integrated heme bfrom data in Gledhill et al. (2013) was recalculated for depths given in Poulton et al. (2010). See
Fig. 6 for station locations
portion of the total dissolved iron was utilized by this species at this iron concentration.
Closer examination of the different treatments suggests that there are interspecific differences with respect to the influence of the chemical speci- ation of iron on heme bconcentrations. The strong iron chelator DFB reduced growth in C. brevisand prevented sustained growth for C. dichaeta, but made little difference to the amount of heme bpro- duced by P. antarcticaand P. globosain our experi- ments. These results agree with previous studies showing that iron in DFB is not universally unavail- able to eu karyotic phytoplankton (Strzepek et al.
2011, Shaked & Lis 2012). Furthermore, in our experiments, addition of iron as FeCl3(SOs+Fe treatments) had only a slight impact on partic- ulate heme b concentrations for all of the spe- cies that grew in SOs+Fe (Fig. 2). This is likely a result of losses of the added iron to the bottle walls or as precipitates, as natural ligands were saturated or very close to saturation in SOs.
The contrast between heme b concentrations observed with SOs+Fe and those in experi- ments with enriched SOs highlights the impor- tance of ligands as iron buffers, keeping iron in solution and thus potentially available for uptake (Sunda et al. 2005, Gerringa et al. 2012, Thuróczy et al. 2012).
Macronutrients were underexploited by all spe cies grown in experiments in SOs or SOs+DFB. Enriching SOs with trace metals, a trace metal buffer (EDTA) and vitamins facilitated complete exploitation of macronutrients in the culture media and coincided with order of magnitude increases in heme bconcen- tration. We cannot say with certainty that this in - crease in macronutrient utilization resulted from the relief of iron limitation alone, as the enriched media involved addition of a suit of trace metals and vita- mins in addition to iron. However, an increase in heme b could be directly linked to increased ex - ploitation of nitrate in enriched SOs via an in creased ability to undertake cytochrome-b557-dependent as - similatory nitrate reduction. Assimilatory nitrate re - duction has previously been shown to be reduced in iron-limited phytoplankton (Timmermans et al. 1994).
Furthermore, heme b in assimilatory eukaryotic nitrate reductase is likely to be labile for our extrac- tion protocol (Gledhill et al. 2013, Honey et al. 2013) as the protein is structurally similar to sulfite oxidase (Hille 2013), in which heme bis relatively exposed.
However, this potential link between heme band ni - trate reduction is undermined by results from exper- iments on P. antarctica, which indicate that all the available nitrate in SOs+Fe was removed, without any observable increase in heme bconcentrations.
Low iron quotas have previously been observed in Southern Ocean phytoplankton (Hassler & Schoe- mann 2009, Strzepek et al. 2011). However, the abundance of the intracellular content of more spe- cific iron pools has not been widely investigated.
Here, we show that small Southern Ocean species also have low heme bquotas (Fig. 3). Furthermore, while heme b was reduced relative to POC in P.
antarctica and C. brevis, chl a:C ratios were not reduced so that the relative abundances of heme b and chl awere similar to those observed in low-iron Fig. 6. Apparent heme growth efficiency (HGE, mol C mol
heme b−1s−1) in (A) the Iceland Basin, (B) the Celtic Sea and (C) the Scotia Sea. HGE was determined for integrated mixed layer depths (Scotia Sea, Iceland Basin) or whole water column depths (Celtic Sea) from previously published productivity data (Poulton et al. 2010, Hickman et al. 2012, Korb et al. 2012) and heme bconcentrations (Gledhill et al.
2013, Honey et al. 2013). Note scale change for Iceland Basin. Color bar denotes HGE for all inset figures. Back - ground colors represent bathymetry (light grey: 250−2000 m;
dark grey: < 250 m)
regions of the Scotia Sea and Iceland Basin (Gledhill et al. 2013). Low heme b relative to chl a was not observed in the diatom species examined previously (Honey et al. 2013), but the results obtained for C.
brevisin the present study indicate that diatoms tol- erant to low iron concentrations may also have low heme brelative to chl a. The present study thus sup- ports previous work that has linked decreases in the abundance of heme brelative to chl ain the ocean (Honey et al. 2013, Gledhill 2014) to low nutrient availability and the consequent changes in species composition.
Heme bis required to fix carbon in eukaryotes as it is a component of the photosystem protein complexes cytochrome b6f and photosystem II. Previous work has shown a correlation between the heme bquota and Fv/Fm, the quantum yield of photosystem II (Honey et al. 2013). The weaker correlation observed in the present study was highly influenced by the results obtained when P. globosawas grown in unen- riched SOs. It is possible that P. globosa in unen- riched SOs was not truly acclimated to the conditions and that this was then reflected in the comparison between Fv/Fmand the heme bquota. Nevertheless, the observed trend between Fv/Fm and the heme b quota does suggest that, in the majority of treat- ments, there could be a link between a lower Fv/Fm
and the heme bquota, and that lower heme bmay thus impact on growth. In this study, we examined the relationship between growth and heme bquotas through calculation of HGE (Eq. 1). Decreasing HGE suggests that low heme bquotas have a direct impact on growth, while higher HGE indicates that the heme bquota can be optimized. Reduced HGE was observed at low iron concentrations for C. brevisand P. globosa, suggesting that decreased heme b did result in a growth cost. However, growth rates for P.
antarcticaand C. brevisin SOs and SOs+Fe were rel- atively high (Fig. 1) despite the low intracellular heme bconcentrations, leading to high HGE (Fig. 5) and suggesting that optimization of the heme bquota may be a mechanism by which a species can reduce its iron use whilst maintaining growth at low iron concentrations.
Results for HGE could be influenced by the nature of the extraction protocol used for heme bdetermina- tion. Both protein structure and intracellular localiza- tion may impact on heme bextraction efficiency. The extraction protocol used in the present study has pre- viously been shown to be biased towards heme b molecules that are relatively accessible to attack by solvents (Gledhill et al. 2013, Honey et al. 2013).
Examination of crystal structures suggests that
hemebin the photosystem cytochromes b6and b559is at least moderately extractable with our protocol (Stroebel et al. 2003, Müh et al. 2008). Furthermore, the heme bin cytochrome b559has been shown to be labile in detergent solution at high pH (Weber et al.
2011). Although we cannot state with confidence which hemoprotein pool is impacted by reductions in heme b, our observed variations in HGE indicate that reduced heme b does not necessarily result in re - duced growth and that individual phytoplankton species are likely to optimize iron use by manipulat- ing the intracellular hemoprotein pool.
It was notable that in our study P. antarctica showed a remarkable ability to both fix carbon and utilize nitrate, despite low intracellular heme bcon- centrations. Our results suggest that species such as P. antarctica can produce approximately 10 times more particulate carbon than, for example, P. glo- bosa, given the same iron and nitrogen resources.
Heme bmakes up an important fraction of the total cellular iron pool. Our work is consistent with a pre- vious study (Strzepek et al. 2011) that also showed an increase in iron use efficiency in small Southern Ocean species such as P. antarctica, even though our experiments did not incorporate as long an adapta- tion time, and our species may not have been fully acclimated to the low iron treatments. Our work thus suggests that a low heme bquota and the ability to exploit a wide variety of iron sources likely con- tribute to the mechanisms by which P. antarcticacan efficiently exploit iron inputs (Marsay et al. 2014) in areas such as the Ross Sea, where this species can form large blooms, resulting in the drawdown of CO2 (Tagliabue & Arrigo 2005).
In field samples, heme bin non-photosynthesizing plankton could potentially act to decrease apparent HGE, and differences in methodologies used to determine primary productivity could also bias our results (Halsey et al. 2010). However, despite these potential offsets, our calculated apparent HGE ob - tained from heme bconcentrations and primary pro- ductivity determined for coastal (Celtic Sea) and open ocean (High Latitude North Atlantic [HLNA]
and Scotia Sea) regions were within the range calcu- lated in our phytoplankton cultures. In the Scotia Sea, HGE was not as high as that observed for P.
antarctica, as the Scotia Sea tends to be dominated by diatoms or dinoflagellates (Korb et al. 2010, 2012).
The highest HGE was thus observed in the HLNA at stations characterized by iron concentrations < 0.05 nmol l−1, i.e. stations IB285 and IB260 (Gledhill et al.
2013). Thus the lower levels of heme b that have been observed in low-iron open-ocean environments
(using this extraction technique) do not necessarily imply low growth or productivity. In fact, increased HGE is necessary in areas with low heme brelative to chl a, in order to comply with observed correla- tions between productivity and chl a(e.g. Poulton et al. 2010).
In the present study we have shown that small Southern Ocean phytoplankton had low heme bquo- tas. Species with low heme bquotas did not necessar- ily exhibit low growth rates, suggesting that heme b quotas were optimized, possibly in order to reduce overall iron requirements. We furthermore compared previously published field data with primary produc- tivity and also found that low heme brelative to chl a was not necessarily associated with decreased pro- ductivity. Our results suggest considerable variability with respect to heme b quotas amongst marine phytoplankton in culture, and that this variability may also be observed in the field. Heme b quotas could change as a result of optimization of biological iron pools, and could also be influenced by method- ological constraints imposed by the extraction proto- col. Irrespective of the cause, the finding that a par- ticular iron pool is reduced in phytoplankton growing at low iron concentrations, both in the laboratory and in the field, and that the reduction in this important iron pool does not impact proportionately on carbon accumulation, sheds further light on how marine phytoplankton can adapt to low-iron, open-ocean environments.
Acknowledgements. The authors thank the anonymous reviewers for their constructive comments on the manu- script. The authors also thank A. Noordeloos (NIOZ) for her help with PAM fluorescence and flow cytometry, S. Akbari (University of Southampton, UoS) for his assistance with POC/N analysis and M. Esposito (UoS) for his assistance with the nutrient analysis. M.G. was supported by a Natural Environment Research Council Advanced Fellowship (NE/
E013546/1).
LITERATURE CITED
Croot PL, Johansson M (2000) Determination of iron specia- tion by cathodic stripping voltammetry in seawater using the competing ligand 2-(2-thiazolylazo)-p-cresol (TAC).
Electroanalysis 12: 565−576
De Baar HJW, De Jong JTM (2001) Distribution, sources and sinks of iron in seawater. In: Turner DR, Hunter KA (eds) The biogeochemistry of iron in seawater. Wiley, Chi - chester, p 123–253
De Baar HJW, Timmermans KR, Laan P, De Porto HH and others (2008) Titan: a new facility for ultraclean sampling of trace elements and isotopes in the deep oceans in the international Geotraces program. Mar Chem 111: 4−21 Erdner DL, Price NM, Doucette GJ, Peleato ML, Anderson
DM (1999) Characterization of ferredoxin and flavodoxin
as markers of iron limitation in marine phytoplankton.
Mar Ecol Prog Ser 184: 43−53
Espinas NA, Kobayashi K, Takahashi S, Mochizuki N, Masuda T (2012) Evaluation of unbound free heme in plant cells by differential acetone extraction. Plant Cell Physiol 53: 1344−1354
Gerringa LJA, Alderkamp AC, Laan P, Thuróczy CE and others (2012) Iron from melting glaciers fuels the phyto- plankton blooms in Amundsen Sea (Southern Ocean):
iron biogeochemistry. Deep Sea Res II 71-76: 16−31 Gerringa LJA, Rijkenberg MJA, Thuróczy CE, Maas LRM
(2014) A critical look at the calculation of the binding characteristics and concentration of iron complexing lig- ands in seawater with suggested improvements. Environ Chem 11: 114−136
Gledhill M (2007) The determination of heme bin marine phyto- and bacterioplankton. Mar Chem 103: 393−403 Gledhill M (2014) The detection of iron protoporphyrin
(heme b)in phytoplankton and marine particulate mate- rial by electrospray ionisation mass spectrometry — com- parison with diode array detection. Anal Chim Acta 841:
33−43
Gledhill M, Buck KN (2012) The organic complexation of iron in the marine environment: a review. Front Micro- biol 3: 69
Gledhill M, Achterberg EP, Honey DJ, Nielsdottir MC, Rijkenberg MJA (2013) Distributions of particulate heme bin the Atlantic Ocean and Southern Ocean — implica- tions for electron transport in phytoplankton. Global Bio- geochem Cycles 27: 1072−1082
Grasshoff K, Ehrhardt M, Kremling K (1983) Methods of sea- water analysis. Verlag Chemie, Weinheim
Halsey KH, Milligan AJ, Behrenfeld MJ (2010) Physiological optimization underlies growth rate-independent chloro- phyll-specific gross and net primary production. Photo- synth Res 103: 125−137
Hassler CS, Schoemann V (2009) Bioavailability of organi- cally bound Fe to model phytoplankton of the Southern Ocean. Biogeosciences 6: 2281−2296
Hickman AE, Moore CM, Sharples J, Lucas MI, Tilstone GH, Krivtsov V, Holligan PM (2012) Primary production and nitrate uptake within the seasonal thermocline of a strat- ified shelf sea. Mar Ecol Prog Ser 463: 39−57
Hille R (2013) The molybdenum oxotransferases and related enzymes. Dalton Trans 42: 3029−3042
Hoffmann LJ, Peeken I, Lochte K (2008) Iron, silicate, and light co-limitation of three Southern Ocean diatom spe- cies. Polar Biol 31: 1067−1080
Hogle SL, Barbeau KA, Gledhill M (2014) Heme in the mar- ine environment: from cells to the iron cycle. Metallomics 6: 1107−1120
Holm-Hansen O, Lorenzen CJ, Holmes RW, Strickland JDH (1965) Fluorometric determination of chlorophyll. J Cons Int Explor Mer 30: 3−15
Honey DJ, Gledhill M, Bibby TS, Legiret FE and others (2013) Heme bin marine phytoplankton and particulate material from the North Atlantic Ocean. Mar Ecol Prog Ser 483: 1−17
Hopkinson BM, Roe KL, Barbeau KA (2008) Heme uptake by Microscilla marinaand evidence for heme uptake sys- tems in the genomes of diverse marine bacteria. Appl Environ Microbiol 74: 6263−6270
Juranek LW, Quay PD (2013) Using triple isotopes of dis- solved oxygen to evaluate global marine productivity.
Annu Rev Mar Sci 5: 503−524
➤
➤
➤
➤
➤
➤
➤
➤
➤
➤
➤
➤
➤
➤
➤
➤
➤
➤
➤
➤
➤
➤
➤
➤
➤
➤
➤
➤
➤
➤
➤
➤
➤
➤
➤
➤
➤
➤
➤
➤
Kawachi M, Noel MH (2005) Sterilization and sterile tech- niques. In: Anderson RA (ed) Algal culturing techniques.
Elsevier, Beijing, p 65–82
Korb RE, Whitehouse MJ, Gordon M, Ward P, Poulton AJ (2010) Summer microplankton community structure across the Scotia Sea: implications for biological carbon export. Biogeosciences 7: 343−356
Korb RE, Whitehouse MJ, Ward P, Gordon M, Venables HJ, Poulton AJ (2012) Regional and seasonal differences in microplankton biomass, productivity, and structure across the Scotia Sea: implications for the export of bio- genic carbon. Deep-Sea Res II 59-60: 67−77
Lane ES, Semeniuk DM, Strzepek RF, Cullen JT, Maldon- ado MT (2009) Effects of iron limitation on intracellular cadmium of cultured phytoplankton: implications for sur- face dissolved cadmium to phosphate ratios. Mar Chem 115: 155−162
Marsay CM, Sedwick PN, Dinniman MS, Barrett PM, Mack SL, McGillicuddy DJ (2014) Estimating the benthic efflux of dissolved iron on the Ross Sea continental shelf. Geo- phys Res Lett 41:7576–7583
Müh F, Renger T, Zouni A (2008) Crystal structure of cyano- bacterial photosystem II at 3.0 angstrom resolution: a closer look at the antenna system and the small mem- brane-intrinsic subunits. Plant Physiol Biochem 46:
238−264
Nielsdottir MC, Moore CM, Sanders R, Hinz DJ, Achterberg EP (2009) Iron limitation of the postbloom phytoplankton communities in the Iceland Basin. Global Biogeochem Cycles 23: GB3001, doi: 10.1029/2008GB003410
Nielsdottir M, Bibby TS, Moore CM, Hinz DJ and others (2012) Seasonal dynamics of iron availability in the Sco- tia Sea. Mar Chem 130-131: 62−72
Peers G, Price NM (2006) Copper-containing plastocyanin used for electron transport by an oceanic diatom. Nature 441: 341−344
Poulton AJ, Charalampopoulou A, Young JR, Tarran GA, Lucas MI, Quartly GD (2010) Coccolithophore dynamics in non-bloom conditions during late summer in the cen- tral Iceland Basin (July−August 2007). Limnol Oceanogr 55: 1601−1613
Qi Z, O’Brian MR (2002) Interaction between the bacterial iron response regulator and ferrochelatase mediates genetic control of heme biosynthesis. Mol Cell 9: 155−162 Raven JA (1988) The iron and molybdenum use efficiencies of plant growth with different energy, carbon and nitro- gen sources. New Phytol 109: 279−287
Raven JA (1990) Predictions of Mn and Fe use efficiencies of phototrophic growth as a function of light availability for growth and of C assimilation pathway. New Phytol 116:
1−18
Richaud C, Zabulon G (1997) The heme oxygenase gene (pbsA) in the red alga Rhodella violaceais discontinuous and transcriptionally activated during iron limitation.
Proc Natl Acad Sci USA 94: 11736−11741
Roe KL, Hogle SL, Barbeau KA (2013) Utilization of heme as an iron source by marine Alphaproteobacteria in the Roseobacter clade. Appl Environ Microbiol 79:
5753−5762
Saito MA, Bertrand EM, Dutkiewicz S, Bulygin VV and oth- ers (2011) Iron conservation by reduction of metallo -
enzyme inventories in the marine diazotroph Croco - sphaera watsonii. Proc Natl Acad Sci USA 108:
2184−2189
Shaked Y, Lis H (2012) Disassembling iron availability to phytoplankton. Front Microbiol 3: 123
Shekhawat GS, Verma K (2010) Haem oxygenase (HO): an overlooked enzyme of plant metabolism and defence.
J Exp Bot 61: 2255−2270
Smith LJ, Kahraman A, Thornton JM (2010) Heme pro- teins — diversity in structural characteristics, function, and folding. Proteins 78: 2349−2368
Stroebel D, Choquet Y, Popot JL, Picot D (2003) An atypical haem in the cytochrome b6f complex. Nature 426:
413−418
Strzepek RF, Harrison PJ (2004) Photosynthetic architecture differs in coastal and oceanic diatoms. Nature 431:
689−692
Strzepek RF, Maldonado MT, Hunter KA, Frew RD, Boyd PW (2011) Adaptive strategies by Southern Ocean phyto- plankton to lesson iron limitation: uptake of organically complexed iron and reduced iron requirements. Limnol Oceanogr 56: 1983−2002
Sunda WG, Huntsman SA (1995) Iron uptake and growth limitation in oceanic and coastal phytoplankton. Mar Chem 50: 189−206
Sunda WG, Swift DG, Huntsman SA (1991) Low iron requirement for growth in oceanic phytoplankton.
Nature 351: 55−57
Sunda WG, Price NM, Morel FMM (2005) Trace metal ion buffers and their use in culture studies. In: Anderson RA (ed) Algal culturing techniques. Elsevier, Beijing, p 35–65 Tagliabue A, Arrigo KR (2005) Iron in the Ross Sea: 1. Im - pact on CO2fluxes via variation in phytoplankton func- tional group and non-Redfield stoichiometry. J Geophys Res Oceans 110: C03009, doi:10.1029/ 2004 JC002531 Tanaka R, Tanaka A (2007) Tetrapyrrole biosynthesis in
higher plants. Annu Rev Plant Biol 58: 321−346
Thuróczy CE, Alderkamp AC, Laan P, Gerringa LJA and others (2012) Key role of organic complexation of iron in sustaining phytoplankton blooms in the Pine Island and Amundsen Polynyas (Southern Ocean). Deep Sea Res II 71-76: 49−60
Timmermans KR, Stolte W, de Baar HJW (1994) Iron-medi- ated effects on nitrate reductase in marine phytoplank- ton. Mar Biol 121: 389−396
Timmermans KR, van der Wagt B, de Baar HJW (2004) Growth rates, half-saturation constants, and silicate, nitrate, and phosphate depletion in relation to iron avail- ability of four large, open-ocean diatoms from the South- ern Ocean. Limnol Oceanogr 49: 2141−2151
Timmermans KR, van der Wagt B, Veldhuis MJW, Maatman A, de Baar HJW (2005) Physiological responses of three species of marine pico-phytoplankton to ammonium, phosphate, iron and light limitation. J Sea Res 53:
109−120
van den Berg CMG (1984) Organic and inorganic speciation of copper in the Irish Sea. Mar Chem 14: 201−212 Weber M, Prodohl A, Dreher C, Becker C and others (2011)
SDS-facilitated in vitroformation of a transmembrane b- type cytochrome is mediated by changes in local pH.
J Mol Biol 407: 594−606 Editorial responsibility: Steven Lohrenz,
New Bedford, Massachusetts, USA
Submitted: November 26, 2014; Accepted: May 11, 2015 Proofs received from author(s): July 7, 2015
➤
➤
➤
➤
➤
➤
➤
➤
➤
➤
➤
➤
➤
➤
➤
➤
➤
➤
➤
➤
➤
➤
➤
➤
➤
➤
➤
➤
➤
➤
➤
➤
➤
➤
➤
➤
➤
➤
➤
➤
➤
➤
➤
➤
➤
➤
➤
➤
➤
➤
➤
➤
➤
➤
➤
➤