Cite this:Phys. Chem. Chem. Phys.,2013, 15, 11386
Luminescence spectroscopy of singlet oxygen enables monitoring of oxygen consumption in biological
systems consisting of fatty acids
Anita Gollmer,* Johannes Regensburger, Tim Maisch and Wolfgang Ba¨umler
The interaction of singlet oxygen (1O2) generated in a photosensitized process with well-known reference photosensitizers Perinaphthenone (PN) and TMPyP is investigated in a model system consisting of fatty acids and the respective exogenous photosensitizer (PS) in solution by direct detection of the luminescence photons of1O2at 1270 nm. Such a model system is a first approach to mimic the complex environment of 1O2 in a biological cell which consists mainly of water, proteins, sugars and lipids. Firstly, the important issue of oxygen consumption is evaluated which has to be considered during luminescence detection of1O2. It is known that the luminescence signal of 1O2is dependent on the oxygen concentration of the environment. Cellular components such as lipids represent oxygen consumers due to peroxidation of their unsaturated double bonds. Secondly, the experimental conditions for this model system regarding oxygen consumption are optimized to estimate the rates and rate constants of the coupled system. Thirdly, the triplet decay of the PS can provide more precise information about the actual oxygen concentration close to the PS and can be used, therefore, as a more precise method to determine the oxygen concentration in more complex systems such as a biological cell. The aim is to get a better understanding of photosensitized reactions of1O2with cellular components to further improve methodologies, in particular at a cellular level using luminescence spectroscopy. In conclusion, luminescence detection might be a helpful tool to monitor precisely and promptly changes in oxygen concentration in a complex environment.
Introduction
Molecular oxygen is, without doubt, a very essential molecule on earth.1 Singlet oxygen (1O2), the lowest excited electronic state of ground state oxygen (3O2), can be generated in a photosensitized process by various light absorbing molecules, so-called photosensitizers (PS).2The photo-activated sensitizer transfers energy from its triplet state (T1) to3O2. Furthermore,
1O2is one of the most active intermediates involved in oxygenation reactions in chemical and biological systems.2–5 1O2has a unique and rich chemistry that is substantially different from that of3O2 and other reactive oxygen species (ROS).4In photodynamic therapy (PDT) biological tissue that is undesired, such as tumor or bacterial infected tissue, is destroyed with high specificity.6,7 1O2
is known to play the major role in PDT.8The cellular processes that involve1O2 have not yet been fully understood, in particular in
photo-induced cell death,e.g.the oxidation of certain proteins and fatty acids.2,3,6,9However, generation of1O2can immediately change its environment, in particular in biological cells that consist of proteins and lipids which can chemically react with
1O2.10,11
A direct and precise method to detect1O2is the measure- ment of its luminescence at about 1270 nm, which has been frequently applied.10–19In order to gain a detailed insight into the interaction of a photo-activated PS with molecular oxygen, the measurement of the complete time dependence of 1O2
luminescence is a powerful tool.20 To evaluate the lumines- cence signals, the well-known theoretical model reported by Parker et al.is used,21,22which describes the time-dependent population of the triplet T1 state of a PS and the subsequent generation of1O2by energy transfer.
In the past years, the technology and therefore the sensitivity of optical detectors have substantially improved. Despite the very low quantum efficiency of radiative transition from 1O2
to 3O2, 1O2 can be detected directly by its luminescence in the near infrared, in pure solutions, in fatty acids and lipids,
Department of Dermatology, University Hospital Regensburg, 93042 Regensburg, Germany. E-mail: anita.gollmer@klinik.uni-regensburg.de; Fax:+49-941-944-8943;
Tel:+49-941-944-8945 Received 25th February 2013, Accepted 9th May 2013 DOI: 10.1039/c3cp50841b
www.rsc.org/pccp
PAPER
Published on 14 May 2013. Downloaded by Universitaetsbibliothek Regensburg on 02/08/2016 13:41:01.
View Article Online
View Journal | View Issue
and even in living cells or bacteria.12–14,17,23 At a single cell level, Kuimovaet al.showed a dramatic increase in intracellular viscosity upon generation of1O2using the direct luminescence detection.10
Nevertheless, the interpretation of the luminescence signals and the respective conclusions remain challenging and some- times puzzling, because many parameters influence the course and the meaning of such luminescence signals at the same time. Physical and chemical quenching of 1O2 by cellular molecules can change the luminescence signal. In particular chemical reaction of 1O2 with cellular biomolecules changes the luminescence signal twofold – by shortening the lifetime of the1O2 state and by oxygen consumptionviaperoxidation of lipids or proteins,24,25 which affects the quenching of the photosensitizer triplet T1-state by oxygen while photosensitized generation of1O2is continued.21,26
This correlation between 1O2 luminescence and oxygen consumption results in two important issues,27 which were studied in the present work using a simplified model of fatty acids and photosensitizers. Firstly, there is an urgent need to consider oxygen consumption when detecting 1O2 lumines- cence in an environment that contains oxygen consumers like lipids or proteins. Secondly, the change in rates of the 1O2 luminescence signal might enable monitoring of oxygen concen- tration during irradiation.
The experiments were performed with the well-known Perinaphthenone (PN) which is a lipophilic photosensitizer, and TMPyP, a hydrophilic photosensitizer, in ethanol solution.
PN and TMPyP show a high quantum yield of 1O2 genera- tion.15,28Both PN and TMPyP are therefore frequently used as reference PS in solution experiments and in particular TMPyP for cell suspension experiments and even at a single cell level.29,30Oxygen consumption caused by adding different fatty acids to the PS solution was monitored using a needle sensor as well as by luminescence spectroscopy.
Materials and methods
Preparation of solutions
5,10,15,20-Tetrakis(N-methyl-4-pyridyl)-21H,23H-porphine (TMPyP) (Sigma-Aldrich, Steinheim, Germany) or Perinaphthenone (PN) (Acros Organics, Belgium, purity 97%) were dissolved in ethanol.
Stearic acid, oleic acid, linoleic acid, and linolenic acid (all purity B99%) were dissolved in ethanol to yield a final concentration of 50 mmol L1. All fatty acids were purchased from Sigma-Aldrich (Steinheim, Germany).
Absorption spectra
The absorption cross-section of the photosensitizers was measured at room temperature with a Beckman DU640 spectro- photometer (Beckman Instruments GmbH, Munich, Germany) using a quartz cuvette (QS-101, Hellma Optik, Jena, Germany).
Oxygen concentration in solution
The oxygen concentration in solution was measured in the cuvette using a needle sensor (MICROX TX3, PreSens GmbH,
Regensburg, Germany). Data sampling was accomplished at 1 Hz, and the shown curves were smoothened using a bi-square routine.
Luminescence experiments
All solutions were transferred into a cuvette (QS-101, Hellma Optik, Jena, Germany). The sensitizers were excited using either a frequency-doubled or tripled Nd:YAG laser (PhotonEnergy, Ottensoos, Germany) with a repetition rate of 2.0 kHz (wave- length 532 nm (TMPyP) or 355 nm (PN), pulse duration 70 ns).
The1O2 luminescence at 1270 nm was detected in the near- backward direction with respect to the excitation beam using an infrared sensitive photomultiplier (R5509-42, Hamamatsu Photonics Deutschland GmbH, Herrsching, Germany) with a rise time of about 3 ns. The details of the setup are described elsewhere.31The luminescence signal was detected at 1270 nm using an appropriate interference filter (FWHM 10 nm) in front of the photomultiplier.
Determination of singlet oxygen luminescence decay and rise time
The luminescence intensity of1O2is given by21 IðtÞ ¼ C
b1b2 eb2teb1t
(1)
The constantC was used to fit the luminescence signal and is a product of the oxygen concentration [O2], the rate constant for the deactivation of the triplet state of the PS by 1O2,kT1D, and the concentration of the PS in the triplet state at time zero [T1]0.b2 andb1are the decay and rise rates, respectively. The detected signals were fitted with least square fit routines of Mathematica 5.2 (Wolfram Research, Berlin, Germany). The experimental error of the fit was estimated to be 15% of the values, which are determined by the fit. The integral of eqn (1) from t = 0 - N yields the luminescence energy. For better comparison, the integral value was calculated per mole of the respective substance.
All rates and rate constants of the entire differential equa- tion system are dependent onb1 andb2 (see eqn (2) and (3) below). To determine the rates and rate constants of the entire system (photosensitizer and oxygen molecule) three series of measurements have to be performed. Therefore, the time-resolved singlet oxygen luminescence is detected at different photosensitizer, oxygen or quencher concentrations and fitted to obtainb2andb1as described above. Firstly, the underlying differential equations are solved using different values for rates and rate constants to approximate the experi- mentally obtained rates b1 and b2 (solid lines in Fig. 4–6).
Secondly, that fitting procedure yields the theoretical values of KT1 and KD. In our study it is shown that the theoretical values deviate from the experimentally obtained data at high oxygen and high photosensitizer concentrations due to oxygen consumption and this allows monitoring of oxygen consumption. The evaluation of the data is described in detail by Baieret al.21
Published on 14 May 2013. Downloaded by Universitaetsbibliothek Regensburg on 02/08/2016 13:41:01.
Results and discussion
When a photosensitizer generates 1O2 inside a living cell, processes such as peroxidation of fatty acids lead to oxygen consumption to a still unknown extent. In addition, intact cells are a closed system that exhibit less oxygen concentration as compared to the aqueous environment outside the cell under in vitroorin vivoconditions.32
By comparing experimental and theoretical values,21 one can provide details of the dependence of the1O2luminescence on the various experimental conditions, which helps to interpret the meaning and the reliability of such signals. This is of particular importance when the sub-cellular environment of
1O2 is changed by 1O2 itself during the time span that is necessary for its detection. As a first approach to this complex environment, we evaluated a basic model that contained the PS in solution, oxygen and fatty acids, whereas the latter played the role of oxygen consumers. Fatty acids such as oleic and linoleic acid are common constituents of many cellular membranes.33
As a first step, we quantified the extent of oxygen consumption.
The PS was added to ethanol solutions that contained fatty acids with different number of double bonds but with the same chain length. The concentrations of stearic acid (18 : 0), oleic acid (18 : 1), linoleic acid (18 : 2), or linolenic acid (18 : 3) were 50 mmol L1 each. The brackets show the ratio of the number of carbon atoms to the number of double bonds of the respective fatty acids. The respective solutions were filled in a cuvette (3.30.1 ml) that was hermetically closed. A needle sensor continuously reported the overall oxygen concentration in the sealed cuvette during irradia- tion. To minimize oxygen diffusion effects, we thoroughly stirred the solutions during irradiation. All experiments were started with air-saturated solutions ([O2] = 1850mmol L1, ethanol).
Oxygen consumption in fatty acid solutions with the photosensitizer PN
PN (200mmol L1) in ethanol solution was irradiated without and with the different fatty acids at 355 nm (100 mW). During the time span of 10 min irradiation, the oxygen concentration decreased and the decrease was maximal for the fatty acid with three double bonds (linolenic acid) (Fig. 1a). The decrease of oxygen concentration in the suspension could be fitted with the zero-order equation for photochemical reactions within the first 4 min. The fits yielded the respective consumption of oxygen per second, which are listed in Table 1. After that time, the fit clearly deviates from the data points, whereas the complete time span could not be fitted by any other order of reactions. Obviously, other processes occur in solution during the long-lasting irradiation.
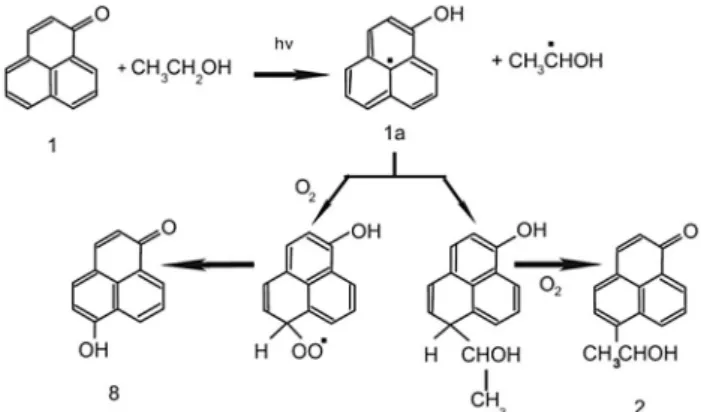
Without fatty acids, irradiation of PN in ethanol showed oxygen consumption (Fig. 1a) yielding a rate constant of 0.6 mmol L1 s1 (Table 1). Kuznetsova et al. have already shown chemical alteration of PN in ethanol, whereas PN is reduced to a ketyl radical which can interact with oxygen and alcoholic radicals leading to oxygen consumption in the system only by the ketyl radical (compound1ain Fig. 2).34The reaction products are hydroxyphenalenone anda-hydroxyethylphenalenone
(compound 8and compound2 in Fig. 2, respectively). It was likewise assumed that PN abstracted hydrogen from the solvent by its excited triplet T1 state leading to hydroxyethyl radicals (Fig. 2).35
Fig. 1 The oxygen concentration measured in the sealed cuvette that contained different fatty acids at 50 mmol L1 together with the photosensitizer PN at 200mmol L1(a) or together with TMPyP at 25mmol L1(b). Both photosensi- tizers produced1O2molecules at a rate of about 1017s1. For comparison, the fit of the integrated luminescence signal of1O2(see Fig. 3) is added to (a).
Table 1 Oxygen consumption by fatty acids
Fatty acid
Length:
double bonds
Rate constant (mmol L1s1) (with TMPyP)
Rate constant (mmol L1s1) (with PN)
None 0 0.6
Stearic acid 18 : 0 0 0.9
Oleic acid 18 : 1 1.2 1.2
Linoleic acid 18 : 2 2.3 1.6
Linolenic acid 18 : 3 3.6 2.3
Generation of1O2molecules 0.91017s1 1.01017s1
PCCP Paper
Published on 14 May 2013. Downloaded by Universitaetsbibliothek Regensburg on 02/08/2016 13:41:01.
When adding stearic acid as a fatty acid without any double bonds to PN solution, the rate of oxygen consumption increased to 0.9mmol L1s1(Fig. 1a). After light absorption by PN, the energy is rapidly transferred to its triplet state yielding two major options:
either energy is transferred to generate1O2or hydrogen is abstracted from the solvent ethanol to generate ketyl radicals that interact with oxygen and cause oxygen consumption (Fig. 2). Regarding the subsequent process of oxygen consumption, stearic acid with no double bonds cannot chemically quench oxygen resulting in oxygen consumption in the solution. However, the stearic acid offers a substantial amount of hydrogen atoms, which additionally can be abstracted by the PN triplet T1state. As a consequence, this could enhance the generation of ketyl radicals that additionally can trap oxygen leading to oxygen consumption (Fig. 2).
When adding fatty acids with double bonds to PN solution (oleic, linoleic or linolenic acid, 50 mM),1O2can also attack the double bonds leading to oxygen consumption. In our experi- mental setting, the rate of 1O2 generation can be calculated.
With regard to the absorption cross section of PN at 355 nm (3.31017cm2) and the concentration of 200mmol L1, 98%
of laser photons are absorbed in the cuvette with a thickness of 1 cm. The applied mean optical power of 50 mW yields 0.9 1017 photons per second that are absorbed in the solution. The quantum yield of singlet oxygen FD E 1 for PN15provides a sufficiently high rate of1O2generation of about 0.91017 1O2molecules per second. This value is clearly higher compared to the rate of oxygen molecules that disappear in linolenic acid solution showing a value of about 41015 1O2 molecules per second in our experimental setting. A fraction might be physically deactivated bye.g.the solvent molecules.
The values in Table 1 show that oxidation of fatty acids with double bonds such as oleic acid increased the oxygen consumption only to a small extent, from 0.9mmol L1s1to 1.2mmol L1s1. In addition, the rate did not correlate with the number of double bonds (Table 1). To elucidate this process, we performed the experiments with the photo-stable TMPyP to generate1O2. Oxygen consumption in fatty acid solutions with the photosensitizer TMPyP
TMPyP was excited with 532 nm laser light in the visible spectrum and 250 mW mean power for up to 10 min. As for
experiments with PN, we calculated the rate of1O2generation.
An absorption cross section of TMPyP at 532 nm (1.5 1017cm2), a concentration of 25mmol L1, a cuvette thickness of 1 cm, and a power of 250 mW yield 1.3 1017 photons per second that are absorbed in the solution. Since the quan- tum yield of 1O2 of TMPyP is FD E 0.77,30 we should have generated about 1.0 1017 1O2 molecules per second. This value is close to1O2generation in experiments with PN.
TMPyP in pure solution is physically and chemically stable even under long-lasting irradiation at 532 nm causing no oxygen consumption (data not shown). Oxygen consumption is zero in the presence of stearic acid within experimental accuracy. In the presence of the different fatty acids during irradiation, Fig. 1b shows a linear decrease of oxygen concen- tration in solution for long irradiation times. Compared to oleic acid (1.2 mmol L1 s1), the rate constant for linoleic acid is nearly doubled due to the presence of two isolated double bonds that lead to a higher reactivity towards1O2. In the case of linolenic acid (three double bonds), the rate constant is tripled as compared to oleic acid (Table 1). In conclusion, oxygen consumption with photostable TMPyP correlates with the number of double bonds.
However, after having established that there is oxygen con- sumption during irradiation of PN in ethanol at 355 nm, in the following paragraph the reference photosensitizer PN is further investigated using the above-mentioned experimental settings.
The aim is to gain more insights into the complex system consisting of a photounstable and oxygen consuming PS.
Singlet oxygen generation of PN in pure ethanol solutions To elucidate further the properties of PN during1O2generation, we investigated photostability and 1O2 generation by photo- activated PN in pure ethanol. It is obvious that the less PS molecules are intact the less1O2molecules can be generated by energy transfer. As for every PS, light-induced decomposition of PN would affect the quantitative 1O2 detection and therefore, the interpretation of the luminescence data.
We dissolved PN in air-saturated ethanol at a concentration of 100 mM and continuously irradiated for up to 30 min (100 mW, 355 nm). Prior to irradiation, the absorption cross- section of PN is (3.30.2)1017cm2at 355 nm. After 30 min of irradiation, the value decreases to (0.60.2)1017cm2, indicating a substantial change in PN molecules. HPLC of irradiated PN revealed that the PS completely disappeared in solution after about 30 min of irradiation and 12 products appeared (data not shown).
Additionally, we detected1O2luminescence (detection time:
10 s) at regular time intervals (3 min) during the continuous irradiation time of 30 min. We quantified the signal by tem- poral integration of the luminescence signal (Fig. 3). The total luminescence signal decreased rapidly with irradiation time showing a rate of about 2.7103s1fitted by a monoexpo- nential function within the first 4 min. After that time, the decrease reduced and reached a nearly constant value after about 20 min of irradiation. The decrease of1O2luminescence correlated with the decrease of PN absorption at 355 nm.
Fig. 2 Radical formation of PN in EtOH.34Molecule (1) represents PN, (1a) the ketyl radical, (8) hydroxyphenalenone and (2)a-hydroxyethylphenalenone.
Published on 14 May 2013. Downloaded by Universitaetsbibliothek Regensburg on 02/08/2016 13:41:01.
However, the luminescence of1O2did not disappear although HPLC showed no PN after 30 min but only PN products (data not shown). These photoproducts also absorb at a wavelength of 355 nm and some of these PN products might generate1O2, possibly with different quantum yields. When reviewing the experiments above, the decrease of1O2generation in the first 4 min should be mainly responsible for the attenuation of the rate constants in fatty acid solution that is obvious for times longer than 4 min of irradiation (Fig. 1a). The apparent photo- instability of PN for long irradiation times (minutes) should also be responsible for the lack of correlation between the rate constant of oxygen consumption and the number of double bonds in the respective fatty acid (Table 1).
When using photounstable PS such as PN, it is recom- mended to investigate the photophysical properties under the given experimental conditions and optimize given parameters such as irradiation intensities and irradiation times (minutes).
The next paragraph shows that under optimized conditions the photophysical parameters such as the rate and rate constants of the given system PN in ethanol are not influenced and further do not influence data interpretation in more complex systems.
Singlet oxygen generation of PN in pure ethanol solutions at different oxygen concentrations
In this section, the investigation of the correlation between oxygen partial pressure and 1O2 luminescence is presented, which was performed by applying different oxygen concen- trations in solution. Using a concentration of 25 mmol L1 in ethanol, PN was excited at 355 nm. By fitting eqn (1) to the time-resolved luminescence signal of1O2, the rise and decay ratesb1 and b2 can be obtained. The evaluation of rise and decay rates enables the determination of the rates and the rate constants of the underlying differential equation system.
The latter describes the coupled system (energy transfer) of PS and oxygen, which is described in detail elsewhere.21
When taking the previous results with PN into account, the experiment was performed under two different conditions in order to optimize the experimental conditions and in order to investigate the potential influence of the decomposition of the PN molecule on the rise and decay rates. Firstly, we used a short exposure time of 10 s and the solution was exchanged after two measurements. Secondly, we performed the same experiment without exchanging the PN solutions during the entire proce- dure and extended the luminescence detection time from 10 to 20 s. The rates were measured at different oxygen concentra- tions (0 to 1.85 mmol L1) by flowing the solution with nitrogen prior to irradiation. The actual oxygen concentration in solution was measured using the needle sensor.36 Using the differential equation system,21 we calculated the theoretical values for a known and constant oxygen concentration and fitted them to experimental values (solid lines in Fig. 4).
In both experimental settings, the values ofb1andb2did not change in spite of the beginning degradation of the PS. In the inset of Fig. 4 the measured values at low oxygen concentra- tions are depicted. Thus, the change in PN molecules does not affect the evaluation of the rates and rate constants of the coupled differential equation system when using our experi- mental conditions, in particular short irradiation times.
In addition, the ratesb1andb2of the luminescence signal of
1O2were determined at a fixed oxygen concentration (370mmol L1) but at different PN concentrations up to 50mmol L1 (data not shown). Here, the rates and rate constants were not affected by the photoinstability of PN.
In light of these results and using the appropriate experi- mental setting, we now can neglect effects of PN photoinstability and subsequent oxygen consumption on our luminescence detection. As a consequence, linoleic acid with two double bonds was added to solution to investigate the dependence of the rate and rate constants in systems that can chemically quench1O2
Fig. 3 The integrated time resolved1O2luminescence signal at different irradia- tion times of 100mmol L1PN dissolved in ethanol. The acquisition time of the luminescence signals was 10 s at regular time intervals of 3 min during a constant irradiation with 100 mW (355 nm) for 30 min.
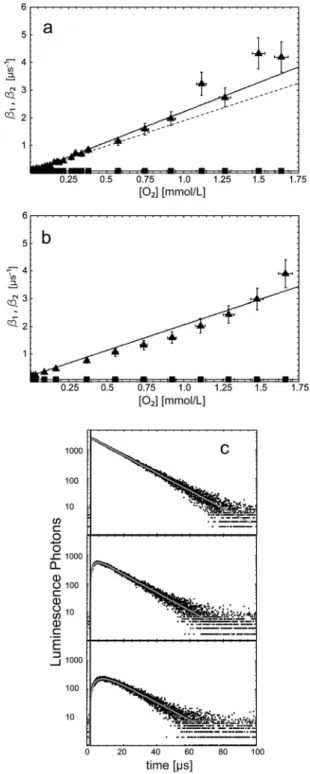
Fig. 4 Dependence of the rise rateb1and decay rateb2of the luminescence of
1O2on the concentration of oxygen (25mmol L1PN dissolved in ethanol). The open symbols show the values without a change of the solution during measurement. Closed symbols show the values with a change of the solution after two single measurements. The area around the crossing point is depicted in the inset.
PCCP Paper
Published on 14 May 2013. Downloaded by Universitaetsbibliothek Regensburg on 02/08/2016 13:41:01.
which is pertinent to biological systems such as single cells or cell suspensions.
Singlet oxygen generation of PN in linoleic acid solution at different oxygen concentrations
Comparable to solutions without fatty acids, the rise rateb1and the decay rateb2of the1O2luminescence were determined at different oxygen concentrations in the presence of linoleic acid.
The short detection time of 10 s yielded a sufficient 1O2 luminescence signal. Using the differential equation system,21 we calculated the luminescence rates at a known and constant oxygen concentration in fatty acid solution and fitted them to the experimental values (solid lines, Fig. 5). The deviations of the measured decay rates b2 from the calculated theoretical values are in the range of experimental accuracy.
The rise ratesb1of the luminescence signal for linoleic acid deviate from the calculated values (solid lines, Fig. 5a), in particular at high oxygen concentrations. As already mentioned above, oxygen is consumed by PN and oxidizable fatty acids.25 At high oxygen concentrations and assuming no energy back transfer,21the meanings of the ratesb1andb2are as follows:
b1=KT1=kT1+ (kT1O2+kT1D) [O2] +kT1SO[P] +kT1Q[Q] (2) b2=KD=kD+kDSO[P] +kDQ[Q] (3) In eqn (2) and (3), [P] represents the photosensitizer concen- tration and [Q] represents the quencher concentration. Eqn (2) shows thatKT1and thusb1depend on the oxygen concentration.
Any change in the local oxygen concentration during measure- ment will be reflected in the rise rate. In contrast toKT1(b1), the decay rateKD(b2) is independent of the oxygen concentration.
Furthermore, the oxygen consumption is maximal in the center of the excitation beam in the middle of the cuvette. This change in local oxygen concentration causes a gradient of oxygen concentration that should be balanced by oxygen diffusion.10,37 The small diffusion coefficients for oxygen in solvents may hamper the diffusion-controlled process of1O2generation. The average value of the square of distanced, which an O2molecule travels during time t, depends on its diffusion coefficient D0
according tod2= 6D0t.28D0is 2.64105cm2s1for oxygen in ethanol37at 303 K and the laser spot size in the cuvette is 8 mm.
Thus, oxygen redistribution lasts several minutes. A magnetic stirrer was switched on during irradiation to minimize the effect of the oxygen gradient. Now, the detected rise ratesb1 of1O2
luminescence fitted better to the theoretical lines (Fig. 5b).
It is assumed that such an enforced oxygen redistribution should fail inside living cells or bacteria, in which the diffusion coefficient is even smaller as compared to pure solvents.38 Thus, it is important to consider oxygen consumption when detecting and interpreting 1O2 luminescence (rise and decay times) in environments that contain fatty acids, in particular in living cells or bacteria. In future, the theoretical values of1O2 generation have to be adapted to oxygen consumption in the case of high concentrations of oxygen consumers such as unsaturated fatty acids.
Luminescence experiments at different PN concentrations The effect of oxygen gradients was investigated in the following experiment. PN was exemplarily added (up to 50mmol L1) to solutions of linoleic acid (50 mmol L1). We determined the
Fig. 5 Dependence of the rise rateb1(triangles) and the decay rateb2(squares) of the1O2luminescence signal on the concentration of oxygen with 25mmol L1 PN and with linoleic acid (18 : 2). The detection was performed without (a) and with magnetic stirring (b). For comparison, the theoretical fit of data in Fig. 5b is added as a dashed curve to Fig. 5a.1O2luminescence signals are shown for three different oxygen concentrations (c), 1850mmol L1 (top,tR= 0.3ms), 222mmol L1(middle,tR= 2.2ms), and 74mmol L1(bottom,tR= 4.7ms).
Published on 14 May 2013. Downloaded by Universitaetsbibliothek Regensburg on 02/08/2016 13:41:01.
rates of 1O2 luminescence at a fixed oxygen concentration (370 mmol L1) without stirring the solution. At this oxygen concentration, the fit of luminescence signals is optimal because of the longer rise time of the luminescence, which reflects the rateKT1(Fig. 5c).
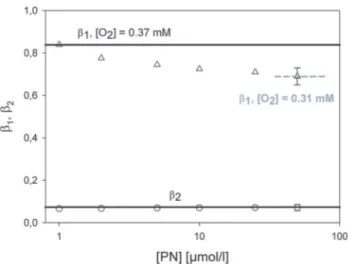
The values (solid lines in Fig. 6) of the decay ratesb2, which are calculated by solving the differential equation system at a fixed oxygen concentration, fitted within experimental accuracy to the experimental values. The calculated values of the rise rates b1 fit the experimental values only at very small PN concentrations. The generation rate of 1O2 is about 4.5 to 45 1015 s1 (1 to 10 mmol L1 of PN). With increasing PN concentrations in solution, the respective rise rateb1 of 1O2
decreases. The values were recalculated andb1(50 mmol L1 PN) fitted now to an oxygen concentration of 310 mmol L1 (Fig. 6). Thus, the deactivation of the triplet T1 state corre- sponds to a local oxygen concentration of 310mmol L1, which is confined to the laser beam inside the cuvette.
The time span of1O2generation and its detection was 5 s.
This yields a rate constant of 12 mmol L1 s1 for oxygen consumption. This value is larger as expected when considering the values determined above with about 1.6mmol L1s1for linoleic acid using the needle sensor. Thus, the portion of fatty acid molecules that undergo peroxidation should be clearly higher in the center of the excitation beam as assumed above.
Obviously, the rateKT1of the luminescence signal seems to be a precise and fast detector of oxygen concentration at the site of1O2generation.
Conclusion
The photophysical and photochemical stability is a major prerequisite for all PS when applied in any kind of photo- dynamic processes such as PDT or when applied in 1O2
luminescence experiments. Showing a quantum yield of 1O2
generation close to unity, PN is frequently used as a reference PS, however, long time irradiation should be avoided in ethanol solution. The molecule is photo-unstable consuming oxygenvia radical reactions, in particular abstracts hydrogen from other molecules (e.g. fatty acids). However, by optimizing experi- mental conditions such as short time excitation of a few seconds, PN is sufficiently photo-stable to be used in experi- ments with1O2. Comparable experiments should be performed for all other PS before using them in a more complex system in combination with cellular components and even in cell experi- ments. TMPyP has been shown to be a suitable candidate for such experiments.
Moreover, the deactivation of the PS triplet T1 state can provide an indication of the actual oxygen concentration at the site of1O2generation as well as the oxygen consumption by bio- molecules like fatty acids. The time resolved1O2luminescence might become an additional tool for a fast and precise detec- tion of oxygen concentration, even in living cells during PDT.
To detect time-resolved1O2luminescence, other researchers also frequently apply the experimental arrangement used in our experiments. The results show that the use of laser excitation, which exhibits a focused beam with a Gaussian intensity profile, can lead to oxygen gradients due to oxygen consump- tion via 1O2 reactions at the site of irradiation. This is of particular importance when oxygen diffusion is hampered, e.g. by cellular structures in living cells. Depending on the irradiation and detection time, the luminescence signals of1O2
should change. One important aspect such as the oxygen consumption by fatty acids as well as by proteins has to be considered when interpreting luminescence signals originating from 1O2. Further development of methodology might be necessary in future to consider or to avoid such gradients.
Acknowledgements
The present work was supported by two grants of the German Research Foundation (DFG), grant number GO2340/1-1 (Anita Gollmer) and RE3323/2-1 (Johannes Regensburger). The authors declare no conflict of interest.
References
1 N. Lane,Oxygen: the molecule that made the world, Oxford University Press, 2002.
2 P. R. Ogilby,Chem. Soc. Rev., 2010,39, 3181–3209.
3 R. W. Redmond and I. E. Kochevar,Photochem. Photobiol., 2006,82, 1178–1186.
4 E. L. Clennan and A. Pace,Tetrahedron, 2005,61, 6665–6691.
5 R. D. Scurlock, B. J. Wang, P. R. Ogilby, J. R. Sheats and R. L. Clough,J. Am. Chem. Soc., 1995,117, 10194–10202.
6 P. Agostinis, K. Berg, K. A. Cengel, T. H. Foster, A. W. Girotti, S. O. Gollnick, S. M. Hahn, M. R. Hamblin, A. Juzeniene, D. Kessel, M. Korbelik, J. Moan, P. Mroz, D. Nowis, J. Piette, B. C. Wilson and J. Golab, Ca–Cancer J. Clin., 2011, 61, 250–281.
Fig. 6 Dependence ofb1andb2on the concentration of PN with linoleic acid in solution. The black solid lines indicate the theoretical values forb1andb2for a constant oxygen concentration of 370mmol L1. The grey dashed line represents the theoretical value for an oxygen concentration atB310mmol L1that is obtained due to oxygen consumption.
PCCP Paper
Published on 14 May 2013. Downloaded by Universitaetsbibliothek Regensburg on 02/08/2016 13:41:01.
7 T. Maisch, S. Hackbarth, J. Regensburger, A. Felgentraeger, W. Baeumler, M. Landthaler and B. Roeder, Journal Der Deutschen Dermatologischen Gesellschaft, 2011,9, 360–366.
8 M. C. DeRosa and R. J. Crutchley,Coord. Chem. Rev., 2002, 233, 351–371.
9 G. B. Kharkwal, S. K. Sharma, Y.-Y. Huang, T. Dai and M. R. Hamblin,Lasers Surg. Med., 2011,43, 755–767.
10 M. K. Kuimova, G. Yahioglu and P. R. Ogilby,J. Am. Chem.
Soc., 2009,131, 332–340.
11 R. L. Jensen, J. Arnbjerg and P. R. Ogilby,J. Am. Chem. Soc., 2012,134, 9820–9826.
12 J. Baier, T. Maisch, M. Maier, M. Landthaler and W. Baumler, J. Invest. Dermatol., 2007,127, 1498–1506.
13 M. T. Jarvi, M. J. Niedre, M. S. Patterson and B. C. Wilson, Photochem. Photobiol., 2006,82, 1198–1210.
14 T. Maisch, J. Baier, B. Franz, M. Maier, M. Landthaler, R. M. Szeimies and W. Ba¨umler,Proc. Natl. Acad. Sci. U. S. A., 2007,104, 7223–7228.
15 S. Nonell, M. Gonzalez and R. Trull, Afinidad, 1993, 448, 445–450.
16 K. Chen, A. Preuss, S. Hackbarth, M. Wacker, K. Langer and B. Roder,J. Photochem. Photobiol. B, 2009,96, 66–74.
17 S. Hackbarth, J. Schlothauer, A. Preuss and B. Roder, J. Photochem. Photobiol. B, 2010,98, 173–179.
18 P. F. Conn, W. Schalch and T. G. Truscott, J. Photochem.
Photobiol. B, 1991,11, 41–47.
19 M. A. Rodgers,Photochem. Photobiol., 1983,37, 99–103.
20 J. Regensburger, T. Maisch, A. Felgentraeger, F. Santarelli and W. Baeumler,J. Biophotonics, 2010,3, 319–327.
21 J. Baier, T. Fuß, C. Po¨llmann, C. Wiesmann, K. Pindl, R. Engl, D. Baumer, M. Maier, M. Landthaler and W. Ba¨umler,J. Photochem. Photobiol. B, 2007,87, 163–173.
22 J. G. Parker and W. D. Stanbro,Prog. Clin. Biol. Res., 1984, 170, 259–284.
23 T. Breitenbach, M. K. Kuimova, P. Gbur, S. Hatz, N. B. Schack, B. W. Pedersen, J. D. Lambert, L. Poulsen and P. R. Ogilby, Photochem. Photobiol. Sci., 2009,8, 442–452.
24 H. P. Wang, S. Y. Qian, F. Q. Schafer, F. E. Domann, L. W. Oberley and G. R. Buettner,Free Radicals Biol. Med., 2001,30, 825–835.
25 A. W. Girotti,Free Radicals Biol. Med., 2008,44, 956–968.
26 K.-K. Iu and P. R. Ogilby,J. Phys. Chem., 1987,91, 1611–1617.
27 A. W. Girotti,J. Lipid Res., 1998,39, 1529–1542.
28 C. Schweitzer and R. Schmidt, Chem. Rev., 2003, 103, 1685–1757.
29 E. F. F. da Silva, B. W. Pedersen, T. Breitenbach, R. Toftegaard, M. K. Kuimova, L. G. Arnaut and P. R. Ogilby,J. Phys. Chem. B, 2012,116, 445–461.
30 J. W. Snyder, J. D. Lambert and P. R. Ogilby, Photochem.
Photobiol., 2006,82, 177–184.
31 J. Baier, T. Maisch, J. Regensburger, M. Loibl, R. Vasold and W. Baumler,J. Biomed. Opt., 2007,12, 064001.
32 K. A. Schenkman,Am. J. Physiol., 2001,281, H2463–2472.
33 P. J. Quinn and D. Chapman,Crit. Rev. Biochem., 1980,8, 1–117.
34 N. A. Kuznetsova, O. L. Kaliya, N. D. Sergeeva and S. L. Solodar,Zh. Org. Khim., 1987,23, 388–392.
35 E. Oliveros, S. Bossmann, S. Nonell, C. Marti, G. Heit, G. Tro¨scher, A. Neuner, C. Martinez and A. Brauna,New J.
Chem., 1999,23, 85–93.
36 D. Baumer, M. Maier, R. Engl, R. M. Szeimies and W. Baumler,Chem. Phys., 2002,285, 309–318.
37 N. N. Kruk,J. Appl. Spectrosc., 2008,75, 174–180.
38 S. Hatz, L. Poulsen and P. R. Ogilby,Photochem. Photobiol., 2008,84, 1284–1290.
Published on 14 May 2013. Downloaded by Universitaetsbibliothek Regensburg on 02/08/2016 13:41:01.