Transactions
PAPER
Cite this:Dalton Trans., 2015,44, 8506
Received 28th August 2014, Accepted 10th November 2014 DOI: 10.1039/c4dt02631d www.rsc.org/dalton
A new class of luminescent Cu( I ) complexes with tripodal ligands – TADF emitters for the yellow to red color range †
Timo Gneuß,aMarkus J. Leitl,bLars H. Finger,aNicholas Rau,aHartmut Yersin*band Jörg Sundermeyer*a
A new class of emissive and neutral Cu(I) compounds with tripodal ligands is presented. The complexes were characterized chemically, computationally, and photophysically. Under ambient conditions, the powders of the compounds exhibit yellow to red emission with quantum yields ranging from about 5% to 35%. The emission represents a thermally activated delayedfluorescence (TADF) combined with a short- lived phosphorescence which represents a rare situation and is a consequence of high spin–orbit coup- ling (SOC). In the series of the investigated compounds the non-radiative rates increase with decreasing emission energy according to the energy gap law while the radiative rate is almost constant. Furthermore, a well-fit linear dependence between the experimental emission energies and the transition energies cal- culated by DFT and TD-DFT methods could be established, thus supporting the applicability of these computational methods also to Cu(I) complexes.
Introduction
In the last few decades, luminescent copper(I) complexes have been intensely studied due to their structural and photophysical diversity.1–12 Research in this field has gained additional momentum recently, since such complexes can be highly attrac- tive for application in organic-light emitting diodes (OLEDs) or light-emitting electrochemical cells (LEECs).13–27This is because Cu(I) complexes often exhibit a thermally activated delayed fluo- rescence (TADF),28–37which allows utilizing all injected excitons for the generation of light by making use of the singlet harvest- ing effect.28–32,34–37In this regard, Cu(I) complexes can provide a low-cost alternative to expensive emitters based on 3rdrow tran- sition metals, such as platinum or iridium.34,35,38–53
For Cu(I) compounds, different structure motifs have been in the focus of research. In particular, extensive photophysical
studies were conducted for copper(I) complexes that are pseudo-tetrahedrally coordinated by two bidentate chelating ligands. Homoleptic complexes with N^N (bisimine)6,9,10,54–60
or P^P (bisphosphine)54,61–63 ligands as well as heteroleptic
complexes with N^N/P^P (bisimine/
bisphosphine)10,28,31,32,54,64–66ligands were investigated. Typi- cally, for such complexes optical or electrical excitation induces a metal-to-ligand charge transfer (MLCT) by which Cu(I) is formally oxidized to Cu(II).1,5,6,9,31,32,56,67 Such a transition is accompanied by a flattening distortion towards a more planar geometry that promotes non-radiative de- activation pathways and as a consequence results in a reduction of the emission quantum yield.2,10,28,31,32,57–59
Also, several three-coordinate, trigonal Cu(I) complexes with one monodentate and one bidentate ligand have been studied.20,37,68–73These complexes exhibit structural reorganiz- ation on excitation as well, which is represented by the so- called Y→T shape distortion.20,70,71Similarly to the complexes with two bidentate ligands, these distortions result in an increased non-radiative deactivation.
Besides mononuclear complexes, dinuclear Cu(I) complexes and Cu(I) clusters have also been studied.4,11,27,29,30,74–79
In this work, a new class of luminescent mononuclear copper(I) halide complexes with tripodal ligands has been investigated. Compounds with this structural motif have been much less explored for their photophysical behavior. To our knowledge, only a few tripodally coordinated Cu(I) complexes have been investigated accordingly.80,81The complexes studied
†Electronic supplementary information (ESI) available: Discussion of the mole- cular structure oftpyas, packing diagrams of complexesC1,C2andC3, and details of quantum chemical calculations and emission spectra. CCDC 1021437–1021446. For ESI and crystallographic data in CIF or other electronic format see DOI: 10.1039/c4dt02631d
aPhilipps-Universität Marburg, Materials Science Centre and Fachbereich Chemie, Hans-Meerwein-Straße 4, 35032 Marburg, Germany.
E-mail: jsu@staff.uni-marburg.de; Fax: +49 (0)6421 28-25711;
Tel: +49 (0)6421 28-25693
bUniversität Regensburg, Institut für Physikalische Chemie, Universitätsstr. 31, 93053 Regensburg, Germany. E-mail: hartmut.yersin@ur.de;
Fax: +49 (0)941 943-4488; Tel: +49 (0)941 943-4464 Open Access Article. Published on 12 November 2014. Downloaded on 12/02/2016 09:56:11. This article is licensed under a Creative Commons Attribution 3.0 Unported Licence.
View Article Online
View Journal | View Issue
in this contribution are based on five different tripodal ligands, tris(2-pyridyl)phosphine oxide (tpypo) L1, tris(2-pyridyl)phos- phine sulfide (tpyps) L2, tris(2-pyridyl)phosphine selenide (tpypse) L3, tris(2-pyridyl)arsine oxide (tpyaso) L4, and tris(2- pyridyl)methane (tpym)L5. By reacting these ligands with the respective copper halide CuX (X = Cl, Br, I), the complexes [CuCltpypo]C1, [CuBrtpypo]C2, [CuItpypo]C3, [CuCltpyps]C4, [CuBrtpyps]C5, [CuItpyps]C6, [CuItpypse]C7, [CuItpyaso]C8, and [CuItpym]C9were created. For these, the structures were determined using NMR spectroscopy, mass spectrometry, elemental analysis, and X-ray analysis. Moreover, photophysical studies and characterizations as well as quantum chemical calculations were carried out for this series of Cu(I) complexes.
Results and discussion
Synthesis of the ligands
The three ligands tpypoL1, tpypsL2, and tpypseL3were pre- pared in a two-step synthesis (Scheme 1). Tris(2-pyridyl)phos- phine (tpyp) was synthesized from 2-bromopyridine and phosphorus trichloride viathe classical method.82,83For this purpose 2-lithiopyridine was generated withnBuLi at−78 °C.
Further reaction with phosphorus trichloride under salt elim- ination at−100 °C gave the desired product. Meanwhile, other synthetic methods are known to prepare tpyp, for example, with 2-bromopyridine and red phosphorus.84–86In the second step, the oxidized ligand tpypoL1was synthesized according to a previously published method, which was slightly modi- fied. In the literature,87–90 hydrogen peroxide solution was used to oxidize tpyp, whereas in our proceduretBuOOH (80%
in DTBP) was used. The other two ligands tpypsL2and tpypse L3could be easily prepared by refluxing tpyp with elemental sulfur or gray selenium in toluene.87,88 The progress of the
reaction could be monitored via 31P-NMR spectroscopy. An excess of sulfur or selenium in the reaction mixture was separ- ated by filtrationviaa syringe filter. Yields between 45% and 94% were reached in the oxidation reactions.
The synthesis of the arsine ligand tpyasoL4was carried out analogously to tpypoL1. First, the arsine compound tpyas is formed followed by oxidation withtBuOOH solution to tpyaso L4(Scheme 2). In contrast to tpyp, the arsine compound tpyas is stable in air.
The methane ligand tpymL5was prepared by a literature- known method.91First, 2-picoline is lithiated with nBuLi fol- lowed by reaction with 2-fluoropyridine under salt elimination (Scheme 3). The obtained mixture of the desired tpymL5and the by-product di(2-pyridyl)methane dpym was separated by distillation.
Synthesis of the copper(I) complexes
In this section the syntheses of nine new copper(I) complexes are presented (Scheme 4). To obtain the complexes, the ligand was dissolved in acetonitrile and reacted with a copper(I) halide (CuCl, CuBr, and CuI) at ambient temperature. A colored
Scheme 1 Synthetic route to the ligands tpypoL1, tpypsL2, and tpypse L3.
Scheme 2 Synthetic route to the arsine ligand tpyasoL4.
Scheme 3 Synthesis of the methane derivative tpymL5.
Scheme 4 Synthesized emissive copper(I) complexes.
Open Access Article. Published on 12 November 2014. Downloaded on 12/02/2016 09:56:11. This article is licensed under a Creative Commons Attribution 3.0 Unported Licence.
precipitate was formed, which was collected by centrifugation.
The yields of the different Cu(I) complexes varied significantly from 17% to 75%, depending on the solubility of the respective complex in the solvent.
We have also studied the coordination compounds of the phosphine tpyp with Cu(I) halide. Since the compounds are insoluble in common organic solvents, they could not be ade- quately characterized. It is assumed that the compounds are coordination polymers involving P–Cu interactions.
X-ray crystal structures
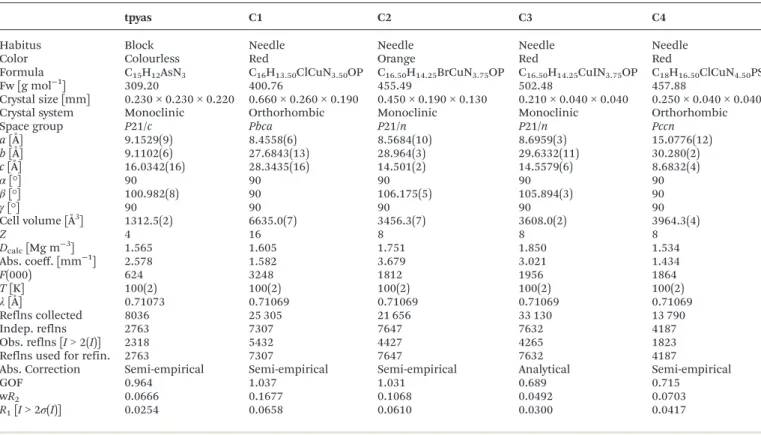
Crystal structures of tpyas and of the copper(I) complexesC1– C9 have been determined using X-ray diffraction measure- ments. The crystallographic data and structure refinement details are summarized in Tables 1 and 2. Selected bond dis- tances and angles are listed for ligand tpyas in Fig. S1†and for complexesC1–C9in Tables 3 and 4. The crystal structure of tpyas is discussed only in the ESI,†since no complexes have been made with this ligand.
Suitable single crystals of copper complexesC1–C9could be obtained from a saturated acetonitrile solution (at ambient temperature) after storing for a few days at 4 °C. The complexes crystallize either in the monoclinic or orthorhombic crystal system. As a representative example of all the copper com- pounds investigated here, the molecular structures of the three complexes [CuItpypo] C3, [CuItpyaso] C8, and [CuItpym] C9 are shown in Fig. 1. The copper centers are coordinated by the halide anion and the three N atoms of the tripodal ligand in a distorted tetrahedral configuration. In each case, the halide atom deviates slightly from the Y–Cu axis (Y = P, As, C), which is due to packing effects that result from interactions with neighboring molecules (see Fig. S2–S4† for the three com- plexesC1–C3exhibiting the most pronounced bending of the halide). This is supported by quantum chemical calculations performed on the complex [CuCltpypo]C1which predict that the energy of the molecule is minimal if the chloride is lying on the P–Cu axis corresponding to an angle of P1–Cu1–Cl1 = 180°. However, bending the chloride away from this axis by 10°, corresponding to an angle of P1–Cu1–Cl1 = 170°, results only in a minor energy increase of 1 kJ mol−1. This indicates that the potential energy surface describing the halide bending is very flat. For the three complexes [CuCltpypo]C1, [CuBrtpypo]C2, and [CuItpypo]C3the halide bending is most pronounced, with a bending angle of about 10° (P1–Cu1–X1≈ 170°) away from the P–Cu axis (see the angle Y(P, As, C)–Cu–X) in Tables 3 and 4). For the two complexes [CuBrtpyps]C5and [CuItpyps]C6with bonding angles of P1–Cu1–Br1 = 176.7(0)°
and P1–Cu1–I1 = 178.4(1)°, respectively, the halide bending is relatively small.
The bond lengths of the various Cu–N bonds vary only slightly within the range of 2.027(3) Å to 2.091(2) Å for all investigated copper complexes. The bite angle N–Cu–N for the complexes with the tripodal phosphine ligands range from 93.2(4)° to 98.5(1)°. The bite angle is slightly larger for [Cul- typaso]C8with the tripodal arsine ligand, with angles of N1– Cu1–N2 = 101.5(4)°, N1–Cu1–N3 = 97.3(4)°, and N2–Cu1–N3 =
97.4(4)°. In [CuItpym]C9with the tripodal methane ligand the bite angle is significantly smaller, with angles of N1–Cu1–N2 = 91.1(1)°, N1–Cu1–N3 = 89.7(1)°, and N2–Cu1–N3 = 90.7(1)°.
The Cu–X bond length increases from chloride to iodide due to the increasing atomic size of the halide, for example, in the series [CuXtpypo] from Cu1–Cl1 = 2.212(1) Å to Cu1– Br1 = 2.344(1) Å to Cu1–I1 = 2.499(1) Å. The bond length of the P–O bond is about 1.48 Å and that of the P–S bond is about 1.94 Å. Thereby they are in the range of the corresponding bond lengths of triphenylphosphine oxide (P–O 1.479(2) Å) and triphenylphosphine sulfide (P–S 1.950(3) Å).92,93
Computational studies
To learn more about the tripodally coordinated copper com- plexes, quantum chemical calculations have been carried out for complexes C1–C3 and C6–C9, using density functional theory (DFT) and time-dependent density functional theory (TD-DFT) with the functional B3LYP and the basis set def2- TZVPP. It has been shown that this method gives good results for Cu(I) complexes, especially for a description of the tran- sition energies.94
We want to focus the discussion on [CuItpypo]C3. For this compound, the optimized ground state geometry and the first excited triplet state geometry were calculated. The results are displayed in Fig. 2. In the ground state, the halide is lying on the axis that is defined by the P1–Cu1 atoms (Fig. 2a).
However, in the triplet state geometry, the halide is bent away from this axis (Fig. 2b). This is clearly displayed by the three I–
Cu–N angles. In the ground state geometry, all three angles I–Cu–N are nearly equivalent to values of about 123°. In the triplet state, the angle I1–Cu1–N1, amounting to 110.3°, is sig- nificantly smaller while the two other angles, I1–Cu1–N2 amounting to 127.4° and I1–Cu1–N3 amounting to 128.3°, are slightly larger than in the ground state (compare with Table S1†). Moreover, it can be seen that in the triplet state geometry two Cu–N bonds are distinctly shortened,i.e. from the ground state value of 2.145 Å to 1.986 Å (Cu1–N2) and from 2.144 Å to 1.985 Å (Cu1–N3), respectively, while the Cu1– N1 bond length increases from 2.146 Å to 2.265 Å. This shows that two Cu–N bonds are strengthened and one Cu–N bond is weakened in the triplet state.
The occurrence of such a distortion in the excited state can be understood when the composition of the frontier orbitals is analyzed (Fig. 3). For [CuItpypo]C3, the HOMO is mainly loca- lized on the copper atom and the halide, whereas the LUMO is mainly distributed over two of the three pyridine moieties of the tripod ligand. TD-DFT calculations reveal that transitions between these frontier orbitals largely determine the first excited singlet state S1 and triplet state T1, especially in the triplet state geometry. Therefore, these states can be classified to be of (metal + halide)-to-ligand charge transfer (1,3(M + X) LCT) character. To quantify the amount of charge that is trans- ferred on excitation the natural charges for the copper and iodine atoms were calculated for the ground and the first excited triplet state. They amount to +0.321 (Cu) and−0.562 (I) Open Access Article. Published on 12 November 2014. Downloaded on 12/02/2016 09:56:11. This article is licensed under a Creative Commons Attribution 3.0 Unported Licence.
for the ground state (S0 geometry) and to +0.665 (Cu) and
−0.324 (I) for the first excited triplet state (T1geometry). This nicely confirms the occurrence of a pronounced charge trans-
fer away from the metal and halide upon excitation. Especially, the transfer of charge away from the copper center, in a rather crude approximation representing a formal oxidation of Cu(I) Table 2 Crystallographic data forC5–C9
C5 C6 C7 C8 C9
Habitus Plate Block Needle Needle Plate
Color Orange Orange Orange Yellow Yellow
Formula C20H19.50BrCuN5.50PS C47H39Cu3I3N10P3S3 C20H19.50CuIN5.50PSe C16.50H14.25AsCuIN3.75O C16H13CuIN3
Fw[g mol−1] 543.39 1504.35 637.28 546.43 437.73
Crystal size [mm] 0.200 × 0.130 × 0.050 0.310 × 0.280 × 0.180 0.440 × 0.110 × 0.040 0.280 × 0.050 × 0.040 0.490 × 0.250 × 0.100
Crystal system Monoclinic Orthorhombic Monoclinic Monoclinic Monoclinic
Space group P21/a Pc21b P21/a P21/n P21/n
a[Å] 8.5838(3) 13.2413(5) 8.7685(3) 8.7081(4) 14.7528(4)
b[Å] 15.2046(7) 15.7217(6) 15.6075(5) 29.7666(14) 13.4193(3)
c[Å] 17.8716(6) 25.7987(11) 18.0144(8) 14.5936(9) 16.0010(4)
α[°] 90 90 90 90 90
β[°] 103.386(3) 90 104.011(3) 105.559(4) 90.266(2)
γ[°] 90 90 90 90 90
Cell volume [Å3] 2269.11(15) 5370.7(4) 2392.00(16) 3644.2(3) 3167.72(14)
Z 4 4 4 8 8
Dcalc[Mg m−3] 1.591 1.860 1.770 1.992 1.836
Abs. coeff. [mm−1] 2.904 3.152 3.809 4.705 3.324
F(000) 1092 2920 1236 2100 1696
T[K] 100(2) 100(2) 100(2) 100(2) 100(2)
λ[Å] 0.71069 0.71069 0.71069 0.71069 0.71069
Reflns collected 17 036 18 930 13 242 35 607 47 871
Indep. reflns 4804 10 265 5056 35 607 6720
Obs. reflns [I> 2(I)] 3562 6869 3816 16 911 5801
Reflns used for refin. 4804 10 265 5056 35 607 6720
Abs. correction Semi-empirical Semi-empirical Semi-empirical Integration Semi-empirical
GOF 1.085 0.747 0.865 0.764 1.098
wR2 0.1196 0.0822 0.0613 0.1465 0.0745
R1[I> 2σ(I)] 0.0522 0.0376 0.0298 0.0580 0.0274
Table 1 Crystallographic data for tpyas andC1–C4
tpyas C1 C2 C3 C4
Habitus Block Needle Needle Needle Needle
Color Colourless Red Orange Red Red
Formula C15H12AsN3 C16H13.50ClCuN3.50OP C16.50H14.25BrCuN3.75OP C16.50H14.25CuIN3.75OP C18H16.50ClCuN4.50PS
Fw [g mol−1] 309.20 400.76 455.49 502.48 457.88
Crystal size [mm] 0.230 × 0.230 × 0.220 0.660 × 0.260 × 0.190 0.450 × 0.190 × 0.130 0.210 × 0.040 × 0.040 0.250 × 0.040 × 0.040
Crystal system Monoclinic Orthorhombic Monoclinic Monoclinic Orthorhombic
Space group P21/c Pbca P21/n P21/n Pccn
a[Å] 9.1529(9) 8.4558(6) 8.5684(10) 8.6959(3) 15.0776(12)
b[Å] 9.1102(6) 27.6843(13) 28.964(3) 29.6332(11) 30.280(2)
c[Å] 16.0342(16) 28.3435(16) 14.501(2) 14.5579(6) 8.6832(4)
α[°] 90 90 90 90 90
β[°] 100.982(8) 90 106.175(5) 105.894(3) 90
γ[°] 90 90 90 90 90
Cell volume [Å3] 1312.5(2) 6635.0(7) 3456.3(7) 3608.0(2) 3964.3(4)
Z 4 16 8 8 8
Dcalc[Mg m−3] 1.565 1.605 1.751 1.850 1.534
Abs. coeff. [mm−1] 2.578 1.582 3.679 3.021 1.434
F(000) 624 3248 1812 1956 1864
T[K] 100(2) 100(2) 100(2) 100(2) 100(2)
λ[Å] 0.71073 0.71069 0.71069 0.71069 0.71069
Reflns collected 8036 25 305 21 656 33 130 13 790
Indep. reflns 2763 7307 7647 7632 4187
Obs. reflns [I> 2(I)] 2318 5432 4427 4265 1823
Reflns used for refin. 2763 7307 7647 7632 4187
Abs. Correction Semi-empirical Semi-empirical Semi-empirical Analytical Semi-empirical
GOF 0.964 1.037 1.031 0.689 0.715
wR2 0.0666 0.1677 0.1068 0.0492 0.0703
R1[I> 2σ(I)] 0.0254 0.0658 0.0610 0.0300 0.0417
Open Access Article. Published on 12 November 2014. Downloaded on 12/02/2016 09:56:11. This article is licensed under a Creative Commons Attribution 3.0 Unported Licence.
Table 4 Selected bond distances [Å] and angles [°] forC6–C9
C6 C7 C8 C9
Cu1–N1 2.069(9) Cu1–N1 2.054(3) Cu1–N1 2.058(9) Cu1–N1 2.091(2)
Cu1–N2 2.068(10) Cu1–N2 2.043(3) Cu1–N2 2.063(10) Cu1–N2 2.074(2)
Cu1–N3 2.056(9) Cu1–N3 2.046(3) Cu1–N3 2.055(10) Cu1–N3 2.057(2)
Cu1–I1 2.512(1) Cu1–I1 2.486(1) Cu1–I1 2.510(2) Cu1–I1 2.465(0)
P1–S1 1.935(3) P1–Se1 2.104(1) As1–O1 1.636(8)
P1–C1 1.846(12) P1–C1 1.840(4) As1–C1 1.936(12) C16–C1 1.523(3)
P1–C6 1.816(12) P1–C6 1.843(4) As1–C6 1.935(12) C16–C6 1.524(3)
P1–C11 1.841(11) P1–C11 1.838(4) As1–C11 1.936(13) C16–C11 1.524(3)
I1–Cu1–N1 119.9(3) I1–Cu1–N1 117.8(1) I1–Cu1–N1 111.1(3) I1–Cu1–N1 117.9(1) I1–Cu1–N2 122.5(3) I1–Cu1–N2 120.0(1) I1–Cu1–N2 118.4(3) I1–Cu1–N2 126.8(1) I1–Cu1–N3 122.6(3) I1–Cu1–N3 124.2(1) I1–Cu1–N3 126.6(3) I1–Cu1–N3 129.5(1) N1–Cu1–N2 93.2(4) N1–Cu1–N2 96.4(1) N1–Cu1–N2 101.5(4) N1–Cu1–N2 91.1(1) N1–Cu1–N3 96.9(4) N1–Cu1–N3 96.2(1) N1–Cu1–N3 97.3(4) N1–Cu1–N3 89.7(1) N2–Cu1–N3 94.8(4) N2–Cu1–N3 96.3(1) N2–Cu1–N3 97.4(4) N2–Cu1–N3 90.7(1) S1–P1–C1 113.4(4) Se1–P1–C1 113.1(1) O1–As1–C1 114.1(5) H16–C16–C1 107.1 S1–P1–C6 113.9(4) Se1–P1–C6 112.9(1) O1–As1–C6 112.6(5) H16–C16–C6 107.1 S1–P1–C11 113.5(4) Se1–P1–C11 114.2(1) O1–As1–C11 114.2(5) H16–C16–C11 107.1 P1–Cu1–I1 178.4(1) P1–Cu1–I1 176.0(0) As1–Cu1–I1 170.6(1) C16–Cu1–I1 172.7(0)
Fig. 1 Molecular structures of [CuItpypo]C3, [CuItpyaso]C8, and [CuItpym]C9(thermal ellipsoids with 50% probability) resulting from X-ray ana- lyses. Hydrogen atoms (except for H16 ofC9) and solvent molecules are omitted for clarity.
Table 3 Selected bond distances [Å] and angles [°] forC1–C5
C1 C2 C3 C4 C5
Cu1–N1 2.067(3) Cu1–N1 2.072(4) Cu1–N1 2.062(3) Cu1–N1 2.078(3) Cu1–N1 2.043(4) Cu1–N2 2.047(4) Cu1–N2 2.063(5) Cu1–N2 2.060(3) Cu1–N2 2.063(3) Cu1–N2 2.052(4) Cu1–N3 2.047(3) Cu1–N3 2.049(5) Cu1–N3 2.049(4) Cu1–N3 2.027(3) Cu1–N3 2.048(4) Cu1–Cl1 2.212(1) Cu1–Br1 2.344(1) Cu1–I1 2.499(1) Cu1–Cl1 2.230(1) Cu1–Br1 2.335(1) P1–O1 1.489(3) P1–O1 1.479(4) P1–O1 1.477(3) P1–S1 1.942(2) P1–S1 1.944(2) P1–C1 1.828(4) P1–C1 1.830(6) P1–C1 1.820(4) P1–C1 1.837(4) P1–C1 1.835(5) P1–C6 1.820(4) P1–C6 1.812(6) P1–C6 1.829(4) P1–C6 1.827(4) P1–C6 1.827(5) P1–C11 1.827(4) P1–C11 1.818(6) P1–C11 1.820(5) P1–C11 1.817(4) P1–C11 1.825(5) Cl1–Cu1–N1 113.8(1) Br1–Cu1–N1 111.9(1) I1–Cu1–N1 112.6(1) Cl1–Cu1–N1 114.9(1) Br1–Cu1–N1 121.7(1) Cl1–Cu1–N2 116.8(1) Br1–Cu1–N2 118.7(1) I1–Cu1–N2 119.7(1) Cl1–Cu1–N2 117.5(1) Br1–Cu1–N2 122.6(1) Cl1–Cu1–N3 131.1(1) Br1–Cu1–N3 131.5(1) I1–Cu1–N3 129.7(1) Cl1–Cu1–N3 129.6(1) Br1–Cu1–N3 117.8(1) N1–Cu1–N2 97.3(1) N1–Cu1–N2 98.3(2) N1–Cu1–N2 98.5(1) N1–Cu1–N2 95.1(1) N1–Cu1–N2 95.8(2) N1–Cu1–N3 95.3(1) N1–Cu1–N3 95.9(2) N1–Cu1–N3 95.6(1) N1–Cu1–N3 96.7(1) N1–Cu1–N3 96.4(2) N2–Cu1–N3 96.1(1) N2–Cu1–N3 94.1(2) N2–Cu1–N3 94.5(1) N2–Cu1–N3 96.1(2) N2–Cu1–N3 96.5(2) O1–P1–C1 113.2(2) O1–P1–C1 113.8(2) O1–P1–C1 113.6(2) S1–P1–C1 113.5(2) S1–P1–C1 113.3(2) O1–P1–C6 113.4(2) O1–P1–C6 113.2(3) O1–P1–C6 112.6(2) S1–P1–C6 114.0(1) S1–P1–C6 113.8(2) O1–P1–C11 112.9(2) O1–P1–C11 113.0(3) O1–P1–C11 113.3(2) S1–P1–C11 112.5(2) S1–P1–C11 113.5(2) P1–Cu1–Cl1 168.9(0) P1–Cu1–Br1 168.1(1) P1–Cu1–I1 169.8(0) P1–Cu1–Cl1 170.5(0) P1–Cu1–Br1 176.7(0)
Open Access Article. Published on 12 November 2014. Downloaded on 12/02/2016 09:56:11. This article is licensed under a Creative Commons Attribution 3.0 Unported Licence.
to Cu(II), has an important consequence. As Cu(I) prefers a tetrahedral coordination environment, whereas Cu(II) prefers a planar one, significant structural reorganizations occur upon excitation. In the case of [CuItpypo]C3these reorganizations are mainly represented by the bending of the halide away from the Cu–P axis and by changes of the Cu–N binding distances as described above.
Interestingly, a comparison of the two tripodal copper com- plexes, K[Cu(SC6F5)(HB(3,5-iPr2pz)3)], representing a Cu(I) complex, and [Cu(SC6F5)(HB(3,5-iPr2pz)3)], representing a Cu(II) complex, supports the results that are predicted from
our calculations.95,96Compared to the Cu(I) complex, two of the three Cu–N bonds are shorter for the Cu(II) homologue (Cu(I):
Cu–N11 = 2.188(7) Å, Cu–N31 = 2.062(7) Å; Cu(II): Cu–N11 = 2.037(9) Å, Cu–N31 = 1.930(9) Å), whereas the third Cu–N bond is longer (Cu(I): Cu–N21 = 2.065(7) Å; Cu(II): Cu–N21 = 2.119(8) Å). Moreover, the bending of the thiolate away from the B–Cu axis is by about 7° larger for the Cu(II) complex than for the Cu (I) homologue (Cu(I): B–Cu–S = 174°, Cu(II): B–Cu–S = 167°).
For completeness it is remarked that similar geometry dis- tortions for the triplet state geometry were also found for all other complexes presented in this study. This is shown in Table S1† also for the two complexes [CuItpyaso] C8 and [CuItpym]C9.
In the scope of our calculations, the energy gaps between HOMO and LUMO show only slight variations between about 2.5 and 2.7 eV (data for all complexes are summarized in Table S2†). For an estimate of the transition energies, a com- parison of the HOMO–LUMO gaps is, however, not sufficient.
Instead, TD-DFT calculations have been performed.
The TD-DFT transition energies of the different com- pounds, as calculated for the optimized T1 state geometry, differ significantly from the experimental emission energies (see Table S3†). However, it is not expected that these calcu- lated gas phase data can exactly reproduce the experimental data, since (i) TD-DFT results have the tendency to underesti- mate the transition energies that correspond to charge-transfer states94,97,98 and since (ii) especially for Cu(I) complexes, the experimental emission energies depend strongly on the environment and, in particular, on its rigidity,28,31,32which is not taken into account in our calculations. Nevertheless, the calculated transition energies nicely reproduce the trend of the emission energies as determined for the Cu(I) complexes doped into amorphous PMMA ( polymethylmethacrylate) (Fig. 4). It is remarked that the experimental trend is not repro- Fig. 2 Optimized ground state (a) andfirst excited triplet state (b) geo-
metries of [CuItpypo]C3. Calculations were performed on the B3LYP/
def2-TZVPP level of theory.
Fig. 3 Contour surfaces of HOMO and LUMO for [CuItpypo]C3calcu- lated for the ground state geometry. Calculations were performed on the B3LYP/def2-TZVPP level of theory. The contour value of the MOs amounts to 0.04.
Fig. 4 Calculated T1→S0 transition wavelength versus experimentally determined emission wavelengths for different Cu(I) complexes as defined in Scheme 4. The calculated values result from TD-DFT calcu- lations performed for the optimized triplet state geometry. The experi- mental values represent the emission maxima as found for compounds doped into PMMA. The red line represents a linearfit to the data points.
The coefficient of determination for thisfit amounts toR2= 0.92.
Open Access Article. Published on 12 November 2014. Downloaded on 12/02/2016 09:56:11. This article is licensed under a Creative Commons Attribution 3.0 Unported Licence.
duced by TD-DFT calculations performed for the ground state geometry.
Furthermore, our calculations suggest that the energy sep- arations ΔE(S1–T1) between the T1 and S1 states are rather small, lying between about 1000 and 1350 cm−1 (compare Table S3†). For such small energy splittings the occurrence of a thermally activated delayed fluorescence is expected. A more detailed discussion of this aspect is presented in the next section.
Photophysical studies
Again, the discussion will focus on [CuItpypo]C3. Fig. 5 shows the absorption spectrum of this compound andof the tpypo L1ligand recorded in dichloromethane. The absorption bands observed in the range between about 230 nm and 300 nm are present in both the complex and the ligand. Therefore, they are assigned to result from ligand centered transitions. In con- trast, in the range between about 300 and 500 nm, the ligand does not absorb, but for the complex two separate absorption bands are observed. This allows us to assign these bands to charge transfer transitions in agreement with the results obtained from DFT and TD-DFT calculations that predict low- lying (M + X)LCT states.
In fluid solution, an emission of [CuItpypo] C3 is not observed at ambient temperature even after oxygen was care- fully removed by at least five freeze–pump–thaw cycles. In con- trast, when doped into a PMMA matrix, the complex exhibits a red emission with a maximum atλmax= 635 nm and an emis- sion quantum yield ofΦPL= 16%. As powder, the emission is orange with a maximum at λmax = 600 nm and a quantum yield ofΦPL= 20% (Fig. 5).
The emission of [CuItpypo] C3in PMMA compared to the neat powder is red shifted by 35 nm. This can be attributed to differences in matrix rigidity. With decreasing rigidity the
complex can undergo more distinct distortions upon (M + X) LCT excitation resulting in an energy stabilization of the emit- ting state(s). In addition to this red shift, the distortions cause an increase of non-radiative deactivations to the ground state due to increased Franck Condon factors that couple the excited state to the ground state.99,100 As a consequence, the quantum yield decreases with decreasing rigidity of the environment from 20% ( powder) to 16% (PMMA) to ≪1%
(solution).
The emission decay time and its temperature dependence show further important information. As for [CuItpypo] C3 doped into PMMA the decay strongly deviates from a mono- exponential behavior (due to distinct inhomogeneity effects),101 we focus on the emission properties of the powders.102At ambient temperature, an emission decay time of τ(300 K) = 4 µs and an emission quantum yield of ΦPL(300 K) = 20% are found for [CuItpypo] C3. When the powder sample is cooled toT= 77 K, the decay time increases to τ(77 K) = 24 µs and the emission quantum yield to ΦPL(77 K) = 63%. Calculation of the radiative and non-radiative rates according tokr=ΦPLτ−1 andknr= (1−ΦPL)τ−1, respect- ively, reveals that the radiative rate increases by a factor of about two fromkr(77 K) = 3 × 10⁴s−1tokr(300 K) = 5 × 10⁴s−1, whereas the non-radiative rate increases tenfold fromknr(77 K)
= 2 × 10⁴ s−1 to knr(300 K) = 2 × 10⁵ s−1. Furthermore, the powder sample shows a slight blue-shift of the emission maximum fromλmax(77 K) = 610 nm toλmax(300 K) = 600 nm.
An increase of the radiative rate and a blue-shift of the emission on increasing the temperature from T = 77 K to 300 K has often been reported for Cu(I) complexes and can be explained by the occurrence of a thermally activated delayed fluorescence (TADF).28–32,34,35Accordingly, at low temperature, only emission from the lowest excited triplet state T1 occurs.
With temperature increase, a thermal population of the ener- getically only slightly higher lying first excited singlet state S1
becomes possible. As the S1→S0 transition is significantly more allowed than the spin-forbidden T1→S0 transition, an effective reduction of the emission decay time results. More- over, as the S1state lies energetically higher than the T1state, a blue shift of the emission is expected to occur with increas- ing temperature.
However, for the compound [CuItpypo]C3, only a moderate increase of the radiative rate by a factor of about 2 was found to occur on heating. This is much less than what has been reported for other Cu(I) complexes. For example, the com- pounds presented in ref. 29 (Cu(I) halide dimers with different chelating aminophosphane ligands) experience a radiative rate increase by a factor of 40 to 150 and the compound discussed in ref. 36 (Cu(I) chloride dimer with a chelating diphosphane ligand) even shows a much higher factor of 490. The small radiative rate increase found for [CuItpypo]C3can be rational- ized by taking into account an additional and efficient emis- sion decay path from the triplet state to the singlet ground state. The compounds discussed in ref. 29 and 36 exhibit long triplet decay times between 250 µs and 2200 µs. In contrast, the triplet decay time of [CuItpypo]C3amounts to only 24 µs Fig. 5 Absorption spectra of the ligand tpypoL1and the corresponding
complex [CuItpypo]C3recorded in a dichloromethane solution. Emis- sion spectra are displayed for [CuItpypo]C3as a powder and doped into a PMMA matrix, respectively. All measurements were recorded under ambient conditions.
Open Access Article. Published on 12 November 2014. Downloaded on 12/02/2016 09:56:11. This article is licensed under a Creative Commons Attribution 3.0 Unported Licence.
(T= 77 K value). As a consequence, a further shortening of the emission decay time by involving the TADF mechanism at higher temperature is much less effective. Further support for this interpretation is given in ref. 37 (three-coordinate Cu(I) carbene complex) where a Cu(I) complex with a similarly short triplet decay time of 34 µs is investigated. This compound also displays only a moderate increase of the radiative rate by a factor of about 3 when the TADF process is activated.
Obviously, the only moderate increase of the radiative rate upon heating can be rationalized by a significant contribution of the triplet state emission even at ambient temperature.
Accordingly, both the singlet state S1 and the triplet state T1
contribute to the overall emission at ambient temperature.
Consequently, the expected blue-shift of the emission maximum with increasing temperature is not as clearly dis- played for the studied complexes as for TADF-only emitters (compare ref. 28–32, 34–36). However, the corresponding blue- shift is displayed on the high-energy flanks of the spectra measured atT= 77 K and 300 K, respectively (compare with Table 5).
Fig. 6 shows the emission spectra of the compoundsC1–C3 and C6–C9. The complexes [CuCltpypo] C1 and [CuBrtpypo]
C2exhibit the same trends in the emission behavior as those described for [CuItpypo]C3. For all the other investigated com- pounds corresponding trends are expected to occur. An over- view of the respective emission parameters is given in Table 5.
The complexes [CuCltpyps]C4and [CuBrtpyps]C5exhibit very similar emission properties to complexes [CuCltpypo]C1and [CuBrtpypo]C2, respectively. Therefore, these are not explicitly discussed here.
An analysis of the radiative and non-radiative rates for the studied series of complexes reveals an interesting trend. At ambient temperature, powders of all compounds show similar radiative rateskrranging from 3 × 10⁴to 6 × 10⁴s−1. In con- trast, the non-radiative rates knr increase drastically with increasing emission wavelength. Such a trend is not unex- pected and can be described by the energy gap law. In its sim- plest form it can be written as103
knrexp½γΔE=ðħωnÞ ð1Þ
wherein ΔE represents the energy separation between the states involved in the transition,γa molecular coupling para- meter,ħthe Planck constant, andωnthe dominant vibrational frequency that induces the non-radiative process. Accordingly, an exponential dependence of the non-radiative rateknron the emission energyΔEis expected to occur. Indeed, this is experi- mentally observed. A graphical representation of this corre- lation is given in Fig. 7. These results demonstrate that the realization of compounds showing efficient red light emission remains a challenging task.
Table 5 Emission properties of compounds C1–C3 and C6–C9 as powders atT= 77 K and 300 K.λmaxrepresents the wavelength at the maximum of the emission spectrum andλ50%the wavelength at 50% of the maximum at the high energyflank of the spectrum
Temp.
[K] λmax
[nm] λ50%
[nm] τ [µs] ΦPL
[%]
kr
[104s−1] knr
[104s−1]
[CuCltpypo]C1 300 645 595 3 8 3 30
77 645 610 13 14 1 7
[CuBrtpypo]C2 300 620 575 4 18 5 20
77 620 585 20 36 2 3
[CuItpypo]C3 300 600 550 4 20 5 20
77 610 555 24 63 3 2
[CuItpyps]C6 300 595 555 8 34 4 8
77 595 565 24
[CuItpypse]C7 300 640 595 2 4 2 50
77 675 630 9
[CuItpyaso]C8 300 600 550 4 12 3 20
77 610 565 23
[CuItpym]C9 300 550 510 5 28 6 10
77 550 530 22
Fig. 6 Emission spectra of the investigated complexes as powders at ambient temperature. The samples were excited atλexc= 350 nm.
Fig. 7 Radiativekrand non-radiative ratesknrof the investigated com- poundsversusemission energy. Data are given for the powders of the complexes at ambient temperature. The curves are displayed as a guide for the eye.
Open Access Article. Published on 12 November 2014. Downloaded on 12/02/2016 09:56:11. This article is licensed under a Creative Commons Attribution 3.0 Unported Licence.
Conclusion and outlook
Emitter materials that exhibit a thermally activated delayed fluorescence (TADF) or a phosphorescence are highly attractive for use in OLEDs as they can convert all injected excitons into light. For applications, the emitter should also exhibit a short (radiative) decay time to minimize saturation effects.104 The complexes investigated in this study are interesting in this regard; when compared to other Cu(I) complexes they exhibit relatively short phosphorescence (T1→S0 emission) decay times, for example, amounting to only about 24 µs (radiative decay time 38 µs) in the case of [CuItpypo]C3. Thus, it can be concluded that spin–orbit coupling is particularly effective when compared to other Cu(I) complexes for which triplet decay times of several hundred microseconds or longer are not unusual.29,32,36 Besides this already effective radiative de- activation processviaphosphorescence, an additional radiative TADF path becomes important at ambient temperature for the investigated compounds. The combined emission paths of phosphorescence and TADF result in a distinct increase of the overall radiative rate when compared to TADF-only emitters.
This property is highly attractive when the compounds are applied as emitters in OLEDs, in particular, to reduce satur- ation effects.
Another interesting observation was made for the investi- gated compounds. In this series, the non-radiative rate increases strongly with decreasing emission energy following the energy gap law. As a consequence, the emission quantum yields decrease towards the red range of the spectrum from 28% for [CuItpym]C3to 4% for [CuItpypse] C7. Accordingly, shifting the emission to the blue using methods of chemical engineering will result in a significant reduction of the non- radiative rates and will therefore lead to an increase of the emission quantum yield. An extrapolation of the data pre- sented to shorter wavelengths reveals that for an emission wavelength of 460 nm, an emission quantum yield greater than 70% would be expected.
Experimental
General remarks
The syntheses and handling of air- and moisture-sensitive sub- stances were carried out using standard Schlenk and glovebox techniques. Solvents were dried using standard procedures105 and stored over Al2O3/molecular sieves 3 Å/R3-11G catalyst (BASF).
The starting materials were obtained from commercial sources (Sigma-Aldrich, Merck, Acros Organics, Alfa Aesar) and used as received. The following materials were prepared according to literature procedures: tris(2-pyridyl)phos- phine82,83(tpyp), tris(2-pyridyl)methane91(tpym)L5, copper(I) chloride106, and copper(I) iodide.107
NMR spectra were recorded at 300 K on a Bruker DPX 250, Bruker ARX 300, Bruker DRX 400, Bruker ARX 500, or Bruker DRX 500 using CDCl3 or DMSO-d6 as the solvent. Chemical
shifts are given with respect to tetramethylsilane (1H,13C) and phosphoric acid (31P). Calibration of 1H and13C NMR spectra was accomplished with the solvent signals, and 31P spectra were calibrated externally.
The numbering of the hydrogen and carbon atoms is shown for the three ligands tpyp, tpyas, and tpym in Fig. 8.
Electrospray ionization (ESI) mass spectra were recorded on a Thermo Fisher Scientific LTQ FT Ultra using methanol, acetonitrile, or dichloromethane as the solvent. IR spectra were recorded on a Bruker Alpha FT-IR spectrometer using powder samples at ambient temperature. Elemental analysis was done using an Elementar vario MICRO cube. UV-Vis absorption measurements were carried out using a Varian Cary 300 double beam spectrometer. Emission spectra were recorded with a Fluorolog 3-22 (Horiba Jobin Yvon) spectrophotometer which was equipped with a cooled photo-multiplier (RCA C7164R). For the decay time measurements, the same photo- multiplier was used in combination with a FAST ComTec multichannel scaler PCI card with a time resolution of 250 ps.
As the excitation source for the decay time measurements, a pulsed diode laser (Picobrite PB-375L) with an excitation wave- length ofλexc= 378 nm and a pulse width <100 ps was used.
For absolute measurements of photoluminescence quantum yields at ambient temperature and at 77 K, a Hamamatsu Photonics (C9920-02) system was applied. Doping of poly- methylmethacrylate (PMMA) films was performed by dissol- ving the respective complex (<1 wt%) and the polymer in dichloromethane. After this, the solution was spin-coated onto a quartz-glass plate. All calculations were carried out with Gaussian09.108As the functional, B3LYP was used and as the basis set, def2-TZVPP was used. As the starting geometry, the structures obtained from X-ray measurements were used. No symmetry constraints were applied.
The data collection for the single crystal structure determi- nations was performed on a Stoe IPDS-II or IIT or a Bruker D8 QUEST diffractometer by the X-ray service department of the Fachbereich Chemie, University of Marburg. The Stoe IPDS-II and IIT devices are equipped with a Mo-Kα X-ray source (λ = 0.71073 Å), a graphite mono-chromator and an active imaging plate. Stoe IPDS software (X-AREA) was used for data collec- tion, cell refinement and data reduction, respectively.109 The D8-QUEST is equipped with a Mo-Kα X-ray micro source (Incotec), a fixed chi goniometer and a PHOTON 100 CMOS detector. Bruker software (Bruker Instrument Service, APEX2, SAINT) was used for data collection, cell refinement and data reduction.110 The structures were solved with SIR-97111 or Fig. 8 Example of the numbering of compounds.
Open Access Article. Published on 12 November 2014. Downloaded on 12/02/2016 09:56:11. This article is licensed under a Creative Commons Attribution 3.0 Unported Licence.
![Fig. 1 Molecular structures of [CuItpypo] C3, [CuItpyaso] C8, and [CuItpym] C9 (thermal ellipsoids with 50% probability) resulting from X-ray ana- ana-lyses](https://thumb-eu.123doks.com/thumbv2/1library_info/5574820.1690098/5.892.62.834.468.761/molecular-structures-cuitpypo-cuitpyaso-cuitpym-ellipsoids-probability-resulting.webp)
![Fig. 3 Contour surfaces of HOMO and LUMO for [CuItpypo] C3 calcu- calcu-lated for the ground state geometry](https://thumb-eu.123doks.com/thumbv2/1library_info/5574820.1690098/6.892.84.416.76.535/contour-surfaces-homo-lumo-cuitpypo-calcu-ground-geometry.webp)
![Fig. 6 shows the emission spectra of the compounds C1 – C3 and C6 – C9. The complexes [CuCltpypo] C1 and [CuBrtpypo]](https://thumb-eu.123doks.com/thumbv2/1library_info/5574820.1690098/8.892.462.819.71.421/fig-shows-emission-spectra-compounds-complexes-cucltpypo-cubrtpypo.webp)
