Transactions
PAPER
Cite this:Dalton Trans., 2017,46, 16077
Received 23rd August 2017, Accepted 26th October 2017 DOI: 10.1039/c7dt03126b rsc.li/dalton
Phosphorescent heterobimetallic complexes involving platinum( IV ) and rhenium( VII ) centers connected by an unsupported μ -oxido bridge †
Hajar Molaee,a,bS. Masoud Nabavizadeh, *aMahboubeh Jamshidi, a Max Vilsmeier,cArno Pfitzner cand Mozhgan Samandar Sangaria
Heterobimetallic compounds [(C^N)LMe2Pt(μ-O)ReO3] (C^N = ppy, L = PPh3,2a; C^N = ppy, L = PMePh2, 2b; C^N = bhq, L = PPh3,2c; C^N = bhq, L = PMePh2,2d) containing a discrete unsupported Pt(IV)–O– Re(VII) bridge have been synthesized through a targeted synthesis route. The compounds have been pre- pared by a single-pot synthesis in which the Pt(IV) precursor [PtMe2I(C^N)L] complexes are allowed to react easily with AgReO4 in which the iodide ligand of the starting Pt(IV) complex is replaced by an ReO4−anion. In these Pt–O–Re complexes, the Pt(IV) centers have an octahedral geometry, completed by a cyclometalated bidentate ligand (C^N), two methyl groups and a phosphine ligand, while the Re(VII) centers have a tetrahedral geometry. Elemental analysis, single crystal X-ray diffraction analysis and mul- tinuclear NMR spectroscopy are used to establish their identities. The new complexes exhibit phosphor- escence emission in the solid and solution states at 298 and 77 K, which is an uncommon property of platinum complexes with an oxidation state of +4. According to DFT calculations, we found that this emission behavior in the new complexes originates from ligand centered 3LC (C^N) character with a slight amount of metal to ligand charge transfer (3MLCT). The solid-state emission data of the corres- ponding cycloplatinated(IV) precursor complexes [PtMe2I(C^N)L],1a–1d, pointed out that the replace- ment of I− by an ReO4− anion helps enhancing the emission efficiency besides shifting the emission wavelengths.
1. Introduction
The chemistry of small molecules and clusters involving het- erobimetallic M–O–M′ frameworks is of special interest in recent years due to their different applications in many com- mercially important systems.1–6 Heterobimetallic systems including μ-oxo-bridge complexes have often been used by nature to catalyze significant reactions in biology.7,8 These complexes are also used as soluble molecular analogues for molecular catalysts immobilized on metal oxide supports.9,10 The interesting properties of heterobimetallic complexes arise from the possible “synergistic” effect of two different metal ions held together in close proximity. The metal centers can
be placed in close proximity by using an oxygen bridge, which allows a more distinct chemical communication between the two metal centers. These observations encourage chemists to synthesize heterobimetallic compounds involving two different metal centers connected by an unsupported oxido bridge, the idea being that such a system will be more efficient than the one involving the individual metal centers for various funda- mental reactions.11–14 The synthesis of advanced multifunc- tional materials can also be envisaged through the combi- nation of metal centers with catalytic and optical properties.
One of the best and more successful methods for the prepa- ration of μ-oxo-bridge mixed-metal complexes is using the metal oxyanions such as CrO42−, MoO42−and ReO4−as ligands for metal cations. A search in the literature showed that there are many complexes containing ReO4− coordinated to tran- sition metal centers.5,12,15 The use of platinum remains sur- prisingly underexplored. Very recently, we reported an oxo- bridge Pt–O–Re system obtained from the oxidative addition of methyltrioxorhenium to the [PtMe2bpy] (bpy = 2,2′-bipyridine) complex.16
Lots of photophysical studies have been performed on the complexes of d6, such as Ru(II),17Os(II)18and Ir(III)19and d8
†Electronic supplementary information (ESI) available. CCDC 1545899. For ESI and crystallographic data in CIF or other electronic format see DOI: 10.1039/
c7dt03126b
aDepartment of Chemistry, College of Sciences, Shiraz University, Shiraz, 71467- 13565, Iran. E-mail: nabavizadeh@shirazu.ac.ir
bDepartment of Chemistry, University of Isfahan, Isfahan 81746-73441, Iran
cInstitut für Anorganische Chemie, Universität Regensburg, 93040 Regensburg, Germany
Published on 26 October 2017. Downloaded by Universitaetsbibliothek Regensburg on 12/7/2018 10:37:14 AM.
View Article Online
View Journal | View Issue
such as Pt(II)20–22ions, but the excited-state properties of Pt(IV) complexes have been scarcely studied.23–28 The first Pt(IV) organometallic emitters were published in 1986 by Balzani et al. These neutral bis-cyclometalated platinum complexes have the type [Pt(C^N)2(R)Cl] [C^N = cyclometalated 2-phenyl- pyridinate ( ppy) or 2-thienylpyridinate (thpy); R = CH2Cl, CHCl2], which emit from the lowest triplet ligand centered excited state.23 Bis-cyclometalated platinum(IV) complexes of the type [Pt(C^N)2(N^N)](PF6)2 (N^N = aromatic diimine),24 having at least two cyclometalated rings in their structures and mono cyclometalated Pt(IV) emitters in [Pt(C^N)L2MeI] [C^N = cyclometalated 3-perylenylmethylen-4′-ethylaniline]25 are the examples of emissive Pt(IV) complexes.
Herein, we report the synthesis of four luminescent hetero- bimetallic compounds with the general formula [(C^N)LMe2Pt (μ-O)ReO3] (C^N = ppy, L = PPh3,2a; C^N = ppy, L = PMePh2, 2b; C^N = bhq (benzo[h]quinolate), L = PPh3,2c; C^N = bhq, L = PMePh2, 2d), with a hitherto unknown unsymmetrical combination involving a cycloplatinated(IV) and a rhenium(VII) center, connected together by a soleμ-oxido bridge. Thus, the treatment of cycloplatinated(IV) complexes with AgReO4led to the isolation of compounds involving Pt(IV)–O–Re(VII) units, which are the first example of an organo cyclometalated plati- num(IV) complex coordinated to perrhenate. One of these com- pounds, 2d, has been structurally characterized by single crystal X-ray diffraction analysis. Their photophysical behavior has also been explored in detail. As far as we know, the Pt(IV) complexes discussed in this paper constitute the first examples of luminescent heterobimetallic Pt(IV) complexes.
2. Experimental section
2.1. Materials and methods
The1H,13C and31P NMR spectra were recorded on a Bruker Avance DRX 400 MHz spectrometer. The chemical shifts and coupling constants are in ppm and Hz, respectively. AgReO4
was commercially available and the precursor compounds [PtMe2I(C^N)L], 1a–d, (C^N = ppy or bhq and L = PPh3 or PMePh2) were prepared according to reported procedures.29 Microanalyses for CHN were performed using a Thermo Finnigan Flash EA-1112 CHNSO rapid elemental analyzer. The UV-vis absorption spectra were recorded on a PerkinElmer Lambda 25 spectrophotometer using a cuvette with a path length of 1 cm and/or 1 mm. Excitation and emission spectra were obtained on a PerkinElmer LS45 fluorescence spectro- meter with the lifetimes measured in phosphorimeter mode.
Absolute measurements of the photoluminescence quantum yield at ambient temperature were performed using a C9920- 02 (Hamamatsu Photonics) system equipped with a Spectralon® integrating sphere.
2.2. Synthesis of complexes
[( ppy)(PPh3)Me2Pt(μ-O)ReO3], 2a. AgReO4 (116 mg, 0.32 mmol) was added to a solution of [PtMe2I( ppy)(PPh3)]
(0.050 g, 0.065 mmol) in CHCl3(20 mL). The reaction mixture
was stirred for 1 h at room temperature. Then the reaction mixture was filtered and the solvent was evaporated to give a precipitate. Furthermore, it was washed with pentane (10 mL) and dried under vacuum. The white powder product was obtained. Yield 75%. M.p. 151 °C (decomp.). Anal. calc. for C31H29NO4PPtRe, C, 41.57; H, 3.28; N, 1.57%; found, C, 41.32;
H, 3.24; N, 2.02%.1H NMR in CDCl3:δ0.90 (d,2JPtH= 55.6 Hz,
3JPH= 8.1 Hz, 3H, Metransto P), 1.38 (d,2JPtH= 65.8 Hz,3JPH= 8.2 Hz, 3H, Metransto N), 7.01 (3JPtH= 24.0 Hz,3JHH= 8.2 Hz, 1H, the CH group adjacent to the ligating C atom of ppy), 8.42 (3JPtH= 8.6 Hz,3JHH= 4.8 Hz, 1H, the CH group adjacent to the ligating N atom of ppy). 13C NMR in CDCl3: 0.07 (d, 1JPtC = 659.2,2JPC= 3.8 Hz, the 1C atom of the Me ligandtransto the ligating N atom), 14.65 (d,1JPtC= 512.5 Hz,2JPC= 102.2 Hz, 1C atoms of the Me ligand trans to the ligating P atom), 119.64–159.48 (29C aromatics).31P NMR in CDCl3: 7.9 ppm (s,
1JPtP= 1004 Hz).
[(bhq)(PMePh2)Me2Pt(μ-O)ReO3], 2d. AgReO4 (122 mg, 0.34 mmol) was added to a solution of [PtMe2I(bhq)(PPh3)]
(0.050 g, 0.068 mmol) in CHCl3(20 mL). The reaction mixture was stirred for 2 h at room temperature. Then the reaction mixture was filtered and the solvent was evaporated to give a bright yellowish precipitate. Furthermore, it was washed with n-hexane (10 mL) and dried under vacuum. Yield 90%. M.
p. 144 °C (decomp.). Anal. calc. for C28H27NO4PPtRe, C, 39.39;
H, 3.19; N, 1.64%; found, C, 38.86; H, 3.32; N, 1.60%.1H NMR in CDCl3:δ0.72 (d,2JPtH= 53.7 Hz,3JPH= 7.6 Hz, 3H, Metrans to P), 1.31 (d,2JPtH = 66.1 Hz, 3JPH= 8.3, 3H, the Me ligand transto N), 1.57 (d,3JPtH= 14.2,2JPH= 9.2 Hz, 3H, Me of the PMePh2 ligand), 7.1 (d, 3JPtH = 18.8 Hz, 3JHH = 6.5, 1H, CH group adjacent to the ligating C atom of bhq), 7.1 (d,3JPtH= 8.9 Hz, 3JHH= 4.8 Hz, 1H, CH group adjacent to the ligating N atom of bhq).13C NMR in CDCl3: 0.97 (d,1JPtC= 654.8 Hz,
2JPC= 4.0 Hz, the 1C atom of the Me ligandtransto the ligating N atom), 9.00 (d,2JPtC= 18.4 Hz,1JPC= 28.6 Hz, 1C atoms of Me of PMePh2ligandstransto the ligating P atom), 13.73 (d,1JPtC= 504.4 Hz,2JPC= 107.5 Hz, the 1C atom of the Me ligandtransto the ligating P atom), 119.67 (s,2JPtC= 15.4 Hz), 159.19 (2JPtC= 61.4 Hz).31P NMR in CDCl3:−6.93 (s,1JPtP= 1079 Hz, 1P).
Complexes 2b and 2c were prepared in an analogous manner to complexes2aand2d, respectively, using the appro- priate Pt complex.
[( ppy)(PMePh2)Me2Pt(μ-O)ReO3], 2b. Yield: 65%, M.p. 123 °C. Anal. calc. for C26H27NO4PPtRe, C, 37.63; H, 3.28;
N, 1.69%; found, C, 37.12; H, 3.42; N, 1.64%. 1H NMR in CDCl3:δ0.81 (d,2JPtH= 54.6 Hz,3JPH= 7.51 Hz, 3H, the Me ligandtransto the ligating P atom), 1.31 (d, 2JPtH = 65.5 Hz,
3JPH= 8.9 Hz, 3H, the Me ligandtransto the ligating N atom), 1.60 (d,2JPH= 8.7 Hz,3JPtH= 14.3 Hz, 3H, Me of PMePh2), 7.11 (d,3JPtH= 23.7 Hz,3JHH= 2.5 Hz, the CH group adjacent to the ligating C atom, 1H), 8.30 (d,3JPtH= 8.8 Hz,3JHH= 4.9 Hz, the CH group adjacent to the ligating N atom, 1H). 13C NMR in CDCl3:−1.0 (d,1JPtC= 654.5 Hz,2JPC= 3.9 Hz, the 1C atom of the Me ligand transto the ligating N atom), 8.32 (d, 2JPtC = 18.24 Hz,1JPC= 28.9 Hz, 1C atoms of Me of PMePh2ligands), 13.7 (d,1JPtC= 502.59 Hz,2JPC= 108.61 Hz, the 1C atom of the
Published on 26 October 2017. Downloaded by Universitaetsbibliothek Regensburg on 12/7/2018 10:37:14 AM.
Me ligand trans to the ligating P atom), 120–160 (23 CAr).
31P NMR in CDCl3:−7.0 (s,1JPtP= 1077 Hz, 1P).
[(bhq)(PPh3)Me2Pt(μ-O)ReO3], 2c. Yield: 76%, M.p. = 175 °C (decomp.). Anal. calc. for C33H29NO4PPtRe, C, 43.28; H, 3.19; N, 1.53%; found, C, 42.84; H, 2.93; N, 1.44%.1H NMR in CDCl3: δ0.94 (d,2JPtH= 55.1 Hz,3JPH= 7.5 Hz, 3H, the Me ligandtrans to the ligating P atom), 1.60 (d,2JPtH= 67.6 Hz,3JPtH= 7.5 Hz, 3H, the Me ligandtransto the ligating N atom), 7.12 (d,3JPtH= 15.5 Hz, 3JHH = 1.7, the CH group adjacent to the ligating C atom), 7.71 (d,3JPtH= 8.7 Hz,3JHH= 4.8 Hz, the CH group adja- cent to the ligating N atom).13C NMR in CDCl3:−0.27 (d,1JPtC= 653.0 Hz,2JPC= 3.5 Hz, the 1C atom of the Me ligandtransto the ligating N atom), 14.3 (d,1JPtC= 507.7 Hz,2JPC= 102.2 Hz, 1C atoms of the Me ligandtransto the ligating P atom), 122–148 (31 CAr).31P NMR in CDCl3: 8.0 (s,1JPtP= 1022 Hz, 1P).
2.3. Computational details
Gaussian 0330was used to fully optimize all the structures at the B3LYP level of density functional theory. The solvation energies were calculated by using the CPCM model in dichloromethane.
The effective core potential of Hay and Wadt with a double-ξ valence basis set (LANL2DZ) was chosen to describe Pt, I and Re.31,32The 6-31G(d) basis set was used for other atoms.
2.4. Crystallography
Clear yellowish to colorless block-shaped crystals of the complex [(bhq)(PMePh2)Me2Pt(μ-O)ReO3], 2d, suitable for
X-ray crystallography, were grown from a concentrated acetone solution by the slow diffusion of n-hexane. The X-ray data of 2d were collected at T = 123.0(1) K. The data were obtained using theωscans of 1.0° per frame for 2.5 s using CuKαradi- ation. The total number of runs and images was based on the strategy calculation from the program CrysAlisPro.28 The maximum resolution achieved was Θ = 67.080°. Cell para- meters were retrieved using the CrysAlisPro software and refined using CrysAlisPro on 38 635 reflections. Data reduction was performed using the CrysAlisPro software that corrects for Lorentz and polarization effects. The absorption coefficient µ of this material is 19.413 mm−1 at this wavelength (λ = 1.54184 Å) and the minimum and maximum transmissions are 0.284 and 0.470. The structure was solved in the space groupP21/c by intrinsic phasing using the ShelXT33structure solution program and refined by least squares using version 2014/7 of ShelXL. All non-hydrogen atoms were refined aniso- tropically. Hydrogen atom positions were calculated geometri- cally and refined using the riding model. Crystal data, together with other relevant information on structure determination, are listed in Table 1. CCDC 1545899†contains the supplemen- tary crystallographic data.
3. Results and discussion
3.1. Characterization of the complexes
The compounds reported in this work (2a–d) were synthesized as outlined in Scheme 1.
As described in our previous paper,29the precursors cyclo- platinated(IV) complexes [PtMe2I(C^N)L], 1a–d, (C^N = ppy or bhq and L = PPh3or PMePh2) show high stability towards air and moisture in the solid state and in solution for several weeks at ambient temperature. In the presence of AgReO4, the iodide ligand is replaced very easily and cleaned with the added ReO4−anion to form the heterobinuclear Pt(IV)–O–Re(VII) products. The perrhenate group is included in the coordi- nation sphere of platinum(IV),transto the C atom of the cyclo- metalated ligand C^N.
In the 1H NMR spectrum, as shown in Fig. 1, complex2c gave two methyl platinum resonances in a 1 : 1 ratio, each of which appeared as a doublet, accompanying with the platinum satellites. The first signal atδ= 0.94 with2JPtH= 55.0 Hz and
3JPH= 7.2 Hz was assigned to the Me ligandtransto the P atom of PPh3, while the second signal atδ= 1.59 that has a higher value of2JPtHequal to 67.6 Hz (typical of the value for MePt(IV) groups trans to nitrogen)34–36 was attributed to the methyl ligandtransto nitrogen. The2JPtHvalue for the Me ligandtrans to the N atom of bhq is larger than that observed for the Me ligandtransto the P atom of PPh3which is due to the lower transinfluence of a N atom as compared to P. It becomes clear from Fig. 1 that the methyl protons of the starting Pt(IV) complex 1c are shifted upfield about 0.25 ppm upon coordi- nation to perrhenate to form the heterobinuclear complex2c (δ= 1.23 and 1.83 ppm for complex 1cand 0.94 and 1.59 for complex2c, respectively). In the31P NMR spectrum of complex Table 1 Crystal data and structure refinement of complex2d
Formula C28H27NO4PPtRe
Dcalc./g cm−3 2.143
µ/mm−1 19.413
Formula weight/g mol−1 853.76
Color Clear yellowish to colorless
Shape Block
Size/mm3 0.09 × 0.08 × 0.07
T/K 123.0(1)
Crystal system Monoclinic
Space group P21/c
a/Å 18.6078(2)
b/Å 18.5904(2)
c/Å 15.4791(2)
β/° 98.806(1)
V/Å3 5291.5(1)
Z 8
Wavelength/Å 1.54184
Radiation type CuKα
Θmin/° 3.381
Θmax/° 67.080
Measured refl. 59 733
Independent refl. 9445
Reflections withI> 2σ(I) 9004
Rint,Rσ 0.0168, 0.0306
Parameters 655
Restraints 0
Largest peak/e Å−3 0.483
Deepest hole/e Å−3 −0.782
GooF 1.079
wR2(all data) 0.0404
wR2 0.0397
R1(all data) 0.0192
R1 0.0175
Published on 26 October 2017. Downloaded by Universitaetsbibliothek Regensburg on 12/7/2018 10:37:14 AM.
2c, as expected, a singlet atδ= 8.0 having195Pt satellites with
1JPtP= 1022 Hz was observed, which is shifted as compared to that observed for complex1c(δ=−9.0 with1JPtP= 970 Hz).
3.2. Structure description of complex 2d
Clear yellowish to colorless block-shaped crystals of 2d were obtained from its acetone solution with the slow layer diffusion of n-hexane. It crystallizes in the monoclinic crystal system in the space group P21/c. Two crystallographically different but chemically identical complexes are located in the unit cell. The molecular structures and atom-numbering scheme of2d, as well as, selected bond distances and bond angles, are presented in Fig. 2. The crystallographic data and structure analysis of complex2dare summarized in Table 1.
As expected, the bhq ligand in complex2dbinds to the PtIV metal centerviaone N and one C atom. Two Me ligands take cispositions. The perrhenate ion (ReO4−) and the bulky phos- phine ligand occupy positions in the equatorial plane (transto the ligating C atom of bhq) and the axial positions, respect- ively. The angles around the Pt center deviate significantly
from 90°,i.e.the (bhq) bite angles, C25–Pt1–N1 and C54–Pt2– N2 are reduced to 81.66(12)° and 81.86(11)°, respectively, implying that the chelate is probably under strain, whereas the angles formed by the Me ligandstransto N with the O atom of ReO4, i.e. O1–Pt1–C2 and O5–Pt2–C30, are increased to 91.86(14)° and 92.90(11)°, respectively.
Different trans influences implemented by the PMePh2
ligand and the ligating N atom of bhq are reflected by the bond lengths of thetransPt–Me bonds. For example, due to the largertransinfluence of a ligating P atom relative to a ligat- ing N atom, the distance of the Pt1–C1 bond trans to the PMePh2ligand (2.081(3) Å) is longer than the distance of the Pt1–C2 bondtransto the ligating N atom of bhq (2.058(3) Å).
These results are in agreement with the1JPtCvalues in the13C NMR spectrum (504.45 and 654.79 Hz for Ctransto P and C transto N, respectively).
3.3. Structures according to DFT calculations
The structures of complexes2a–2din the gas phase were opti- mized in S0 geometry by using DFT calculations (see Fig. S1, Scheme 1 Schematic presentation for the preparation of complexes1a–dand2a–d.
Fig. 1 1H (Me region, A and B) and31P (C and D) NMR spectra of complexes2c(A and C) and1c(B and D).
Published on 26 October 2017. Downloaded by Universitaetsbibliothek Regensburg on 12/7/2018 10:37:14 AM.
see the ESI†for atomic coordinates and energies of optimized geometries). Selected calculated bond lengths and angles as well as the crystal structure of complex 2d are given in Table S1.†As is clear from the table, the data of complex2din ground state geometry are in good agreement with the experi- mental values obtained from single crystal structure determi- nation. Therefore, considering the large molecules under con- sideration, the B3LYP/LANL2DZ/6-31G(d) method/basis set appears to be a good choice and we used it for the structural characterization of the new heterobinuclear complexes. While the observed Pt–P distance is shorter than that obtained from the calculation, the corresponding Pt–C distances are very close. The differences found in bond distances may indicate the influence of the crystal packing on the experimental bond lengths or may come from the basis sets, which are approxi- mated to a certain extent.37
The data reported in Table S1† show again that thetrans influence of the P atom of PPh3 is higher than that of the metalated N of bhq. For example for complex2d, Pt–C bond lengthstransto the P ligating atom of the PPh3 ligand (Pt1–
C(transto P)= 2.094 Å) are considerably longer than those of Pt–
C bondstransto the N ligating atom of bhq (Pt1–C(transto N)= 2.077 Å).
In order to investigate the emission properties, the opti- mized structures of T1 geometries were calculated for com- plexes2a–2d. Selected calculated bond lengths and angles of the complexes are given in Table S1.†The deviations of bond lengths compared to the ground state geometry are not so observable, although there are some slight differences in angles. Calculated phosphorescence wavelengths for com- plexes 1a–1d and 2a–2d in the solid phase are reported in
Table 3, which are calculated using the energy differences of two states (S0 and T1) in their respective minimum geome- tries.38 The trends are in good agreement with the experi- mental data.
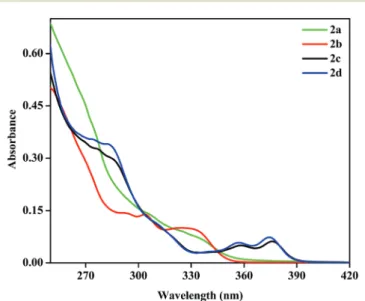
3.4. Photophysical properties and TD-DFT calculations 3.4.1. Absorption spectra. The UV–vis absorption spectra of complexes2a–2din dichloromethane at room temperature are shown in Fig. 3 and the resulting photophysical data are reported in Tables 2 and 3.
Fig. 2 ORTEP drawing of the two independent molecules of complex2dwith an atom-numbering scheme. Selected bond lengths (Å) and angles (°): Pt1–P1 2.4020(7), Pt1–O1 2.167(2), Pt1–N1 2.142(2), Pt1–C25 2.000(3), Pt1–C1 2.081(3), Pt1–C2 2.058(3), Pt2–P2 2.3985(7), Pt2–N2 2.144(2), Pt2–O5 2.181(2), Pt2–C54 1.994(3), Pt2–C30 2.063(3), and Pt2–C29 2.093(3); N1–Pt1–C25 81.66(12), N1–Pt1–O1 92.73(10), C25–Pt1–C2 93.76(16), C1–Pt1–O1 89.60(12), O1–Pt1–C2 91.86(14), P1–Pt1–O1 85.59(6), O1–Pt1–C25 174.30(12), N2–Pt2–C54 81.86(11), N2–Pt2–O5 91.05(9), C30–Pt2– C54 94.12(13), C29–Pt2–O5 90.41(11), O5–Pt2–C30 92.90(11), O5–Pt2–C54 172.90(11), and P2–Pt2–O5 89.98(6).
Fig. 3 Absorption spectra of complexes 2a–2d in dichloromethane solution (3 × 10⁻⁵M) at room temperature.
Published on 26 October 2017. Downloaded by Universitaetsbibliothek Regensburg on 12/7/2018 10:37:14 AM.
The absorption spectra (Fig. 3) of these compounds display structured bands in the 250–400 nm region, which are similar in shape and energy to those found for the other reported cyclometalated Pt(IV) complexes.24,27 The relatively intense electronic transitions at higher energies (below 300 nm) are normally assigned to ligand centered metal per- turbed (1LC, π→ π*) transitions within the C^N ( ppy, bhq) and aryl group of the phosphine ligands.39,40The absorption bands with a lower intensity observed atλ> 320 nm, presum- ably having a mixed contribution, as supported by TD-DFT
calculations, are attributed to a mixture of spin-allowed1LC, L′LCT and 1MLCT transitions. Based on the absorption spectra, it seems that the nature of the P ligand (PPh3 and PMePh2) is less important than the nature of the C^N ligands.
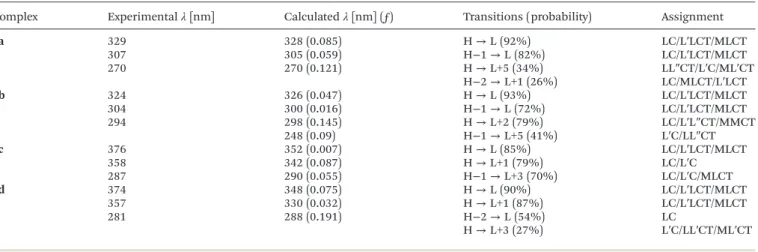
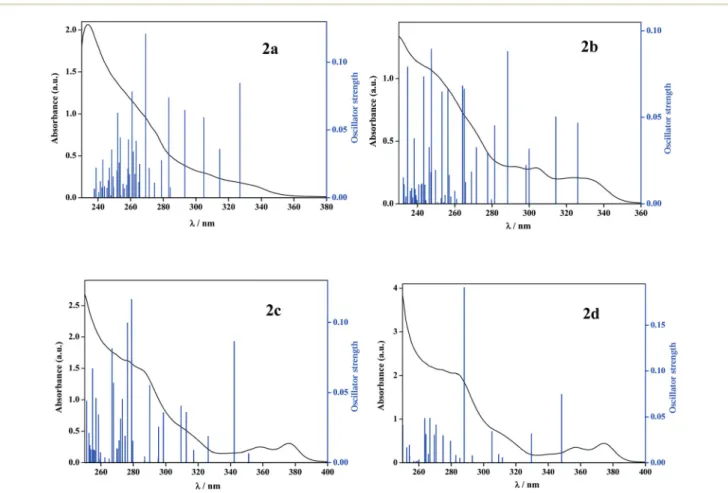
To gain further insight into the absorption transitions of complexes 2a–2d in dichloromethane, TD-DFT calculations were performed in the optimized ground state geometry (see Fig. 4) and the resulting data and the corresponding wave- lengths for the singlet transitions are given in Table 2. The Table 2 Selected vertical singlet excitation of complexes2a–2dfrom TD-DFT calculations in the ground state geometry in CH2Cl2solution, where M = Pt, L = C^N, L’= phosphine and L’’= ReO4(only transitions with a probability higher than 20% are reported)
Complex Experimentalλ[nm] Calculatedλ[nm] (ƒ) Transitions (probability) Assignment
2a 329 328 (0.085) H→L (92%) LC/L′LCT/MLCT
307 305 (0.059) H−1→L (82%) LC/L′LCT/MLCT
270 270 (0.121) H→L+5 (34%) LL″CT/L′C/ML′CT
H−2→L+1 (26%) LC/MLCT/L′LCT
2b 324 326 (0.047) H→L (93%) LC/L′LCT/MLCT
304 300 (0.016) H−1→L (72%) LC/L′LCT/MLCT
294 298 (0.145) H→L+2 (79%) LC/L′L″CT/MMCT
248 (0.09) H−1→L+5 (41%) L′C/LL″CT
2c 376 352 (0.007) H→L (85%) LC/L′LCT/MLCT
358 342 (0.087) H→L+1 (79%) LC/L′C
287 290 (0.055) H−1→L+3 (70%) LC/L′C/MLCT
2d 374 348 (0.075) H→L (90%) LC/L′LCT/MLCT
357 330 (0.032) H→L+1 (87%) LC/L′LCT/MLCT
281 288 (0.191) H−2→L (54%) LC
H→L+3 (27%) L′C/LL′CT/ML′CT
Table 3 Photophysical data of complexes2a–2din different media and1a–1din the solid state
Comp. Media Temp. λem[nm] τem(μs) ΦPL (%) λPhos. (theo.) λabs/nm (ε/10−4M−1cm−1)
1a Solid 298 K 489, 520max, 562 0.4 427
1b Solid 298 K 489, 519max, 560 1.5 422
1c Solid 298 K 492, 528max, 580max 0.4 463
1d Solid 298 K 479, 513max, 552 0.8 461
2a Solid 298 K 480, 510max, 539 36.4 2.5 421
77 K 479max, 508, 542
CH2Cl2 298 K 450, 479max, 510 <1a 0.6 329 (0.179), 307 (0.279), 270 (0.899) 77 K 475, 500max, 533
THF 298 K 427max, 467, 516 77 K 443max, 475, 504
2b Solid 298 K 482, 513max, 543 40.1 3.0 419
77 K 478max, 508, 544
CH2Cl2 298 K 486, 521max, 560 <1a 0.7 324 (0.585), 304 (0.808), 294 (0.826) 77 K 476, 504max, 542
THF 298 K 422max, 457, 494 77 K 452max, 483, 511
2c Solid 298 K 486, 518max, 545 53.9 1.0 459
77 K 487, 525max, 580
CH2Cl2 298 K 484, 520max, 557 4.0 0.8 376 (0.407), 358 (0.33), 287 (1.88) 77 K 484, 521max, 564
THF 298 K 439max, 463, 497 77 K 474max, 511, 554
2d Solid 298 K 490max, 530, 562 56.0 1.0 457
77 K 491max, 529, 570
CH2Cl2 298 K 483, 516max, 552 20.0 0.6 374 (0.441), 357 (0.348), 281 (2.047) 77 K 484max, 515, 453
THF 298 K 433max, 460, 493 77 K 471max, 510, 547
aLifetime was too short to be measured.
Published on 26 October 2017. Downloaded by Universitaetsbibliothek Regensburg on 12/7/2018 10:37:14 AM.
energies of selected relevant molecular orbitals of complexes 2a–2d and their compositions in the ground S0 state are reported in Table S2.† The frontier orbitals and the relative composing energy levels of complexes2a–2dare also shown in Fig. S2–S5.†The analysis of the frontier orbitals shows that in complexes 2a and 2b, the phosphine ligands have the maximum contribution to the highest occupied MO with some contributions of the Pt center, pπ orbitals of ppy and Me groups. The bhq complexes,2cand2d, pπorbitals of bhq have the maximum contribution to the HOMO. The results also show that the contribution of the bhq ligand to the HOMO is larger than that of the ppy ligand in related complexes. As expected, the ReO4 fragment has no contribution to the HOMO and LUMO, but shows more contributions to higher LUMOs. The LUMOs of complexes2a–2dare considerably loca- lized on the C^N ligands.
As shown in Fig. 4 and Table 2, there are some deviations between the experimental and calculated transitions. It should be noted that the energy difference between the elec- tronically singlet excited states and the ground state deter- mined in the ground state geometry (S0) corresponds to verti- cal absorption. Complexes2a and2b show good agreement with experiments but the errors for complexes2cand2dare 0.22 and 0.25 eV, respectively, which are acceptable for the B3LYP functional.38,41
In the spectrum of complex2a, the band appearing close to 329 nm has a mixed1LC, LL′CT and1MLCT character. In con- trast to2a, the related band in the spectrum of2b(which has a donor group such as Me on the phosphine ligand) is blue- shifted to nearly 324 nm. This blue shift is in agreement with the reduced calculated HOMO–LUMO separation for2a(4.447 eV) in comparison with that for2b(4.468 eV) (see Table S2†).
As seen in the spectrum of2c, there are two bands appearing at 376 and 358 nm, having a mixed1LC,1L′LCT and1MLCT character. These bands of complex 2d appeared at 374 and 357 nm and show again a slight blue shift compared to those for2c. These bands in complexes 2cand2d are significantly red-shifted relative to those observed in ppy complexes (329 and 324 nm for complexes 2a and 2b, respectively). This is attributed to the extended π-conjugation system in bhq com- plexes as compared to that for ppy analogues, causing a con- siderable reduction of the HOMO–LUMO separation for bhq compounds (4.159 and 4.167 eV for2cand2d, respectively) in comparison with that for ppy analogues (4.447 and 4.468 eV for2aand2b, respectively).
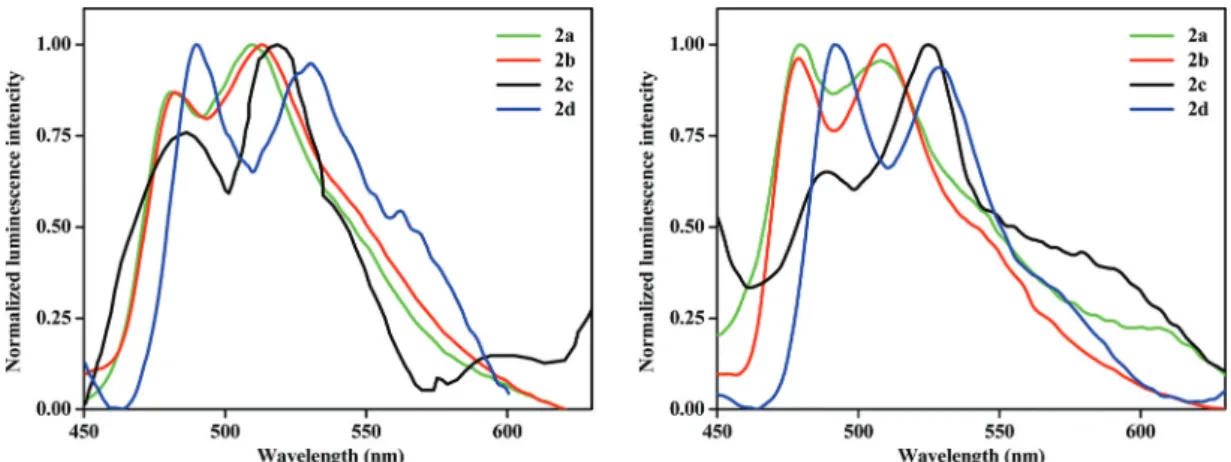
3.4.2. Emission spectra. The emission properties of the studied complexes were investigated in solid and degassed tetrahydrofuran and dichloromethane solutions at room (298 K) and low temperatures (77 K). The normalized emission spectra of these complexes are shown in Fig. 5, 6 and S6–S8†
Fig. 4 Overlaid experimental absorbance (spectra) and calculated TD-DFT (bars) of complexes2a–2d.
Published on 26 October 2017. Downloaded by Universitaetsbibliothek Regensburg on 12/7/2018 10:37:14 AM.
and the emission data are summarized in Table 3. Moreover, the emission spectra of the precursor complexes (1a–1d) were recorded in the solid state.
All complexes are emissive in the solid state. The excited- state lifetimes of the complexes are of the order of micro- seconds, ranging from 36.4μs to 56.0μs, showing phosphor- escence character and the quantum yields were between 1.0%
to 3.0%. The sharply structured emission bands in the solid state at room temperature indicate the presence of a large amount of ligand-centered character in the emissive excited state.26,27In this regard, the lower lifetime value of complex2a among the heterobimetallic complexes may be due to the less
3LC contribution in its emissive state.42Complexes with the bhq ligand (2cand2d) have larger lifetimes than their corres- ponding ppy analogues (2aand 2b) due to the expansion of the π-delocalization system.40 Upon cooling to 77 K in the solid state, the intensities of the emission bands are increased while the band shapes remain similar and show a negligible blue shift to those obtained at 298 K, showing that the com- plexes are quite rigid even at room temperature.37
As shown in Table 3, the emission bands for complexes2c and2d(having the bhq ligand) appeared at longer wavelengths
(i.e.red shifted phosphorescence) than those observed for2a and2b. This is attributed to the expansion of theπ-system in the bhq ligand as compared to that in the ppy ligand which leads to the reduction of the π–π* energy gap of the C^N ligands.39,40,43
Similar but blue shifted vibrational structured emission bands with the same order in energy shifting as mentioned before can be seen in THF compared to the solid state. This becomes better resolved in the frozen state at 77 K (Fig. 6 and Table 3). These structured bands are indicative of essentially
3LC (C^N) emitting excited states similar to other reported Pt (IV) complexes.26,27The emission spectra in THF at 77 K are significantly red shifted as compared to room temperature. For example, compound 2b has a 30 nm red shift at the peak maxima upon cooling to 77 K which is described asregidochro- mismat 77 K in solution.44
The study was carried out using a more polar solvent (CH2Cl2) as well to gain insight into the solvent-dependence of the emission spectra (see Fig. S8† and Table 3). The red shifted emission spectra compared to THF, a typical solvato- chromic effect, suggest a certain degree of charge transfer for the triplet transition.43,45On the other hand, this observation Fig. 5 Normalized emission spectra in the solid state of complexes2a–2d(left) at room temperature and (right) at low temperature (77 K).
Fig. 6 Normalized emission spectra of complexes2a–2din tetrahydrofuran (left) solution at 298 K and (right) at 77 K.
Published on 26 October 2017. Downloaded by Universitaetsbibliothek Regensburg on 12/7/2018 10:37:14 AM.
proposes that in CH2Cl2the excited state (triplet state) is more stabilized as compared to the ground state, which is due to the higher polarity of the excited stateversusthe ground state and a contribution of3MLCT character mixed with a3LC excited state. LMCT character has no role in the emission properties of these compounds, as can be seen in the natural transition orbitals (NTOs) of the first triplet excited state shown in Fig. 7.
As a final point, to illustrate the effect of ReO4− on the emission properties of the studied complexes, the emission spectra of the precursor cycloplatinated(IV) complexes (1a–1d) were studied in the solid state at 298 K. The normalized emis- sion spectra of these complexes are shown in Fig. 8 and the emission data are summarized in Table 3. As can be seen, all
complexes are emissive in the solid state. The emission bands for these complexes have a slight red shift and smaller quantum yields in comparison with those observed for solid 2a–2dat room temperature (about 0.4% to 1.5%).
TD-DFT calculations on optimized T1 geometries of the complexes result the phosphorescence wavelengths as 2a:
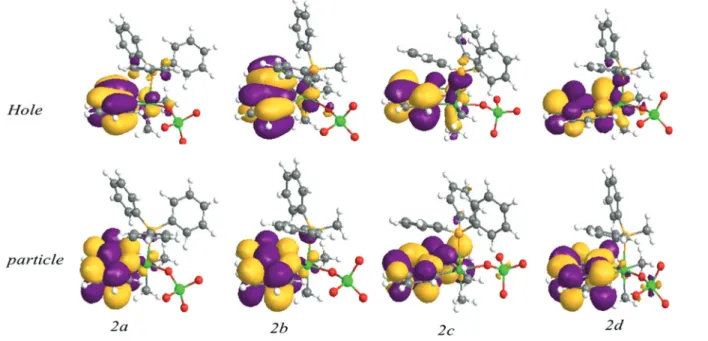
417 nm,2b: 417 nm,2c: 455 nm,2d: 456 nm which are very close to those reported in Table 3. The calculated lowest energy triplet states reproduce the trends observed experi- mentally for complexes1and2, so that the emission bands of 1a–1d appeared at lower wavelengths than those of 2a–2d (Table 3). NTOs for the lowest-energy triplet excitation in the optimized T1 geometry (corresponding to phosphorescence) are illustrated in Fig. 7 and 9. Although they show that the C^N and Pt metal center are delocalized over the particle NTOs, remarkably, the character of the hole NTOs of precursor complexes,1a–1d, has a different nature compared to that of complexes2a–2d. In the former complexes, there is a consider- able electron density on the iodide ligand on the hole, without any participation in the excited state. As mentioned above, for complexes 1a–1d, the emission behavior originates from a mixture of predominant3LC(C^N) mixed with3MLCT/3L″LCT character, so the iodide atom has an important role in the emission behavior. However, for compounds2a–2dthere is no electron density on the ReO4− group in the ground state, so this group does not play an important role in the excited state and transition originates from predominant 3LC with minor
3MLCT character. As a result, the replacement of the iodide atom with the ReO4−group increases the emission energy and the quantum yield efficiency by changing the character of emission. Although ReO4−has no noticeable contribution to the first triplet excited state frontier orbitals, due to the pres- ence of Re as a heavy metal, spin–orbit couplings (SOC) of Fig. 7 Natural transition orbitals calculated for thefirst triplet excited state of complexes2a–2d.
Fig. 8 Normalized emission spectra of complexes 1a–1din the solid state at 298 K.
Published on 26 October 2017. Downloaded by Universitaetsbibliothek Regensburg on 12/7/2018 10:37:14 AM.
such complexes are increased which lead to the enhancement of the intersystem crossing rate constant from the S1state to the T1 state besides more contribution of MLCT character in complexes2a–2dcompared to1a–1d.
4. Conclusions
In this work, a series of heterobimetallic Pt(IV)–O–Re(VII) com- plexes with the general formula [(C^N)LMe2Pt(μ-O)ReO3], in which oxygen acts as a mono-bridging atom, were synthesized and characterized. In these complexes, the perrhenate group is included in the coordination site of the Pt(IV) center having an octahedral geometry, completed by a cyclometalated bidentate ligand (C^N), two methyl groups and a phosphine ligand, while the Re(VII) center has a tetrahedral geometry.
Although many photophysical studies have been performed on d8 Pt(II) complexes and d6 complexes such as Ru(II) and Ir(III), studies on the photophysical properties of Pt(IV) com- plexes are scarce and in fact, to the best of our knowledge, the complexes discussed here are the first examples of lumines- cent heterobimetallic Pt(IV)–Re(VII) complexes. The photo- physical properties of these complexes were investigated and the results shown comply well with the DFT and TD-DFT calcu- lations. The following conclusions are drawn by referring to the data obtained:
1- The absorption band of the bhq containing complexes 2c–2dmildly red shifted as compared to that of the ppy ana- logue. We consider this behavior to be due to the more exten- siveπ-delocalization in the bhq ligand as compared with that in the ppy ligand. Based on the absorption spectra, it seems
that the effect of the nature of the P ligand (PPh3and PMePh2) is less important than the effect of the nature of the C^N ligand.
2- In the emission spectra of these Pt(IV)–O–Re(VII) com- plexes, although the change of the P donor ligand has a mild effect on the wavelength of the related emission band, moving from ppy to bhq (change in the C^N ligand) is moderately effective in this respect. In the emission spectra of the hetero- bimetallic complexes, the emissive state has predominantly
3LC character with minor 3MLCT character and so the emis- sion band is structured.
3- The solid state emission bands of heterobimetallic com- pounds show a red shift relative to the corresponding solution state emission bands. For example, the emission band of complex2din THF solution (433 nm) is red shifted to 490 nm in its solid state at 298 K.
4- Upon cooling to 77 K in the solid state, the intensities of the emission bands are increased while the band shapes remain similar to those obtained at 298 K. The heterobimetal- lic complexes show a blue shift on cooling to 77 K. This obser- vation is attributed to the increased rigidity in the frozen state.
5- It was found that theπ–π* energy gap of the cyclometa- lated ligands plays a significant role in fine-tuning the emis- sion wavelength of the heterobimetallic complexes. This energy gap can be effectively controlled by modifying the C^N backbone and extending the size of the π-conjugation system in the C^N ligand. As found here, expanding theπ-conjugated system causes the reduction of theπ–π* energy gap leading to a red shift in the emission energy.
6- To illustrate the effect of ReO4− on the emission pro- perties of the studied complexes, the emission spectra of the Fig. 9 Natural transition orbitals calculated for thefirst triplet excited state of1a–1d.
Published on 26 October 2017. Downloaded by Universitaetsbibliothek Regensburg on 12/7/2018 10:37:14 AM.
solid precursors cycloplatinated(IV) complexes (1a–1d) were recorded at 298 K. The replacement of iodide with ReO4−
increased the emission energy and the quantum yield efficiency by omitting the role of the I−ligand in the excited state.
Con fl icts of interest
There are no conflicts to declare.
Acknowledgements
This paper is dedicated to the memory of Prof. Mehdi Rashidi, the father of Organometallic Chemistry in Iran, who passed away on 31 March 2017. He was an exceptionally kind person and an enthusiastic chemist. We deeply miss him. We thank Professors Mahdi M. Abu-Omar and Peter C. Ford for reading and commenting on this manuscript before its submission for publication. We also thank the Iran National Science Foundation (Grant No. 93038832), the Shiraz University and the University of Regensburg for financial support. S. M. N. thanks Shiraz University for providing a sabbatical leave and the University of California, Santa Barbara, for hosting his sabbati- cal leave during which the writing of this manuscript was completed.
References
1 J. Prakash, G. T. Rohde, K. K. Meier, A. J. Jasniewski, K. M. Van Heuvelen, E. Münck and L. Que Jr.,J. Am. Chem.
Soc., 2015,137, 3478–3481.
2 X. Wu, T. Huang, T. T. Lekich, R. D. Sommer and W. W. Weare,Inorg. Chem., 2015,54, 5322–5328.
3 A. Zhou, S. T. Kleespies, K. M. Van Heuvelen and L. Que, Chem. Commun., 2015,51, 14326–14329.
4 H. W. Roesky, I. Haiduc and N. S. Hosmane, Chem. Rev., 2003,103, 2579–2596.
5 P. B. Chatterjee, S. M. T. Abtab, K. Bhattacharya, A. Endo, E. J. Shotton, S. J. Teat and M. Chaudhury, Inorg. Chem., 2008,47, 8830–8838.
6 I. S. Gonçalves, A. D. Lopes, T. R. Amarante, F. A. A. Paz, N. J. Silva, M. Pillinger, S. Gago, F. Palacio, F. E. Kühn and C. C. Romão,Dalton Trans., 2009, 10199–10207.
7 A. Roth, E. T. Spielberg and W. Plass, Inorg. Chem., 2007, 46, 4362–4364.
8 E. E. Chufán, C. N. Verani, S. C. Puiu, E. Rentschler, U. Schatzschneider, C. Incarvito, A. L. Rheingold and K. D. Karlin,Inorg. Chem., 2007,46, 3017–3026.
9 J. T. York, A. Llobet, C. J. Cramer and W. B. Tolman,J. Am.
Chem. Soc., 2007,129, 7990–7999.
10 S. Kundu, F. F. Pfaff, E. Miceli, I. Zaharieva, C. Herwig, S. Yao, E. R. Farquhar, U. Kuhlmann, E. Bill and P. Hildebrandt, Angew. Chem., Int. Ed., 2013, 125, 5732– 5736.
11 K. Bhattacharya, S. M. T. Abtab, M. C. Majee, A. Endo and M. Chaudhury,Inorg. Chem., 2014,53, 8287–8297.
12 J. Małecki, B. Machura, A. Palion, I. Gryca, M. Oboz and T. Groń,Polyhedron, 2014,76, 10–15.
13 T. Huang, X. Wu, X. Song, H. Xu, T. I. Smirnova, W. W. Weare and R. D. Sommer,Dalton Trans., 2015,44, 18937–18944.
14 T. Huang, X. Wu, W. W. Weare and R. D. Sommer, Eur. J. Inorg. Chem., 2014,2014, 5662–5674.
15 I. S. Gonçalves, A. D. Lopes, T. R. Amarante, F. A. A. Paz, N. J. Silva, M. Pillinger, S. Gago, F. Palacio, F. E. Kühn and C. C. Romao,Dalton Trans., 2009, 10199–10207.
16 K. R. Pichaandi, L. Kabalan, H. Amini, G. Zhang, H. Zhu, H. I. Kenttämaa, P. E. Fanwick, J. T. Miller, S. Kais, S. M. Nabavizadeh, M. Rashidi and M. M. Abu-Omar,Inorg.
Chem., 2017,56, 2145–2152.
17 S. Kajouj, L. Marcélis, V. Lemaur, D. Beljonne and C. Moucheron,Dalton Trans., 2017,46, 6623–6633.
18 S. Xu, J. E. Smith, S. Gozem, A. I. Krylov and J. M. Weber, Inorg. Chem., 2017,56, 7029–7037.
19 Y.-J. Cho, S.-Y. Kim, J.-H. Kim, J. Lee, D. W. Cho, S. Yi, H.-J. Son, W.-S. Han and S. O. Kang, J. Mater. Chem. C, 2017,5, 1651–1659.
20 M. S. Sangari, M. G. Haghighi, S. M. Nabavizadeh, M. Kubicki and M. Rashidi, New J. Chem., 2017, DOI:
10.1039/c7nj03034g.
21 H. R. Shahsavari, R. B. Aghakhanpour, M. Babaghasabha, M. G. Haghighi, S. M. Nabavizadeh and B. Notash, New J. Chem., 2017,41, 3798–3810.
22 S. Y.-L. Leung, S. Evariste, C. Lescop, M. Hissler and V.
W.-W. Yam,Chem. Sci., 2017,8, 4264–4273.
23 L. Chassot, A. Von Zelewsky, D. Sandrini, M. Maestri and V. Balzani,J. Am. Chem. Soc., 1986,108, 6084–6085.
24 D. M. Jenkins and S. Bernhard, Inorg. Chem., 2010, 49, 11297–11308.
25 F. Juliá, G. Aullón, D. Bautista and P. González-Herrero, Chem.–Eur. J., 2014,20, 17346–17359.
26 F. Juliá, D. Bautista and P. González-Herrero, Chem.
Commun., 2016,52, 1657–1660.
27 F. Juliá, M.-D. García-Legaz, D. Bautista and P. González- Herrero,Inorg. Chem., 2016,55, 7647–7660.
28 N. Giménez, R. Lara, M. T. Moreno and E. Lalinde,Chem.
Eur. J., 2017,23, 5758–5771.
29 S. M. Nabavizadeh, H. Amini, F. Jame, S. Khosraviolya, H. R. Shahsavari, F. N. Hosseini and M. Rashidi, J. Organomet. Chem., 2012,698, 53–61.
30 M. J. Frisch, N. Rega, G. A. Petersson, G. W. Trucks, H. Nakatsuji, M. Hada, M. Ehara, K. Toyota, R. Fukuda, J. Hasegawa, M. Ishida, J. C. Burant, T. Nakajima, Y. Honda, O. Kitao, H. B. Schlegel, H. Nakai, M. Klene, X. Li, J. E. Knox, H. P. Hratchian, J. B. Cross, J. M. Millam, V. Bakken, C. Adamo, J. Jaramillo, R. Gomperts, G. E. Scuseria, R. E. Stratmann, O. Yazyev, A. J. Austin, R. Cammi, C. Pomelli, S. S. Iyengar, J. W. Ochterski, P. Y. Ayala, K. Morokuma, G. A. Voth, P. Salvador, M. A. Robb, J. J. Dannenberg, V. G. Zakrzewski,
Published on 26 October 2017. Downloaded by Universitaetsbibliothek Regensburg on 12/7/2018 10:37:14 AM.
S. Dapprich, A. D. Daniels, J. Tomasi, M. C. Strain, O. Farkas, D. K. Malick, A. D. Rabuck, K. Raghavachari, J. B. Foresman, J. R. Cheeseman, J. V. Ortiz, Q. Cui, A. G. Baboul, V. Barone, S. Clifford, J. Cioslowski, B. B. Stefanov, G. Liu, A. Liashenko, P. Piskorz, I. Komaromi, J. A. Montgomery Jr., R. L. Martin, D. J. Fox, B. Mennucci, T. Keith, M. A. Al-Laham, C. Y. Peng, A. Nanayakkara, M. Challacombe, P. M. W. Gill, B. Johnson, W. Chen, T. Vreven, M. W. Wong, M. Cossi, C. Gonzalez, J. A. Pople, K. N. Kudin and G. Scalmani, Gaussian 03, Revision C.02, 2004.
31 P. J. Hay and W. R. Wadt,J. Chem. Phys., 1985,82, 270–283.
32 E. S. Raper,Coord. Chem. Rev., 1985,61, 115–184.
33 G. M. Sheldrick, Acta Crystallogr., Sect. C: Cryst. Struct.
Commun., 2015,71, 3–8.
34 M. Safa and R. J. Puddephatt,J. Organomet. Chem., 2013, 724, 7–16.
35 M. D. Aseman, M. Rashidi, S. M. Nabavizadeh and R. J. Puddephatt,Organometallics, 2013,32, 2593–2598.
36 M. Safa, M. C. Jennings and R. J. Puddephatt, Organometallics, 2012,31, 3539–3550.
37 R. B. Aghakhanpour, S. M. Nabavizadeh and M. Rashidi, J. Organomet. Chem., 2016,819, 216–227.
38 C. Adamo and D. Jacquemin, Chem. Soc. Rev., 2013, 42, 845–856.
39 M. Jamshidi, S. M. Nabavizadeh, H. R. Shahsavari and M. Rashidi,RSC Adv., 2015,5, 57581–57591.
40 M. Jamshidi, S. M. Nabavizadeh, H. Sepehrpour, F. N. Hosseini, R. Kia and M. Rashidi,J. Lumin., 2016,179, 222–229.
41 J. W. Gauld,J. Am. Chem. Soc., 2005,127, 3233.
42 R. B. Aghakhanpour, S. M. Nabavizadeh, M. Rashidi and M. Kubicki,Dalton Trans., 2015,44, 15829–15842.
43 A. Bossi, A. F. Rausch, M. J. Leitl, R. Czerwieniec, M. T. Whited, P. I. Djurovich, H. Yersin and M. E. Thompson, Inorg. Chem., 2013, 52, 12403– 12415.
44 J. Brooks, Y. Babayan, S. Lamansky, P. I. Djurovich, I. Tsyba, R. Bau and M. E. Thompson,Inorg. Chem., 2002, 41, 3055–3066.
45 J. R. Berenguer, Á. Díez, E. Lalinde, M. T. Moreno, S. Ruiz and S. Sánchez,Organometallics, 2011,30, 5776–5792.
Published on 26 October 2017. Downloaded by Universitaetsbibliothek Regensburg on 12/7/2018 10:37:14 AM.