Optical conductivity of hydrogenated graphene from first principles
Sebastian Putz, Martin Gmitra, and Jaroslav Fabian
Institute for Theoretical Physics, University of Regensburg, D-93040 Regensburg, Germany (Received 4 September 2013; revised manuscript received 15 November 2013; published 31 January 2014) We investigate the effect of hydrogen coverage on the optical conductivity of single-side hydrogenated graphene from first-principles calculations. To account for different degrees of uniform hydrogen coverage we calculate the complex optical conductivity for graphene supercells of various sizes, each containing a single additional hydrogen atom. We use the linearized augmented plane wave method, as implemented in theWIEN2Kdensity functional theory code, to show that the hydrogen coverage strongly influences the complex optical conductivity and thus the optical properties, such as absorption, of hydrogenated graphene. We find that the optical conductivity of graphene in the infrared, visible, and ultraviolet range has different characteristic features depending on the degree of hydrogen coverage. This opens up new possibilities to tailor the optical properties of graphene by reversible hydrogenation, and to determine the hydrogen coverage of hydrogenated graphene samples in the experiment by contact-free optical absorption measurements.
DOI:10.1103/PhysRevB.89.035437 PACS number(s): 73.22.Pr,78.67.Wj,81.05.Zx I. INTRODUCTION
Graphene [1,2] has shaped nanoscience and materials research over the last decade like hardly any other material.
Its exceptional electronic structure [3], with charge carriers resembling two-dimensional massless Dirac fermions, entails a variety of remarkable properties likely to be harnessed in novel nanoelectronic devices. Adding to the unusual electronic [4], mechanical [5], and transport [6] properties originating in the linear energy-momentum dispersion of its charge carriers, its optical properties put graphene in the spotlight of optoelectronics and photonics research [7–10].
With graphene being a zero-gap semiconductor, a lot of effort has gone into investigating how its band gap can be tuned in a controlled way to combine the advantages of graphene and modern semiconductor devices [11]. Size restriction [12,13] or special substrates [14], for example, can introduce a band gap in graphene, but these approaches are irreversible, difficult to implement in devices, or result in fragile band gaps. Chemical functionalization of graphene [15–19], on the other hand, was demonstrated to be a reversible method to induce robust, tunable band gaps.
Decoration with adatoms such as oxygen [20], fluo- rine [21,22], or hydrogen [23–27], significantly alters the properties of pristine graphene and, in some cases, causes a transition to another class of material altogether: Full hydrogenation of graphene (one completely covered carbon sublattice on each side) leads to the nonmagnetic, direct wide-gap semiconductor graphane, which was predicted in 2007 by Sofo et al. [28] from first-principles calculations, and demonstrated in the laboratory by Elias et al.[29] two years later. In contrast, as predicted by Zhou et al. [30], semihydrogenation (one completely covered carbon sublattice on one side) produces the ferromagnetic, indirect narrow-gap semiconductorgraphone. Although the latter system has not yet been synthesized, the transition from graphene to graphone and graphane with increasing degree of hydrogenation shows that the amount of adatom coverage is decisive for the properties of the resulting graphene derivate.
One such property is the presence of magnetic moments, which is particularly important for graphene spintronics
[31–33]. Several studies suggest that hydrogenated graphene is indeed magnetic for certain degrees of hydrogenation [34–39].
Optical spectra might thus present an effective means of study- ing the exchange-split electronic band structure of magnetic hydrogenated graphene with respect to its hydrogen coverage, and enable us to determine if the ground state of hydrogenated graphene is magnetic or not.
The optical conductivity is another property inves- tigated both theoretically and experimentally for many graphene-based systems such as single [40–44] and few layer graphene [45,46], graphite [47–49], and carbon nan- otubes [50].
In this work, we study the influence of hydrogenation on the optical conductivity spectrum of graphene from first-principles density functional theory (DFT) [51,52] calculations. We consider three hydrogenated graphene systems with different degrees of uniform single-side hydrogenation, 50%, 12.5%, and 2%, and compare their calculated optical conductivity spectra to that of pure graphene.
Our results show that the characteristic features of the spec- tra vary strongly with the degree of hydrogenation, suggesting that the latter could be measured by purely optical—and thus contact-free—methods, and that reversible hydrogenation could be used to tailor the optical properties of graphene in the infrared, visible, and ultraviolet regions of the electromagnetic spectrum.
Going beyond Kohn-Sham DFT with a GW calculation, the electronic structure of hydrogenated graphene exhibits larger band gaps [53–55], leading to a shift in energy of the characteristic optical conductivity peaks of the spectra presented in this work. Although quantitatively different, the linear response spectra derived from a GW calculation should remain qualitatively unchanged. We thus expect our main results to be valid beyond standard DFT.
In the following section we present the methods used to obtain the results discussed in Sec. III, which include the calculated electronic structure and total density of states of various single-side hydrogenated (SSH) graphene systems, as well as their optical conductivity spectra and an analysis of how these are influenced by structural characteristics and
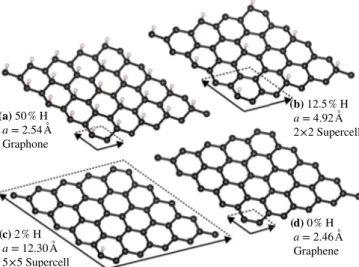
FIG. 1. (Color online) Comparison of different systems investi- gated in this study usingQUANTUM ESPRESSOstructure optimization data. The unit cell of graphone (a) contains 2 C+1 H atoms and has a single-side hydrogen coverage of 50%. The larger 2×2 (b) and 5×5 (c) supercells contain 8 C+1 H and 50 C+1 H atoms, respectively, accounting for 12.5% and 2% of hydrogen coverage.
Pure graphene (d) with two C atoms per unit cell corresponds to 0%
hydrogen coverage. The lattice constantais given for each system.
the presence of magnetic moments. The summary in Sec.IV concludes this work.
II. METHOD
Graphene supercells of different size, each containing a single additional hydrogen atom, are used to represent different degrees of single-side hydrogenation (see Fig.1). In the case of 50% SSH graphene (in other words, graphone), the modified standard unit cell of graphene contains 2 C+1 H atoms. The 12.5% and 2% SSH graphene systems are modeled by a 2×2 and a 5×5 supercell consisting of 8 C+1 H and 50 C+1 H atoms, respectively. For pure graphene the standard unit cell with two carbon atoms is used. In each system the graphene layers are separated by the vertical unit cell edge length of c=15 ˚A to suppress interlayer coupling.
In the first step, the atomic positions in the three SSH graphene cells are optimized using the plane wave pseu- dopotential codeQUANTUM ESPRESSO[56], which implements a quasi-newton algorithm for atomic force relaxation. We use ultrasoft pseudopotentials [57] for carbon and hydrogen, and the Perdew-Burke-Ernzerhof variant of the generalized gradient approximation (PBE-GGA) [58] for the exchange- correlation functional. The plane wave basis set is independent of the atom positions and species, which is why the calculated total forces on the atoms are true Hellman-Feynman [59]
forces, without the need for basis-set corrections (Pulay forces) [60]. This, combined with the computational efficiency of the plane wave basis set, makes QUANTUM ESPRESSO a suitable choice for the initial structural optimization of large supercells (the 5×5 supercell contains 51 atoms).
For the self-consistent calculations in the structural op- timization process a kinetic energy cutoff for the wave functions of 30 Ry is used. Thek-point sampling following
TABLE I. Structural parameters of the investigated hydrogenated graphene systems after relaxation. The in-plane supercell edge length is denoted bya(the vertical edge lengthc=15 ˚A for each supercell), while the C-H bond length, and the C-C distance between the carbon atoms surrounding the hydrogenated carbon site are given bydHand dCC, respectively. The parameterdescribes the vertical distance between the hydrogenated carbon atoms and their neighbors, with the ratio/dCCbeing a measure for the out-of-plane distortion induced by hydrogenation. All lengths are given in angstroms ( ˚A).
System SSH a dH dCC /dCC
Graphone 50% 2.54 1.158 2.537 0.322 12.9%
2×2 12.5% 4.92 1.131 2.500 0.344 13.8%
5×5 2% 12.30 1.128 2.516 0.363 14.4%
the Monkhorst-Pack [61] scheme is (30×30×1) k points in the full first Brillouin zone of graphene and the 1×1 supercell, corresponding to (15×15×1) and (8×8×1) k points for the 2×2 and 5×5 supercell, respectively. A total energy difference of less than 10−8 Ry and a force difference of less than 10−3a.u. between subsequent iterations are chosen as convergence criteria. With these parameters the resulting structures are found to be sufficiently relaxed to obtain well-converged optical properties in the subsequent steps of the calculation.
TableIsummarizes the structural parameters of each system after optimization. The tetragonal out-of-plane distortion (rippling) of the structures can be expressed by the quantity /dCC(see caption of Table I) and increases with decreasing hydrogen coverage. Each C-H bond requires an additional electron drawn from the electronic system of the graphene plane, which weakens the C-C bonds around the hydrogenated atom and expands the structure. For lower densities of hydro- genated carbon atoms this expansion becomes less pronounced while their vertical distance to the graphene plane increases, thus leading to an increase in the rippling.
The second step involves the calculation of the electronic band structure and the total density of states (DOS) of each system with the full-potential linearized augmented plane wave [62] codeWIEN2K[63]. We again choose the PBE-GGA as the exchange-correlation functional and obtain the self- consistent electronic ground state density for each system.
Here, the convergence criterion is that the charge distance between two consecutive iterations of the self-consistent field cycle, integrated over the unit cell, be smaller than 10−5e, whereeis the positive value of the elementary charge. Thek- point sampling of the irreducible Brillouin zone is (9×9×1) k points for the 5×5 supercell, and at least (15×15×1) k points for all other cases. In order to study the effect of adatom-induced magnetic moments on the optical properties of hydrogenated graphene, we perform both a nonmagnetic calculation (this means the calculation explicitly disregards the electron spin), and a spin-polarized calculation for each system except pure graphene, for which we perform only a nonmagnetic reference calculation.
In the last step we use the converged systems of Kohn- Sham [52] eigenenergies and eigenstates to obtain the imagi- nary part of the complex dielectric function in linear response.
The WIEN2K optics package implements the following for- mula [64] to calculate this quantity:
Im[αβ(ω)]= 2e2 π m2eω2
n=n
dkαnn,kβnn,k
×[f(n,k)−f(n,k)]δ(n,k−n,k−ω).
(1) Here, αnn,k= n,k|pˆα|n,k is the transition matrix el- ement of the α component of the momentum operator for a direct interband transition (n=n) from the initial Kohn- Sham state |n,k with energyn,k into the final state |n,k with energy n,k, f(n,k) is the Fermi-Dirac distribution function evaluated at energy n,k, me denotes the electron mass, andωis the angular frequency of the electromagnetic radiation causing the transition. For this type of calculation we choose a dense k-point sampling of (45×45×1) for the 5×5 supercell and at least (51×51×1) for all other supercells. Thek-space integration makes use of the Bl¨ochl tetrahedron method [65] and only direct interband transitions from occupied to unoccupied bands up to an energy of 20 eV above the Fermi level are taken into account.
The real part of the complex optical conductivity is calculated from the imaginary part of the complex dielectric function of Eq. (1) using [66]
Re[σαβ(ω)]= ω
4πIm[αβ(ω)]. (2) However, in our case this results in the optical conductivity for the three-dimensional slab supercell whose edge length cperpendicular to the graphene layer produces an interlayer spacing large enough to prevent any hybridization of states pertaining to adjacent graphene sheets. Multiplying the result of Eq. (2) by the interlayer spacing c=15 ˚A leads to the desired value of the optical conductivity for the essentially two-dimensional hydrogenated graphene film.
To achieve better interpretability and comparability with existing theoretical and experimental work, we normalize the calculated spectra to the universal ac optical conductivity of graphene [67–70], given byσ0=e2/(4).
III. RESULTS
While each carbon atom in pure graphene is covalently bonded to its three neighbors, thus being sp2 hybridized, hydrogenated carbon atoms in hydrogenated graphene are closer to ansp3-hybridized tetrahedral conformation with the C-H bond axis oriented perpendicular to the graphene layer.
This results in a buckling of the graphene sheet in the vicinity of hydrogenated carbon sites, as the carbon atoms carrying a hydrogen atom are shifted out of plane to adopt an energetically more favorable tetrahedral conformation (see Table I) [23].
In the dilute hydrogenation limit, a single, isolated hydrogen adatom affects the properties of graphene only locally, whereas a dense hydrogen coverage profoundly impacts its atomic and electronic structure. For example, each additional isolated hydrogen adatom adds a magnetic moment of about 1μB(Bohr magneton) to the system [34].
For each hydrogenated graphene system we thus perform a spin-polarized and—to study the influence of magnetic
FIG. 2. (Color online) Calculated electronic band structure along high-symmetry lines in the first Brillouin zone (left panels) and broadened total DOS per unit cell (right panels) for the nonmagnetic (a) and the spin-polarized (b) 50% SSH case (graphone). In the spin-polarized case the spin-resolved total DOS is shown; quantities associated with spin up (down) are shown as solid red (dashed blue) lines. Energies are given relative to the Fermi energyEF. Labeled arrows indicate direct interband transitions corresponding to pronounced features in the optical conductivity spectra (see Fig.6).
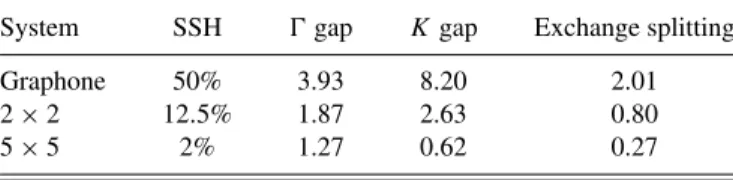
moments on the electronic band structure and the optical conductivity—a non-spin-polarized calculation, with the latter resulting in a nonmagnetic system. We use the calculated electronic band structure and total DOS presented in Figs.2–5 to identify those direct interband transitions that significantly contribute to the pronounced features of the optical conductiv- ity spectra shown in Fig.6. The transitions indicated by arrows and roman capital letters in Figs.2–5serve as representatives for all transitions that can occur between a given pair of bands at different values ofk, and match the features marked with the same capital letters in Fig.6. TableIIprovides a summary of the calculated values for band gaps at high-symmetry points and the exchange splittings at the Fermi energy. The latter have been derived by determining the distance between corresponding characteristic peaks in the spin-resolved total densities of states (see bottom right panels in Figs.2–4).
A. Electronic structure
In the dense limit of 50% SSH graphene (graphone; see Fig.2), in the spin-polarized as well as the nonmagnetic case, the Dirac cone at theKpoint is completely absent. In fact, there are no conic features whatsoever. In both cases band gaps open, and a relatively flat midgap state (which is exchange split in the spin-polarized case) appears close to the Fermi energy. While
FIG. 3. (Color online) See the caption of Fig.2, but for the 12.5%
SSH case (2×2 supercell).
this midgap state crosses the Fermi energy in the nonmagnetic case, resulting in a metallic band structure, its exchange-split
FIG. 4. (Color online) See the caption of Fig.2, but for the 2%
SSH case (5×5 supercell).
FIG. 5. (Color online) See the caption of Fig.2, but for nonmag- netic pure graphene.
equivalent in the spin-polarized case leads to an indirect band gap of about 0.47 eV between the valence band maximum along theK high-symmetry line and the conduction band minimum at thepoint. Having a high density of states, these bands are responsible for the characteristic features of the optical conductivity spectra at energies5 eV because they provide the initial or final states for many transitions.
An intermediate single-side hydrogenation value of 12.5%
(see Fig.3) presents a band structure similar to the previous case, but with a smaller exchange splitting of the bands in the spin-polarized calculation (see TableII). The midgap states
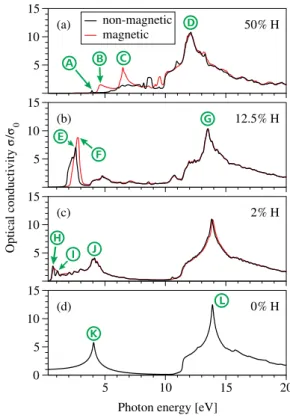
FIG. 6. (Color online) Calculated real part of the complex optical conductivityσfor 50% (a), 12.5% (b), and 2% (c) SSH graphene, as well as pure graphene (d), given in units of the universal ac optical conductivityσ0of graphene. Pronounced features of the spectra are labeled in concordance with the arrows in Figs.2–5, indicating the most important transitions contributing to them.
TABLE II. Calculated band gaps at theandKhigh-symmetry points (nonmagnetic case), and exchange splitting at the Fermi energy (spin-polarized case) for each SSH graphene system. All energy difference values are given in electron volts (eV).
System SSH gap Kgap Exchange splitting
Graphone 50% 3.93 8.20 2.01
2×2 12.5% 1.87 2.63 0.80
5×5 2% 1.27 0.62 0.27
become flatter and their smaller splitting results in a smaller indirect band gap of about 0.39 eV in the spin-polarized case, whereas the nonmagnetic case is metallic. This is consistent with the smaller areal density of magnetic moments in the 2×2 supercell as compared to the 1×1 cell of graphone, illustrating the decreased influence of the magnetic moments in this case of medium hydrogen coverage. Furthermore, the states at theKpoint of the neighboring bands (or exchange- split band pairs) above and below the midgap states are closer to the Fermi level than in the 50% SSH case.
The exchange splitting in the dilute limit of 2% SSH graphene (see Fig. 4) is even smaller than for the previous systems (see Table II), aligning the spin-polarized with the nonmagnetic band structure. This is because the additional magnetic moments introduced by the hydrogen adatoms are distributed over 50 carbon atoms of the 5×5 supercell. The midgap states are almost completely flat, and the neighboring bands above and below the midgap states approach each other at theK points, eventually reforming a Dirac cone when the amount of hydrogen coverage is further reduced below 2%.
Pure graphene (corresponding to 0% SSH; see Fig. 5) serves as a reference calculation. The system is a zero-gap semiconductor characterized by the linear dispersion relation (Dirac cones) in the vicinity of theKpoints.
B. Optical conductivity
The optical conductivity spectra for all four systems (see Fig.6) are obtained from the electronic band structure results using the method described in Sec. II. The spectra are calculated for photon energies ranging from 0.3 to 20 eV with a resolution of 1.36 meV, comprising the infrared, visible, and ultraviolet (IR-VIS-UV) parts of the electromagnetic spectrum. Lorentzian broadening of 50 meV is applied to account for finite-lifetime effects.
For each hydrogenated system the results for both the spin- polarized and the nonmagnetic calculation are shown. In the following, capital letters in parentheses, such as (A), refer to the labels used in Figs.2–6. Each paragraph deals with one of the three investigated hydrogenated graphene systems.
Within the calculated spectral range, graphone [50% SSH graphene; see Fig. 6(a)] is transparent for photon energies below 5 eV, except for a small peak (A) at 3.9 eV. The most prominent feature is a broad peak at around 12.1 eV (D). For energies between 4 and 10 eV the spectra of the nonmagnetic and the spin-polarized case differ considerably as the spin-split band structure of the latter gives rise to two new peaks at 4.6 eV (B) and 6.6 eV (C), while the spectra are similar for energies above 10 eV. This indicates that for 50% hydrogenation the
spectrum is significantly influenced by magnetic moments for photon energies below 10 eV.
An interesting phenomenon occurs in 12.5% SSH graphene [see Fig.6(b)]. Coincidentally, the transitions to and from the midgap state (or the exchange-split midgap states in the spin- polarized case) are of the same energy, and both contribute to a pronounced peak at 2.5 eV (E) or 2.8 eV (F) in the visible part of the electromagnetic spectrum between 1.5 and 3 eV.
The center of the broad peak similar to that in the 50% SSH case is shifted to higher energies and centered at 13.6 eV (G).
The dilute 2% hydrogenation case [see Fig.6(c)] shows many features in the low-energy region from 0.3 to 5 eV, the most important of which are the absorption peaks at 0.7 eV (H), 1.1 eV (I), and 4.2 eV (J). The broad peak centered at 13.9 eV is shifted to higher energies compared to the previous two cases. The spectra for the nonmagnetic and the spin-polarized case hardly differ, which is consistent with the low areal density of magnetic moments in the 2%
SSH case (1μB per 50 carbon atoms). The overall shape of the spectrum is approaching the reference spectrum of pure graphene [see Fig.6(d)], whose most pronounced features are the peaks at 4.1 eV (K) and 13.9 eV (L).
C. Influence of structure and magnetic moments In order to determine how strongly the presence of magnetic moments, or of different structural characteristics, influences the optical conductivity spectrum of hydrogenated graphene, we compare the spectra of 50% SSH graphene for the following three cases: the nonmagnetic case, the spin-polarized case, and an artificially flat spin-polarized case in which all carbon atoms are restricted to the same plane. The results are shown in Fig.7, which is equivalent to Fig.6(a), except for the additional curve of the flat spin-polarized case.
The spectrum of the flat spin-polarized case is shifted towards higher energies with respect to the nonmagnetic case, but the overall shape is similar and both cases have their most pronounced spectral features in common. In contrast, the result for the relaxed (buckled) spin-polarized case is very different (as discussed in Sec.III B). This indicates that magnetism in the flat case is quenched. Hence, we conclude
FIG. 7. (Color online) Calculated real part of the complex optical conductivityσ in units of the universal ac optical conductivityσ0of graphene for 50% SSH graphene, comparing the nonmagnetic, the spin-polarized, and another spin-polarized but unrelaxed flat case, in which all carbon atoms are restricted to the same plane.
that the out-of-plane distortion of the hydrogenated carbon atom is a structural characteristic that is crucial to the optical properties of hydrogenated graphene within the PBE-GGA framework. The influence of magnetic moments, if present, is also considerable, which is why we expect an optical measurement to be able to detect the presence of magnetic moments in real hydrogenated graphene samples. However, it should be noted that Casoloet al.[71] demonstrated that the quenching of magnetism in the flat hydrogenated graphene system is due to the self-interaction error afflicting GGA functionals such as PBE, and thus not physical, and that magnetism in the flat system is recovered in calculations employing hybrid functionals such as PBE0, which mixes PBE exchange with Hartree-Fock exchange.
IV. CONCLUSIONS
We studied the influence of hydrogenation on the optical conductivity of hydrogenated graphene from first-principles calculations. Different degrees of hydrogenation were simu- lated by optimized-geometry graphene supercells of different size, each containing an additional hydrogen atom. Performing both an explicitly nonmagnetic and a spin-polarized calculation for each supercell, we obtained the electronic band structure and total density of states for 50%, 12.5%, 2%, and 0% hydrogenated graphene. These results were used to calculate the corresponding optical conductivity spectra in linear response over the IR-VIS-UV range of the electromagnetic spectrum.
While the dense hydrogenation in the 50% SSH case exhibited a spectrum distinct from that of pure graphene, the influence of the local tetrahedral conformation of the hydro- genated carbon atoms and the resulting magnetic moments degraded with decreasing hydrogenation density. For interme- diate values of hydrogenation we observed the coincidental appearance of a pronounced peak in the optical conductivity in the visible part of the spectrum.
Since the influence of hydrogenation on the optical con- ductivity was found to be significant, one could employ optical measurement techniques (for example an absorption measurement) to monitor the hydrogenation process, or one could tailor the optical conductivity of graphene by reversible hydrogenation. Furthermore, our results suggest that an optical measurement could determine if the ground state of hydrogen- functionalized graphene is magnetic or not.
Finally, a comparison of three different calculations of the 50% SSH case showed that, within the PBE generalized gradient approximation to the exchange-correlation functional, structural changes induced by hydrogen adatoms are ulti- mately responsible for additional magnetic moments and hydrogenation-dependent optical conductivity spectra.
Note added. Recently, we learned about the work of Cheng et al.[72], which also deals with first-principles optical spectra of hydrogenated graphene. Our numerical data of the diagonal components of the optical conductivity agree well with those of Chenget al.Unfortunately, we cannot confirm the results for the off-diagonal componentσxy, which quantifies effects such as Faraday rotation. Even at the very high degree of numerical precision of 15 760kpoints in the irreducible Brillouin zone for the optics calculation, the convergence of σxy (which is numerically very subtle to calculate) eluded us for the small 50% SSH graphene supercell, and even more so for the 2×2 and 5×5 supercells. This is why we do not present such data here. Our preconvergence results for σxy are not only one order of magnitude smaller than those of Cheng et al., they also do not exhibit any similar trend. A possible reason is that the method of Chenget al. relies on an interpolation technique for the k-point grid in the irreducible Brillouin zone. Our method does not make such an approximation.
ACKNOWLEDGMENT
This work was supported by GRK 1570 of the German Research Foundation.
[1] K. S. Novoselov, A. K. Geim, S. V. Morozov, D. Jiang, Y. Zhang, S. V. Dubonos, I. V. Grigorieva, and A. A. Firsov,Science306, 666(2004).
[2] A. K. Geim and K. S. Novoselov,Nat. Mater.6,183(2007).
[3] A. H. Castro Neto, N. M. R. Peres, K. S. Novoselov, and A. K.
Geim,Rev. Mod. Phys.81,109(2009).
[4] M. I. Katsnelson, K. S. Novoselov, and A. K. Geim,Nat. Phys.
2,620(2006).
[5] C. Lee, X. Wei, J. W. Kysar, and J. Hone,Science321, 385 (2008).
[6] K. S. Novoselov, A. K. Geim, S. V. Morozov, D. Jiang, M. I.
Katsnelson, I. V. Grigorieva, S. V. Dubonos, and A. A. Firsov, Nature (London)438,197(2005).
[7] F. Xia, T. Mueller, Y.-m. Lin, A. Valdes-Garcia, and P. Avouris, Nat. Nanotechnol.4,839(2009).
[8] F. Bonaccorso, Z. Sun, T. Hasan, and A. C. Ferrari, Nat.
Photonics4,611(2010).
[9] T. Mueller, F. Xia, and P. Avouris, Nat. Photonics 4, 297 (2010).
[10] G. Konstantatos, M. Badioli, L. Gaudreau, J. Osmond, M. Bernechea, F. P. Garcia de Arquer, F. Gatti, and F. H. L.
Koppens,Nat. Nanotechnol.7,363(2012).
[11] F. Schwierz,Nat. Nanotechnol.5,487(2010).
[12] M. Y. Han, B. ¨Ozyilmaz, Y. Zhang, and P. Kim,Phys. Rev. Lett.
98,206805(2007).
[13] X. Li, X. Wang, L. Zhang, S. Lee, and H. Dai,Science319, 1229(2008).
[14] G. Giovannetti, P. A. Khomyakov, G. Brocks, P. J. Kelly, and J. van den Brink,Phys. Rev. B76,073103(2007).
[15] R. Balog, B. Jørgensen, L. Nilsson, M. Andersen, E. Rienks, M. Bianchi, M. Fanetti, E. Lægsgaard, A. Baraldi, S. Lizzit, Z. Sljivancanin, F. Besenbacher, B. Hammer, T. G. Pedersen, P. Hofmann, and L. Hornekær,Nat. Mater.9,315(2010).
[16] F. Schedin, A. K. Geim, S. V. Morozov, E. W. Hill, P. Blake, M. I. Katsnelson, and K. S. Novoselov, Nat. Mater. 6, 652 (2007).
[17] I. Gierz, C. Riedl, U. Starke, C. R. Ast, and K. Kern,Nano Lett.
8,4603(2008).
[18] D. W. Boukhvalov and M. I. Katsnelson, J. Phys.: Condens.
Matter21,344205(2009).
[19] T. Wehling, M. Katsnelson, and A. Lichtenstein,Chem. Phys.
Lett.476,125(2009).
[20] M. Z. Hossain, J. E. Johns, K. H. Bevan, H. J. Karmel, Y. T.
Liang, S. Yoshimoto, K. Mukai, T. Koitaya, J. Yoshinobu, M.
Kawai, A. M. Lear, L. L. Kesmodel, S. L. Tait, and M. C.
Hersam,Nat. Chem.4,305(2012).
[21] J. T. Robinson, J. S. Burgess, C. E. Junkermeier, S. C. Badescu, T. L. Reinecke, F. K. Perkins, M. K. Zalalutdniov, J. W. Baldwin, J. C. Culbertson, P. E. Sheehan, and E. S. Snow,Nano Lett.10, 3001(2010).
[22] H. Sahin, M. Topsakal, and S. Ciraci,Phys. Rev. B83,115432 (2011).
[23] E. J. Duplock, M. Scheffler, and P. J. D. Lindan,Phys. Rev. Lett.
92,225502(2004).
[24] D. W. Boukhvalov, M. I. Katsnelson, and A. I. Lichtenstein, Phys. Rev. B77,035427(2008).
[25] S. Ryu, M. Y. Han, J. Maultzsch, T. F. Heinz, P. Kim, M. L.
Steigerwald, and L. E. Brus,Nano Lett.8,4597(2008).
[26] D. Haberer, D. V. Vyalikh, S. Taioli, B. Dora, M. Farjam, J. Fink, D. Marchenko, T. Pichler, K. Ziegler, S. Simonucci, M. S. Dresselhaus, M. Knupfer, B. B¨uchner, A. Gr¨uneis, B. Bu, and A. Gru,Nano Lett.10,3360(2010).
[27] Z. Luo, J. Shang, S. Lim, D. Li, Q. Xiong, Z. Shen, J. Lin, and T. Yu,Appl. Phys. Lett.97,233111(2010).
[28] J. O. Sofo, A. S. Chaudhari, and G. D. Barber,Phys. Rev. B75, 153401(2007).
[29] D. C. Elias, R. R. Nair, T. M. G. Mohiuddin, S. V. Mozorov, P. Blake, M. P. Halsall, A. C. Ferrari, D. W. Boukhvalov, M. I.
Katsnelson, A. K. Geim, and K. S. Novoselov,Science323,610 (2009).
[30] J. Zhou, Q. Wang, Q. Sun, X. S. Chen, Y. Kawazoe, and P. Jena, Nano Lett.9,3867(2009).
[31] I. ˇZuti´c, J. Fabian, and S. Das Sarma,Rev. Mod. Phys.76,323 (2004).
[32] J. Fabian, A. Matos-Abiague, C. Ertler, P. Stano, and I. ˇZuti´c, Acta Phys. Slovaca57,565(2007).
[33] M. Gmitra, D. Kochan, and J. Fabian, Phys. Rev. Lett. 110, 246602(2013).
[34] O. V. Yazyev and L. Helm, Phys. Rev. B 75, 125408 (2007).
[35] O. V. Yazyev,Phys. Rev. Lett.101,037203(2008).
[36] O. V. Yazyev,Rep. Prog. Phys.73,056501(2010).
[37] Y. Wang, Y. Huang, Y. Song, X. Zhang, Y. Ma, J. Liang, and Y. Chen,Nano Lett.9,220(2009).
[38] K. M. McCreary, A. G. Swartz, W. Han, J. Fabian, and R. K.
Kawakami,Phys. Rev. Lett.109,186604(2012).
[39] A. N. Rudenko, F. J. Keil, M. I. Katsnelson, and A. I.
Lichtenstein,Phys. Rev. B88,081405(2013).
[40] V. P. Gusynin, S. G. Sharapov, and J. P. Carbotte, J. Phys.:
Condens. Matter19,026222(2007).
[41] J. M. Dawlaty, S. Shivaraman, J. Strait, and P. George,Appl.
Phys. Lett.93,131905(2008).
[42] K. F. Mak, M. Y. Sfeir, Y. Wu, C. H. Lui, J. A. Misewich, and T. F. Heinz,Phys. Rev. Lett.101,196405(2008).
[43] T. Stauber, N. M. R. Peres, and A. K. Geim,Phys. Rev. B78, 085432(2008).
[44] N. M. R. Peres, R. M. Ribeiro, and A. H. Castro Neto,Phys.
Rev. Lett.105,055501(2010).
[45] E. J. Nicol and J. P. Carbotte,Phys. Rev. B77,155409(2008).
[46] I. Crassee, J. Levallois, D. van der Marel, A. L. Walter, T. Seyller, and A. B. Kuzmenko,Phys. Rev. B84,035103(2011).
[47] A. B. Kuzmenko, E. van Heumen, F. Carbone, and D. van der Marel,Phys. Rev. Lett.100,117401(2008).
[48] P. E. Trevisanutto, M. Holzmann, M. Cˆot´e, and V. Olevano, Phys. Rev. B81,121405(2010).
[49] L. A. Falkovsky,Phys. Rev. B84,115414(2011).
[50] A. Ugawa, J. Hwang, H. Gommans, H. Tashiro, A. Rinzler, and D. Tanner,Curr. Appl. Phys.1,45(2001).
[51] P. C. Hohenberg and W. Kohn,Phys. Rev.136,B864(1964).
[52] W. Kohn and L. J. Sham,Phys. Rev.140,A1133(1965).
[53] S. Leb`egue, M. Klintenberg, O. Eriksson, and M. I. Katsnelson, Phys. Rev. B79,245117(2009).
[54] G. Fiori, S. Leb`egue, A. Betti, P. Michetti, M. Klintenberg, O.
Eriksson, and G. Iannaccone,Phys. Rev. B82,153404(2010).
[55] N. Kharche and S. K. Nayak,Nano Lett.11,5274(2011).
[56] P. Giannozzi, S. Baroni, N. Bonini, M. Calandra, R. Car, C. Cavazzoni, D. Ceresoli, G. L. Chiarotti, M. Cococcioni, I. Dabo, A. Dal Corso, S. de Gironcoli, S. Fabris, G. Fratesi, R. Gebauer, U. Gerstmann, C. Gougoussis, A. Kokalj, M.
Lazzeri, L. Martin-Samos, N. Marzari, F. Mauri, R. Mazzarello, S. Paolini, A. Pasquarello, L. Paulatto, C. Sbraccia, S. Scandolo, G. Sclauzero, A. P. Seitsonen, A. Smogunov, P. Umari, and R. M. Wentzcovitch, J. Phys.: Condens. Matter 21, 395502 (2009).
[57] D. Vanderbilt,Phys. Rev. B41,7892(1990).
[58] J. P. Perdew, K. Burke, and M. Ernzerhof,Phys. Rev. Lett.77, 3865(1996).
[59] R. P. Feynman,Phys. Rev.56,340(1939).
[60] P. Pulay,Mol. Phys.17,197(1969).
[61] H. J. Monkhorst and J. D. Pack,Phys. Rev. B13,5188(1976).
[62] O. K. Andersen,Phys. Rev. B12,3060(1975).
[63] P. Blaha, K. Schwarz, G. Madsen, D. Kvasnicka, and J. Luitz, WIEN2k, An Augmented Plane Wave Plus Local Orbitals Program for Calculating Crystal Properties(Vienna University of Technology, Austria, 2001).
[64] C. Ambrosch-Draxl and J. O. Sofo,Comput. Phys. Commun.
175,1(2006).
[65] P. E. Bl¨ochl, O. Jepsen, and O. K. Andersen,Phys. Rev. B49, 16223(1994).
[66] M. Dressel and G. Gr¨uner, Electrodynamics of Solids (Cambridge University Press, Cambridge, 2001).
[67] T. Ando, Y. Zheng, and H. Suzuura,J. Phys. Soc. Jpn.71,1318 (2002).
[68] V. P. Gusynin, S. G. Sharapov, and J. P. Carbotte,Phys. Rev.
Lett.96,256802(2006).
[69] L. A. Falkovsky and A. A. Varlamov,Eur. Phys. J. B56,281 (2007).
[70] R. R. Nair, P. Blake, A. N. Grigorenko, K. S. Novoselov, T. J.
Booth, T. Stauber, N. M. R. Peres, and A. K. Geim,Science320, 1308(2008).
[71] S. Casolo, E. Flage-Larsen, O. M. Løvvik, G. R. Darling, and G. F. Tantardini,Phys. Rev. B81,205412(2010).
[72] J. L. Cheng, C. Salazar, and J. E. Sipe,Phys. Rev. B88,045438 (2013).