© 1987 IUPAC
INTERNATIONAL UNION OF PURE AND APPLIED CHEMISTRY
MACROMOLECULAR DIVISION
COMMISSION ON POLYMER CHARACTERIZATION AND PROPERTIES
WORKING PARTY ON STRUCTURE AND PROPERTIES OF COMMERCIAL POLYMERS*
A COLLABORATIVE STUDY OF THE STABILITY OF EXTRUSION, MELT
SPINNING AND TUBULAR FILM EXTRUSION OF SOME HIGH-, LOW-
AND LINEAR-LOW DENSITY POLYETHYLENE SAMPLES
Prepared for publication by
JAMES L. WHITE and HIDEKI YAMANE Polymer Engineering Center, University of Akron
Akron, Ohio, USA
*Membership of the Working Party during the preparation of this report (1983—85)
wasas
follows:Chairman: H. H. Meyer (FRG); Secretary: D. R. Moore (UK); Members: G. Ajroldi (Italy);
R. C. Armstrong (USA); C. B. Bucknall (UK); J. M. Cann (UK); D. Constantin (France);
H. Coster (Netherlands); Van Dijk (Netherlands); M. Fleissner (FRG); H.-G. Fritz (FRG);
P. H. Geil (USA); A. Ghijsels (Netherlands); G. Goldbach (FRG); D. J. Groves (UK); H.
Janeschitz-Kriegl (Austria); P. B. Keating (Belgium); H. M. Laun (FRG); A. S. Lodge (USA);
C. Macosko (USA); J. Meissner (Switzerland); A. Michel (France); A. Plochocki (USA);
W. Retting (FRG); K. P. Richter (FRG); G. Schorsch (France); G. Schoukens (Belgium); J. C.
Seferis (USA); J. M. Starita (USA); G. Vassilatos (USA); 3. L. White (USA); H. H. Winter (USA); 3. Young (Netherlands); H. G. Zachmann (FRG).
Republication of this report is permitted without the need for formal IUPAC permission on condition that an acknowledgement, with full reference together with IUPAC copyright symbol (© 1987 IUPAC), is printed.
Publication of a translation into another language is subject to the additional condition of prior approval from the relevant IUPAC National Adhering Organization.
melt spinning and tubular film extrusion of some high-, low- and linear-low density polyethylene samples
Abstract
—A comparative study by several industrial and academic labor—atones of the shear and elongational rheologica behavior and unstable processing behavior of a series of well characterized linear and branched polyethylene is reported. The processing operations investigated were flcw through a die, melt spinning and tubular film extrusion. Broadening molecular weight distribution in the linear polyethylenes increased deviations from Newtonian flow, increased elastic memory and decreased filament stability in elongational flow. It also deteriorated melt spin—
ning stability but broadened the range of stable operation in tubular film extrusion. Extrudate distortion occurred at the same critical die wall shear stress, but the characteristics of the unstable region were changed. Long chain branched polyethylenes exhibited generally enhanced elastic memory, greater stability and deformation rate hardening in uniaxial extension. Melt spinning and tubular film extrusion character- istics were stabilized relative to linear polyethylenes, but extrudate distortion first occurred at a lower shear stress. The unstable extrusion characteristics were quite different from the linear polyethylenes. The linear low density polyethylene investigated generally responded similar- ly to a linear polyethylene of about the same molecular weight distri- bution.
INTRODUCTION
No commercial polymer is more important or has received the sane attention as polyethylene.
The
rheolcgical and melt processing behavior has been widely studied. Two previous major studies by
this IUPAC Working Party have characterized the rheological and film blowing characteristics of low density and high density polyethylene (ref. 1,2).The subject of instabilities is an important one to the polymer rheologist and process engi- neer. Four classes of instabilities have received considerable attention in the literature.
These are instabilities in simple uniaxial extension of molten filaments (ref. 3,5), break- down of stable drawdown of molten filaments/films during melt spinning of film casting
(ref. 6—13), instabilities in tubular films extrusion behavior (ref. 13—16) and unstable extrusion (ref. 17—23). All of these phenomena occur to varying extents in commercial polyethylenes (ref. 3, 4, 13—16, 18—23). However, the extent and character of each seems to vary
with the molecular weight, distribution of molecular weights and extent and types of long chain branching. While there have been individual studies of these instabilities,
little
effort has been made to make a joint study of then.In the present paper, we describe a joint study f the rheological properties and melt flow instabilities using a series of molecularly well characterized polyethylenes, of varying molecular weight distribution, and extent and type of branching. This report describes the contributions of thirteen European and North American Laboratories, of which nine were in- dustrial, three academic and one government. These organizations and the prionry investiga- tors are:
BASF AG Ludwigshaf en, West Germany (BASF) H.M. Laun Borg Warner Amsterdam, Netherlands (BW) H. Coster BP Chemicals Ltd. Grangenouth, UK (BP) S.T.E. Aldhouse CdF Chimie Bully des Mines, France (CdFC) U. Constantin
Eidgenossische Technische Hochschuie, Zurich, Switzerland (Em) J. Meissner Hoechst AG Hoechst, West Germany (Hoechst) M. Fleissner
ICI Wilton, UK (ICI) D.J. Groves
Industrial Materials Research Institute Boucherville,Montreal, Canada (IMRI) L.A. Utracki/P. Sammut
194
Koninklijke/Shell Laboratorium Amsterdam, Netherlands (Shell) A. Ghijsels Montepolimeri Bollate, Italy (M) G. Ajroldi
Rheometrics Inc. New Jersey, USA/Frankfort, West Germany (Rheo) J.M. Starita/C. Frank The Unviersity of Akron, Polymer Engineering Center, Akron, OH USA (APEC)
J.L. White! Y. Yamane
The University of Massachussets, Amherst, Mass., USA (UN) H.H. Winter
Materials
EXPERIMENTAL
A series of six polyethylenes were included in this study. This includes three high density polyethylenes (HDPE), two low density polyethylenes (LDPE) and a linear low density polyethy- lene (LLDPE). Two HOPE (HDPE—1, HDPE—2) were supplied by Hoechst and the third HDPE—3 by DuPont. The two LDPE were supplied by BP. The L—LDPE was supplied by CdF Chimie. The characteristics of these polymers are summarized in Table 1. According to Hoechst, HDPE—1 and HDPE—2 contain some butene—1 as a comonomer.
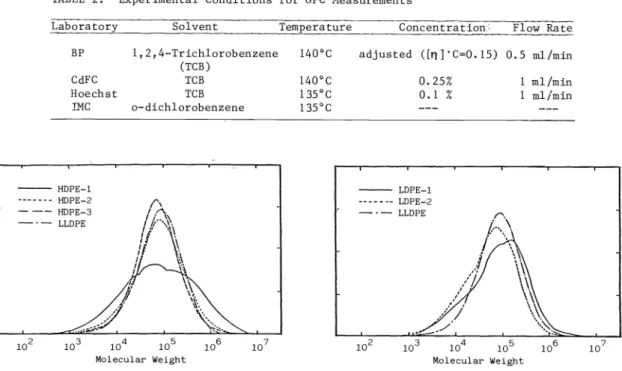
Molecular weight distribution of the samples were determined by BP, CdFC, Hoechst and Insti- tute of Macromolecular Chemistry (IMC) of the Czechoslovak Academy of Science (IUPAC Sub- group IV—2.1.2) using gel permeation chronatography. The experimental conditions of GPC measurements are shown in Table 2. CdFC GPC traces for the polymers studied are contained
in Fig. 1. The GPC was calibrated by polyethylene and polystyrene standards using Universal
TABLE 1. Characteristics of Polyethylenes Investigated
Symbol Manufactured
Density (g/cm3)
(BASF) Melt Index
HDPE—1 Hoechst 0.944—0.946 0.06
HDPE—2 Hoechst 0.939—0.942 0.45
HDPE—3 DuPont 0.950—0.953
LLDPE CdF Chimie 0.917—0.918 1.0
LDPE—1 BP 0.921 0.2
LDPE—2 BP 0.920—0.921 2.0
TABLE 2. Experimental Conditions for GPC Measurements
Laboratory Solvent Temperature Concentration Flow Rate HP 1,2,4—Trichlorobenzene
(TCB)
140°C adjusted
-
([JC=O.15)
0.5 ml/minCdFC TCB 140°C 0.25% 1 ml/min
Hoechst TCB 135°C 0.1 % 1 ml/min
INC o—dichlorobenzene 135°C ——— ———
Fig. 1. GPC traces for polyethylemes
io2
lO
io6lO
MolecularWeight Molecular Weight
Calibration
Curves. INC made branching corrections for LDPE samples. The results are summarized in Table 3. The weight average molecular weights M of linear polyethylenes orders as:HDPE—1 >> HDPE—2 > LLDPE >HDPE—3 (BP) HDPE—1 >>HDPE—2 > LLDPE >HDPE—3 (CdFC) HDPE—1 >> HDPE—2 >> LLDPE > HDPE-3 (Hoechst) HDPE—1 >> LLDPE > HDPE—2 > HDPE (IMC) N
w n
/M order as:HDPE—1 >> HDPE—2 >HDPE—3 ... LLDPE (BP) HDPE—1 >> HDPE—2 > LLDPE > HDPE—3 (CdFC) HDPE—1 >> HDPE—2 >>LLDPE . HDPE-3 (Hoechst) HDPE—1 >> HDPE—2 > LLDPE > HDPE—3 (IMC)
where the double inequality in all cases indicates a factor of about two or more. HDPE—i has a large high molecular weight tail, and HDPE—2 a more modest one.
Intrinsic viscosities, En] were obtained on all of the polyethylene samples in decahydronaph—
thalene at 130°C (IMC). The [ii] were converted to viscosity average molecular weight using the expression
[i]
= 4.60
x i02 .M°73
(1)The crystallinities of the samples have been estimated by Hoechst from infra red. The re- sults are summarized in Table 4. The HDPE—2 has a crystalline fraction of 0.63 as opposed to the 0.67 value of HDPE—1 and HDPE—3. The LLDPE and LDPE—2 have values of 0.45, while LDPE—1 has the lowest value of 0.43.
Hoechst characterized branching in the polyethylenes using infra red absorption and BP car- ried out similar investigations with C 13 nuclear magnetic resonance. The results are con- tained in Tables 5 and 6. These generally show that the HDPE—3 has the lowest level of branching. The HDPE—1 and HDPE-2 have some ethyl branches as expected. The LLDPE has very significant levels of ethyl branches, an order of magnitude or higher levels than HDPE—1 or HDPE—2. The LDPE—1 and LDPE—2 have levels of total CH3 about the same as LLDPE but the dis- tribution of branch lengths is greater. The difference in branching of the LDPE—1 and LDPE—
2 are not clear.
Shear
flow
Rheological characterization
The rheological properties of the polymer melts have been characterized using different ex- perimental techniques. Measurements of the shear viscosity were carried out variously in
cone—plate and capillary rheometers. Rheo and APEC measured the viscosity as a function of shear rate in a Rheometrics System 4 and a Mechanical Spectrometer at 190°C. The measure- ments by APEC were carried on an instrument in the laboratories of Rheometrics. BP made measurements in a Rheometrics System 4 at 180° C. BW made studies in a Weissenberg Rheo—
gonioneter at 170°C. Capillary rheometer experiments to determine viscosity were reported by BASF, CdFC, Hoechst, ICI, IMRI, and APEC at 190°C.
Principal normal stress difference N1 measurements were made using a cone—plate geometry by BP and Rheo.
Linear viscoelastic oscillatory measurements
Measurements of dynamic viscosity r' (w) and storage modulus C' (w) were made by BW, CdFC, IMRI and Rheo at 190°C as well as by BW at 170°C and by Rheo at 150°C. The instruments used were a Pheo.metrics Dynamic Spectrometer with a pair of parallel plate of 1.25 cm in diameter and a Weissenberg Rheogoniometer with cone—plate mode (BW), a Contraves Kepes Balance Rheo—
meter (CdFC), a Rheometrics Mechanical Spectrometer (IMRI) and a Rheometrics System 4 (Rheo).
Stress relaxation measurements following shear flow were made by BW at 170°C using an R18 Weissenberg Rheogoniometer and at 190°C following sudden strain with a Rheometrics Dynamic Spectrometer.
Elongational flow experiments
Uniaxial
extension experiments were carried out in several laboratories including BASF, Hoechst, IMRI, Rheo, Shell and APEC. The appartus and experiments are described below.BASF made measurements at constant deformation rate in an elongational rheometer at 150°C.
TABLE
3. Molecular weight distributions based on GPC and 1111
of Branching by BP
LongerPentyl than C6
1000c 1000C
Placerial M xfl M x 1O30
N x
VIO N x IO
Z N /NWtI N /5ZW(J ]boratoty
HDPE—1 13
—
332—
26— —
EP20
—
315 1550 18 4.9—
CdFC15 291 501
—
34—
3.35 HoechstII
—
274 (420) 25—
2.58 INCHDPE—2 19
—
145—
7.7— —
BP29
—
169 713 7.5 4.2—
CdFC20 160 251
—
12—
2.5 Hoechst18 119 (235) 6.6
—
2.03 INCHDPE—3 26
—
91—
3.6— —
B?38
—
129 415 3.4 3.2 CdFC29 77 91
—
3.1—
1.95 Hcechst16
—
60 (95)—
5.0—
1.46 INCLLDPE 33
—
113—
3.4— —
BP36
—
143 356 3.9 2.5—
CdFC34 94 110
—
3.2—
1.67 Hoechst20 124 (127) 6.2
— —
INCLDPE—1 17 123 7.6
—
B?25 190 836
—
CdFC——
— — — —
1.30 doechs_12 395 (560) 33 1.11 I}C
LDPE—2 77
114
305 (219) 15
11
TABLE 4. Estimates of Crystallinity by Hoechst
B?
CdFC Hoechst
1)10
—
5.0— —
431 5.2
3.3 —
— — 1.05
23
—
0.39TABLE 5. Infra Red Analysis of Branching of Hoechst Sample Crystallinity
HDPE—1 0.67
HDPE—2 0.63
HDPE—3 0.67
LLDPE 0.45
LDPE—1 0.43
LDPE—2 0.45
Sample
Total
1000C CH3 Ethyl I000C
HDPE—1 3.4
1.2
HDPE—2 3.2 1.6
HDPE—3 <2
<0.2
LLDPE 21.6 13.6
LDPE—1 25.0 6.5
LDPE—2 26.5 5.1
TABLE 6. C 13 Nuclear Magnetic Resonance Analysis
Sample
Methyl 1000C
Ethyl 1000C
1,3-Diethyl 1000C
Butyl 1000C
HDPE— 1 —— —— ——— —— —— 2.2
HDPE—2 —— —— ——— —— —— 1. 1
HDPE—3
LLDPE —— 18.0 1.5 —— —— 1.3
LDPE—1 4.2 1.4 0.5 7.4 2.5 3.1
LDPE—2 0.7 5.0 0.9 6.0 2.2 3.2
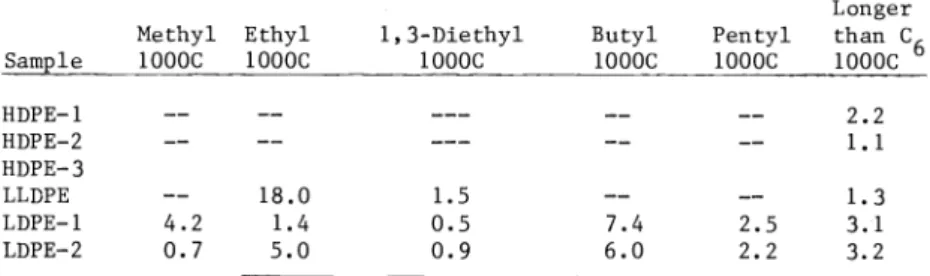
The rod—like sample was prepared by extrusion. It was floated on silicone oil in a bath with electrically heated walls. Fig. 2 shows a schematic drawing of the rheometer. It has been described by Laun and Nunstedt (ref. 24). A pair of toothed wheels (W) is used to stretch the sample (S) and the other end of the sample is glued to a metal strip (N) that is con- nected to the leaf spring of a force transducer. To check homogeneity of sample deformation and to determine the recoverable strain, the sample is cut by means of scissors after a given total strain. Local control of the apparatus was used and a constant Hencky strain rate imposed by a constant rotary speed of the servo motor.
Hoechst, INRI, Rheo and Shell made experiments with a Rheometrics Extensional Rheometer (see Fig. 3). The specimens to be stretched in this experiment are prepared by compression mold- ing. The measurements of Hoechst and Rheo were at 150°C, those of Shell at 190°C.
APEC made experiments on an apparatus newly developed by H. Yamane in its laboratories (see Fig. 4). It is similar in design to the BASF instrument described above and is based on ipgrading of an instrument originally described by Yamane and White (ref. 25). The speci- mens were prepared by extrusion.
ICI measured elongational viscosities using die entrance pressure drops. These were comput- ed using
the theory of Cogswell (ref. 26).
Equal biaxial extension measurements followed by stress relaxation were a Rheometrics RDS—LA rheometer using lubricated squeezing silicone oils Viscasil) were used as the lubricants. This is illustrated in Fig. 5.
carried out by UN in (General Electric
Fig. 4. APEC elongational flow rheometer Fig. 5. UM lubricated squeezing flow experiments
Fig. 2. Elongational flow apparatus of BASF Fig. 3. Rheometrics extensional rheometer
Melt spinning (Fig. 6)
Melt spinning experiments were carried out by BP, mental procedures are described below.
CdFC, Hoechst, Shell and APEC. The exper—
BP used El Goettfert Rheotens apparatus which measures the take—up velocity, vL and spin—
line tension F. The melt temperature was 180°C. The spinline was not thermostatted.
The spinline length from the die face to the axes of the3take—up rollers was 121 mm.
Tests were conducted at output rates from 130 to 530 mm. /sec. The take—up speed was chang—
ed continually. The rate of change of take—up was kept low and did not affect the results.
CdFC used a Tcyoseiki melt tension tester, which is a ram extruder with a tension measuring take—up device. A die of diameter 2 mm. and L/D ratio of 4 was used. The melt temperature was 190°C. 3The spinlinc which was not thermostatted had a length 250 mm. The extrusion rate was 11.8 mm /sec. Experiments were carried out at constant take—up speed which was thea in—
creased by step.
Shell carried out melt spinning experiments with a Goettfert single screw laboratory extrud—
er with a screw diameter of 20 mm and length of 40 mm. A capillary die of diameter 3 mm.
L/D of 10 and 900 entrance angle was used. The melt temperature was 190°C. Most experiments were carried out under non—isothermal conditions (cooling of extrudate y ambient air). The spinline length was 180 cm. and the mass flow rate 10 g/min. (219.3 mm /sec). The filaments were drawndown using a Goettfert Rheotens. One series of experemnts was carried out with
steadily increasing take—up velocity (acceleration = 1.2 mm/sec ). Another series was per- formed at constant take—up speed conditions so as to measure the extent of draw resonance under steady conditions. These experiments were started at low speeds which was then in- creased in steps into the region where draw resonance occurs. At each take—up speed, the diameter of the spinline at the position of the take—up wheels was continuously measured by an optical laser technique. Both the amplitude and the periodicity of the instabilities were taken from these diameter data when a steady state pulsation of the diameter was obtained.
APEC carried out melt spinning experiments with an Instron Capillary Rheometer. A capillary die of diameter 0.147 cm and L/D of 28 was used for non—isothermal melt spinning, and another die of diameter
0.107
cm and L/d of 29 was used for isothermal runs. For isothermal melt spinning,an isothermal chamber was attached to the bottom of the barrel of the Instron Capillary
Rheometer to keep the temperature of the spinline air the same as polymer melt temperature (Fig. 4). The distance between the die exit to the surface of the quench water were 7 cmn he isothermal caseand 2.5 cm in the non—isothermal case. The flow rates were 9.05
x 10 cm /sec. for both cases.Tubularfilm extrusion
Tubular film extrusion experinents were carried out by APEC. A inch Killion Screw Extrud—
er with tubular die and frame was used. An annular die of outer radius 3.175 cm. and gap of 0.1 cm. was used. An extrusion rate of 1500 cm /hr was used in all of the experiments. The melt temperature in the die was held as close to 190°C as possible. This is illustrated in Fig. 7.
Extrusion
instabilitiesExtrusion
instabilities, notably extrudate distortion have been investigated by BASF, CdFC, ETh, N and APEC. BASF, ETH and N used Goettfert a Rheograph 2000 which has a barrel diameter of 3/8 inch. A Dynisco pressure transducer was placed at the capillary inlet. BASF used circular dies of diameter 0.5 mm to 2.5 mm and L/D ratio of 30. M used two dies with dia- meter 1 mm and L/D ratio of 0 and 30. APEC used a Monsanto Processability Tester with adie of diameter 0.762 mm and L/D = 30. CdFC and Brabender extrusiograph screw extruder with dies of diameter 1.02 to 3 mm.
Die
Nip Rolls
Collapsing I
Take-up System
Fig.
7. Tubular blown film extrusion Fig. 6. Melt spinning experiments experiments of' APECSHEAR VISCOSITY MEASUREMENTS Results
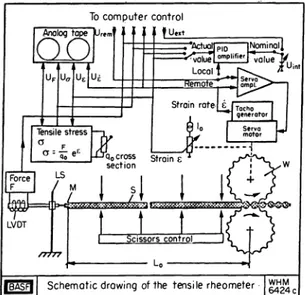
Many Laboratories (CdFC, NP, Rheo, APEC) reported shear viscosity data at 190°C. These are summarized in Figure 8 together with data of BP determined at 180°C. The data have great qualitative similarities. The viscosity for all of the polyethylenes exhibits a plateau of low shear rates and then decreases with increasing rates of shear. The magnitudes of the plateau and1rates of decrease change from material to material. The data at a shear rate of 10 sec order as
HDPE—1 > LDPE—1 > HDPE—2 > LLDPE > LDPE 2 > HDPE 3 At a shear rate of 100 sec', the curves have re—ordered with
HDPE—1 HDPE—2 - LLDPE > LDPE-1 HDPE 3 > LDPE—2
There
are
differences in the data from the individual laboratories. Generally the results of BP tend to be higher and CdFC lower in the low shear rate region. This should not be unexp-ected of the BP data as the measurements were performed at 180°C.
Interpretation
The viscosity function is well known to be related to molecular weight and its distribution (ref. 5, 25, 27, 28). In Table 7, we summarize zero shear viscosity of the polyethylenes studied as a fraction as function of weight average molecular weight. It may be seen that the values of n for the LDPEs fall below the HDPEs and LLDPEs at specific M . The data on
the latter two olymers are roughly consistent. This effect has been ioted °y earlier in- vestigators (ref. 2, 30) studying the zero shear viscosities of linear and branched poly- ethylene s.
TABLE 7. Zero shear viscosities as a function of weight average molecular weight from polyethylenes studies
M x
Polymer CdFC Hoechst
no x 10
(Pa S)
HOPE—i 315 501 >60
HDPE—2 169 251 3.97
HDPE—3 129 91 0.41
LLDPE 143 110 1.16
LDPE—1 190 ——— 9.70
LDPE—2 114 ——— 0.93
Fig. 8. Shear viscosity qof polyethylenes as a function of shear rate at 190 C
The shear rate dependence of the viscosity frunction is widely considered to be related to the breadth of the molecular weight distribution in linear polymer system. In Figure 9, we construct a Vinogradov—Nalkin plot (ref. 28) of n/n0 vs. for the HDPE—1 HDPE—2, and the IIDPE—3. The LLDPE which is also a linear polymer is included. Generally the rate of 'fall off'
of the data orders as
HOPE—i > HDPE—2 >HDPE-3 - LLDPE
which
corresponds to the
breadth of the molecular weight distribution. The data may be com-pared
with earlier correlations of this type by Yamane, Ninoshima and White (ref. 13, 25).A similar n/n0 plot
for
the LLDPE, LDPE—i and LDPE—2 is given in Fig. 10.10
k
io2
(s')
1.0
Results
io2 io3 io4 io5 io6
Fig.
10. Reduced viscosity l7/iasa
functionof for LDPE—1, LDPE—2 and LLDPE (CdFC)
PRINCIPAL NORMAL STRESS DIFFERENCE MEASUREMENTS
The principal normal stress differences N1 of the melts were reported by Rheo and BP. Rheo's measurements are presented in Fig. 11 as a function of shear stress. This type of plot has been found by earlier researchers (ref. 5, 29, 30) to be independent of temperature and sen- sitive to molecular weight distribution. As shown by Coleman and Markovitz (31) at low shear stresses N1 is related to shear stress as
N 2
1
e 12
Estimated values of J are summarized in Table 8. The data order as e
LDPE—1 > LDPE—2 > HDPE-2 > LLDPE > HDPE—1
(2)
The results cf BP were obtained on a parallel plate instrument. iJ, the principal normal stress difference coefficient was estimated. This was converted to J and the values are also summarized in Table 8. BP could not obtain steady state data 0meHDPE_1 or LDPE—1. The J data order as
e
LDPE—2 > HDPE—2 > LLDPE > HDPE-3
The Rheo and BP data are qualitatively consistent but differ quantitatively.
At high shear gap.
rates instabilities develop in this instrument and the melt emerges from the
S
z
io3
io2
io2 (Pa) 10
o12
Fig. 11. Principal normal stress difference N, as a function of shear stress 12 for polyethylenes (Rheo)
TABLE 8. Steady State Compliance and Relaxation Time for Polyethylene Samples (BP, Rheo)
Material
J (Pa) x 10 e (BP) Normal Stress
J (Pa) x 10
e (nh)
Normal Stress
Je(Pa) x 10 (Bheo) Dynamic
T (sec)
Rheo
}IDPE—1 ——— 0.22 0.9 40.5
HDPE—2 0.299 0.96 1.5 6.0
HDPE—3 0. 132 ——— ——— ———
LLDPE 0.283 0.54 1.1 1.06
LDPE—1 ——— 1.7 1.6 14.4
LDPE—2 0.719 0.99 2.1 1.85
LLDPE HDPE—3 HDPE—2 HDPE—l
1.0
LLDPE LDPE—2 LDPE—l
io1 102 1O3 1O4
l0
106 101Th,y(Pa)
Fig. 9. Reduced viscosity /ias a function of i''
for
HDPE—l, HDPE—2, HDPE—3 and LLDPE (CdFC)I I I
HDPE—l
(190°C)
LLDPE (150°c)
Discussion
R1-ieo's
data indicate that the steady state compliance and memory of LDPE—1 is greater than that of the other melts. The values for LDPE—2 are second in magnitude. From BP the
HDPE—3has the lowest J
followed by LLDPE. This indicates the highest
values are for the long chain branched polyethylenes and the narrow molecular weight distribution linear polymers possess the 'owest values. This is similar to earlier results for polyolef ins (ref. 11—13, 16). The low value ofJ
for the broad distribution HDPE—1 is surprising.The mean relaxation time r was determined by Rheo from JI1
eo =T
This
is summarized in Table 8. The data order asResults
HDPE-1 > LDPE-1 > HDPE—2 > LDPE-2 > LLDPE
LINEAR
VISCOELASTIC MEASUREMENTS(3)
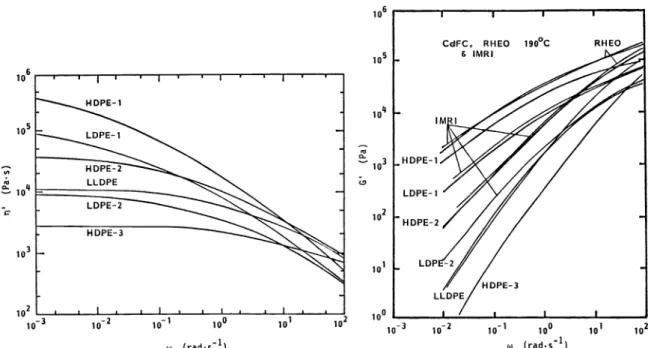
Dynamic viscosity n'(w) and storage modulus G'(w) data have been reported by BW, CdFC, IMRI and Rheo as a function of frequency. i' (w) and G' (w) are plotted as a function of frequency in Fig. 12 and 13. The complex viscosity n° defined by
* =J')
+ (G'/w)2(4)
is plotted as a function of frequency in Fig. 14 for experiments carried out at 190°C. At loW frequencies, the ii' and n* data order as
IIT)PE—1 > LDPE—1 > HDPE—2 > L—LDPE >LDPE—2 > HDPE—3 At a frequency of 100 sec1, the n*(w) data order as
HDPE—2 > L—LDPE > HDPE—1 > HDPE—3 > LDPE—1 > LDPE-2 BW also presents data at 170°C which order in the same manner.
The storage modulus G' data at 190°C is presented The
data order as
in Fig. 13 at a frequency of 10'sec'.
HDPE-1 > LDPE—1 > HDPE—2 > L—LDPE > LDPE 2 > HDPE—3
Fig. 12. Dynamic viscosity 'rj(w) at 190°C for polyethylene melts as a function of
frequency w (CdFC)
Fig. 13. Storage modulus G'(w) at 190°C for polyethylene melts as a function of frequency u (Rheo, CdFC and IMRI)
1 o6
101
w (rads1)
100
1 0 2
10-1 100 101 io2
w (rad.s1)
Discussion
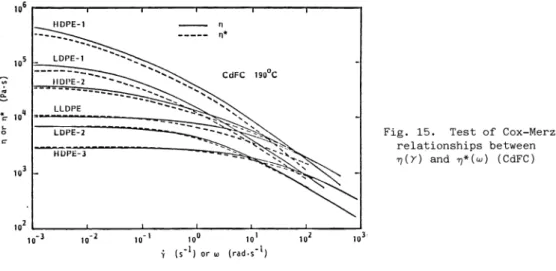
Fig. 15. Test of Cox—Merz relationships between 'r(y) and *(w) (CdFC)
The Cox—Merz (ref. 32) empirical relationship connecting the complex viscosity n'(w) and the shear viscosity n(') appears to work rather well at lower shear rates especially if the data of the same laboratory. e.g. CdFC, is used for each function. A comparison is made in Fig.
15. At higher shenr rates deviations are observed esnecially for the LLDPE.
was computed from G' (w) and n' (w) by Rheo through the approximate relationship
The results are summarized in Table 8. The results order as LDPE—2 > LDPE—1 > HDPE—2 > LLDPE > HDPE—1
which agree roughly qualitatively with those of the Rheo normal stress results but not in ab- solute magnitudes. The long chain branched LDPEs have the highest e and the narrow molecul- ar weight distributions linear polyethylenes the lowest.
io6
10
u (tad/a)
Fig. 14. Comples viscosity
of
polyethylene melts as a function of frequency w. (CdFC and BW)10°
io2
100 101
- (sd)or w (rad.s1)
G' e
(wn ) w = 0.1
sec'
(5)Results
UNIAXIAL ELONGATIONAL FLOW
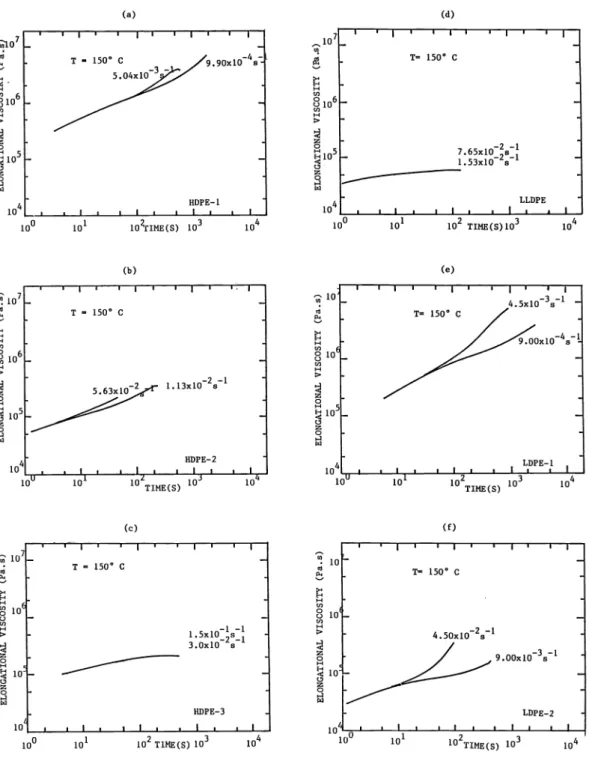
Elongational flow characteristics of the various melts studied have been reported by BASF, Hoechst, IMRI, Rheo, Shell and APEC. BASF using a rheometer built in their laboratories presents steady state elongational viscosities determined by BASF are plotted in Fig. 16.
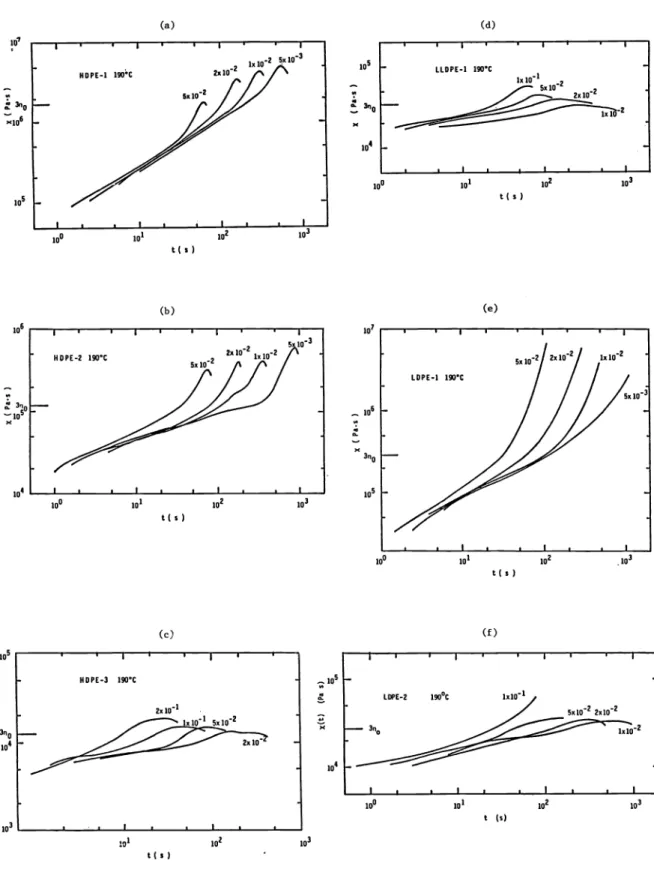
APEC carried out the elongational flow experiments on their apparatus (Fig. 4) at 190°C.
Their results are shown in Figure 17.
c1o7 a
io6
z0
11
010
a0 10
(a)
io0 101 iOrIME(S)
(b)
'
I I IT150°C
1.13x10²s'
}IDPE-2
I I
I
I10U 101 1OLTIME(S) 10 10
(c) 10
a
H
0 10
H
a0
10
10
io0 101 io2 TiME(S)
io6 H
10
100
10 a
810H
a0 H 5
10 Is
1
a
H0
0
Ha0 H
IS
(d)
101 io2TIME(S)
(e)
Fig. 16. Transient elongational viscosity X(t) for polyethylene melts as a function of time t at 150°C (BASF)
a) HDPE—l b) HDPE—2 c) HDPE—3 d) LLDPE e) LDPE—l f) LDPE—2
HDPE—1
T=150'C
7.65x10²s 1.53x10 2 1
LLDPE
I . I .
.
T= 150° C
—3 —1 4.5x10 a
10'
LOPE—i 10 TIME(S) 10
(f)
T = 150° C
—1 —1
1 .5x102s1 3.OxlO
IIDPE—3
iI
..1
3n
(a)
(b)
100 101 io2
t(
s )(c)
(d)
- 101
-
io2
t( s
)(e)
'Ii
101
t( $)
(f)
t (s)
t(s)
io2Fig.
17. Transient elongational viscosity X(t) for polyethylene melts as a function of time t at 190°C (APEC)a) HDPE—l b) HDPE—2 c) HDPE—3 d) LLDPE e) LDPE—l f) LDPE—2 o1
,cio6
10 LLDPE-1 190'C
110
22x102
100
t( $ )
io6
HDPE-2 190C
•—10
lx
1o6
3n
I I
I
I ILOPE-i 190C
5x10³
I •
10 io2
HOPE—3 190°C
2x101
I I I I
J1:11x1:1
100 io2
Elongational
flow data on a Rheometrics Extensional Rheometer are given by Hoechst, IRNI, Rheo and Shell. Typical data of Hoechst at 150°C and INRI (150°C, 190°C) nrc shown in Fig.18 and Fig. 19.
The materials respond as three different groups. The HDPE—3 and LLDPE show slow buildups of elongational viscosity to a steady state value. Their steady state elongational viscosities are essentially Newtonian being equal to 3n. The LDPE—1 and LDFE—2 especially the former are strain hardening. The broader molecular weight distribution HDPE—1 and HDPE—2 do not appear to achieve steady states.
The elongations to break from the Shell and APEC data are listed in Table 9. The values for HDPE—1 and HDPE—2 are lower than for the other melts.
ICI concluded using entrance pressure losses that HOPE—i, HDPE—2, HDPE—3 and LLDPE all ex- hibited decreasing elongational viscosities.
Discussion
It
seems clear that the LOPE—i and LDPE—2 are strain hardehing and show increasing elong—ational viscosities while HDPE—3 and LLDPE are nearly linear viscoelastic. The LOPE—i and LDPE—2 are the most stable filaments and the HDPE—1 and HDPE—2 seem the most unstable in uniaxial elongational flow. This in agreement with early studies for similar materials (ref. 13, 16) and studies for the polyolefins (ref. 11,12)
Fig. 18. Transient elongational viscosity X(t) for polyethylene melts as a function
of time at 150°C on Rheometrics Extensional Rheometer (Hoechst)
Fig. 19. Transient elongational viscosity X(t) for polyethylene melts as a function of time t at 150°C and 190°C IMRI
(a)
HDPE—2
0C-,
z
"3
I1O 1O
10°TIME(a)
(b)
10 10 1
TIME(s)
io_2
lo o io
TIME(s)
TABLE 9.
Hencky Strains to Failure of Polyethylene Filaments
Polymers Stretch Rate (sec1) Shell APEC
HDPE—1 0.005
0.01 0.02 0.05 0.25
0.50
1.00
2.5 2.5
1.55
3.4 3.0 2.9 3.0
HDPE—2 0.005
0.01 0.02 0.05 0.25 0.50 1.00
1.2 1.6 1.6
5.3 3.7 3.8 4.0
HDPE—3 0.02
0.05 0.10 0.20 0.25 0.50 1.00
>3
>3
>3
8.0 7.9 8.2 8.3
MULTIAXIAL ELONGATIONAL FLOW
Polymers Stretch Rate (sec1) Shell APEC
LLDPE 0.01
0.02 0.05
0.10
0.25 0.50 1.00
>3
>3
>3
7.9 7.4 7.5
7.4
LDPE—1 0.005
0.01
0.02
0.05 0.25 0.50 1.00
>3
>3
>3
6.6 6.0
5.7
5.6
9.5
8.7 8.2
7..6
LDPE—2 0.01
0.02 0.05 0.10 0.25 0.50 1.00
>3
>3
>3
The six polyethylene samples were strained to varying amounts H/il of 0.6 and 0.2 and the relaxation rates followed. Typical results are shown in Fig. 20. Generally the high density polyethylenes show greater strain dependence of the stresses (noduli). Relaxation times were determined from the data. These are summarized in Table 10. They order as
HDPE—1 > HDPE-2 > HDPE—3 (190°C) LDPE—1 > LDPE—2 > LLDPE (150°C)
TABLE 10. Relaxation Times from Biaxial Elongation flow Experiment of UM
Material Temperature (°C) TB (sec)at Eb = 0.26
HDPE—1 190°
59.3
HDPE—2 190° 22.3
HDPE—3 190° 3.26
LLDPE 150° 10.2
LDPE—1 150° 52.0
LDPE—2 1500
23.3
log It Is) I
Extensional relaxation modulus of LDPE—2 0.25, 0.62, 0.84
—2 —1
log It sI
Extensional relaxation modulus of HDPE—2 Rb00.27, 0.63, 0.86
0
9.5
9.0
3.5
5.0
a-
9.0
3.5
0 1 2
Fig. 20. Typical results of biaxial elongational flow and relaxation (UM)
Results
MELT SPINNING
The melt spinning of the various polymers included in this study have been investigated by BP, CdFC, Hoechst, Shell and APEC. The studies of BP and CdFC concentrate on stable melt spinning behavior.
First we will summarize the research results on Shell. In Fig. 21, we plot spinline tension as a function of drawdown ratio. It can be seen that the tension at low drawdown ratios VL/
V0 exhibits small diameter fluctuations. At a roughly critical value of VL/Vn the ampli- tudes become much larger in magnitude. The actual amplitude of the diameter fluctuations is plotted in Fig. 22. The growth in amplitude is sudden and large in magnitude. The critical values are summarized in Table 11. The materials studied order in terms of increasing stab-
ility
LDPE—2 > HDPE—3 > LDPE-1 > LLDPE > HDPE-2 > HDPE-1
The diameter oscillations are periodic in character. The resonance period and wavelength are summarized in Table 12. The resonance period is independent of drawdown ratio and orders as
HDPE—2 > LLDPE — HDPE-3 > HDPE—1 > LDPE-1 LPDE-2
The experimental results of APEC generally correspond to those of Shell. The ordering of the stability differs with respect to HDPE—3, LLDPE and LDPE—1. The specific numbers are tabul- ated in Table 13. Another difference is that APEC finds that LDPE—2, the most stable mater- ial, much more resistant to draw resonance than Shell. Summarizing,
LDPE—2 > LDPE—1 > LLDPE > HDPE—3 > HDPE—2 > IIDPE—1
Hoechst and Shell drawdown the filamentci in the spinline until the filaments break. The spinline rupture deta is summarized in Table 13. The extensibility to rupture orders as:
LDPE—2 > HDPE3 > LPPE—1 > LLDFE > hDPE-2 > HDPE-1
3
C E2 6
0 2 4 6
Draw Down Ratio
10 12
Fig. 21. Spinline tension as a function Fig. 22. Amplitude of diameter fluctuations of drawdown ratio (Shell) as a function of drawdown ratio (Shell)
I
I
LLDPE
HDPE—1 HDPE-2
HDPE-3
IIi
DRAW RATIO. V/V0
RHEOTENS DIAGRAMS Draw Down Ratio
TABLE 11. Critical Drawdown Ratios for onset of Draw Resonance
Material Shell APEC
HOPE—i 5.6 4.9
HDPE—2 6.8 6.7
HDPE—3 10.5 10.9
LLDPE 9.3 11.7
LOPE—i 11.2 15.1
LDPE—2 23.2 45.0
TABLE 13. Spinline Rupture Data
Material
S c (MPa)
hell VL /V0
Hoechst VLAo
HOPE—i 0.38 7.0 6.4
HDPE—2 0.30 8.5 8.5
HDPE—3 0.14 14.6
LLDPE 0.24 12.0 11.8
LOPE—i 0.70 13.3 13.2
LDPE 2 0.60 26.4 >26.3
Discussion
TABLE i2. Periodicity of Draw Resonance (Shell)
Material
DrawRatio.
LO
Resonance
period.
(s)
Resonance wavelength
(cm)
HOPE—i
5.6
5.8
3.7 3.7
64 66
HDPE—2 5.8
6.2 6.6 6.8
4.5 4.6 4.7 4.8
81 88 95 iOO
7.0
4.9
106HDPE—3 10.7 11.1
u.S
ii.7
4.3 4.3 4.4 4.5
142 147 156 162
L—LDPE
9.3
9.5 9.7 9.9 10.1
4.3 4.3 4.3 4.3
4.35123 126 128 132 136
LOPE—i
8.5
11.2 11.7 12.0 12.6
2.45
2.6 2.6
2.652.6
65 91 95 99 101
LDPE—2 23.2
24.2 25.2
2.5 2.45 2.5
182 — 185 197
The results of the melt spinning experiments show the LOPE—i and LDPE—2 to exhibit the most stable spinlines and the HOPE—i and HDPE—2 the least stable. The LDPE—2 is the most strik- ingly stable of all the materials investigated. The HDPE—3 and LLDPE are intermediate in their behavior.
Clearly the observations of the linear polymers indicate that spinline stability correlates with narrowness of molecular weight distribution. This agrees with the previous results of the Shell (Ref. 10) and APEC (Ref. 11,12) research teams on polypropylene. The long chain branched LOPEs are more stable than the linear polymers in agreement with our earlier study of polyesters (ref. 30). Minoshima (13) has reached similar conclusion to those cited above using a different set of linear branched (LDPE and LLDPE) polyethylenes.
Results
TUBULAR FILM EXTRUSION
The stability of the tubular film process for the five polyethylenes was investigated by APEC. Following the procedure of Kanai and White (Ref. 16) and Minoshima (ref. 13) the
regions of instability and stability are represented in a three dimensional space of draw—
down ratio (VL/Vo), blowup ratio (R/R0), and frostline height (z ). These three variables represent the kinematics of deformation of the bubble. In Fig. 23 a—f we display constant frostline height planes showing, regions of stability and instability. It would appear that two different types of instability are observed. At a blowup ratio 1.0 and at a high (blow- up ratio) x (draw down ratio) one finds the draw resonance type instability of Han and Park.
At high blowup ratios one finds a bent and/or helically shaped bubble of the type described by Kanai and White (Ref. 16) and Minoshima (ref. 13).
It may be seen that HDPE—3 is the most unstable of all of the polymers. It has indeed no stable operating region. The LLDPE is only slightly better. The LOPE—i, LDPE—2, HDPE—i and HDPE—2 have much broader regions of operating stability. Summarizing stability roughly orders as
Discussion
LDPE—i > LDPE—2 > HDPE-1 > HDPE-2 > LLDPE > HDPE—3
The studies described above clearly indicate that LOPE—i and LDPE—2 exhibit the most stable behavior. The HDPE—3 and LLDPE are the most unstable. The behavior is basically the same as that observed by Minoshima (ref. 13) on other polyethylene samples and similar to that of Kanai and White (ref. 16). The long chain branched LOPE polymers are the most stable follow- ed by the broad molecular weight distribution HDPE. The narrow distribution HOPE and LLOPE are the most unstable.
000010 F 0 0 0 0 0 0
Joo 0 0 0 0 0 0
0 0 0 0 0 0 10 0 0 0 0 0 0 0 7oo 0 0 0 o 0 0
00000000
0 0
•
10 0 0 • •
0 0 0 0 0 0 0 0 0 0
o 0 0 0 0 0 0 o
000000000
9 0 00
0• •
I\\\
E?00,000
0 0 0 0 0 0 0 0 0
•
100000000
Joo 0 0 0 0 0 0
• loo0000000
1° 0 0 0 0 0 0 0
• 00 0 0,0 0 0 o0
A/lA
0 0 0 0 0 0 0 0 0 0 0
0000000 000000000
o 0 o•0 0 ?
0A/lA
H)
OH W000 0.00
•4 -P H -POW
Cd 0
C
O04-
C\i cJ0-Pd) CO 0 CO 0
OWH0 -H CdC-CHO
00.
CO.0 O
o C) 00.-H 1-4 0
CO 0—
C) C/)H
0.0W H
o C) I-HC-4U) CO
•-PcdW 0.
-IH4I)
C'J000 bO0-0. •00C 0.00
-H CC 1-44
-P-H
H•H
• .0CC
H -P
•C/)0 H
1-4)-P C) -P -H H -H H .0 H -H .0 -H .0 0 .0 CC -P (/)0CC-POH Cd
00
HH H
00 CC CC
HH 00
.0 .0 -H -H CC .0 H H -POC)C)
cI)Z O4 e
°E o •
000000 00
o o 0 0 0 0
00000 oooI, 0000000
() H
CO CO
0.0.
-4)
0 C)
0 0 0 0 60 0 0 0 66
00O0 00 00
0 0 0 0 0
00 ooofr,eo
0
4 4 _—__4 4___4 4.
'.
000000 0 0
__J ,
, 9 o 00 0 0 o0
o 0 0 0 ,o'
I0 0 0 0
0
0 0 0 0 o o 0 0 0 0 0 o'0 o 0 0 0 0 0 0
\ 4- 4- \ \
000
0 0, 0
1o do 0 0-41 • 0 0 0 0 0 0 0 0 0 0
0000000
\4\ 00u
00000 90000 000
IThe
mechanisms for this variation must be primarily rheological in character. The behavior of
the LDPEs are certainly related to the strain hardening elongational flow characteristics.The HDPEs all have the same activation energy at viscous flow. The LLDPE behaves like the HDPE—3 in which it is rheologically similar despite undoubtedly having a higher activation energy of viscous flow.
Results
EXTRUSION INSTABILITIES
BASF investigated the three HDPE melts at 190°C. In Fig. 24 extrusion pressure is plotted versus apparent shear rate. A steady extrusion pressure independent of the die cross section is observed for an L/D 60 die up to a critical shear rate , which is indicated by the symbol +.
At
higher shear rates a pulsation of the Dressure is found. In that range no data points are given. The extrusion pressure becomes steady again above the shear rates marked by. +.In
that range the shear stress—shear rate behavior is dependent on the die cross section.This also implies the flow instability occurs at a critical shear rate of shear stress.
iO1
lO 1O
1O4 1Q5APPARENT WALL SHEAR RATE (s') (a)
I
010
H 10
100
(U
0 4R'4 0*0) Lu
o
0o o O.
$0o s , L2,
10101 T =190° C
0
A
40 42
0.10 40 0.41 I
100 101 io2
io io io
io6APPARENT WALL SHEAR RATE (s1)
LLDPE—1
=190°C(U
0 0
APPARENT WALL SHEAR RATE (s1)
100 101 102
io io
105APPARENTWALL SHEAR RATE (s
io6
I I I
4(4*1) UI
(f)
0 Iii
0.40 4010
A 422 0.40 0FLD:
100 io6
Fig.
24. Characteristic flow curves for polyethylene melts (BASF)a) HDPE—l b) HDPE—2 c) HDPE—3 d) LLDPE e) LDPE—l f) LDPE—2
10
APPARENT WALL SHEAR RATE (s1)The LLDPE melt which was investigated at 190°C and 150°C exhibits a flow behavior which is
very similar to that of the HDPE melts. Pulsation of the extrusion pressure is most pronoun- ced at 150°C. The gap between the shear rates of steady extrusion pressure becomes broader with smaller diameter of the die.
In the case of the two LDPE melts, which were investigated at 150°C, no oscillation of the pressure was found nor a dependence of the flow curve on the die cross section.
In Table 14, we compare critical die wall shear rates and shear stresses The o data unlike5the shear rate is independent of temperature. Te
data
is in the range of 05 to 5 x 10 pascal.ETH observed that HDPE—3 and LLDPE exhibit two unstable flow regimes and not a single un- stable reginre like HDPE—1 and HDPE—2. The characteristics of the extrudate are shown in Fig. 25. The relationship of these extrudate shapes to positions on extrusion pressure apparent shear rate curves is shown in Fig. 26.
Type
L/D=30 D=
Onset of Flow
Inst
abilities1.2mmT[°C]
w' Gw[105I
HDPE—1 HDPE—2 HDPE—3
190 190 190
395 330 1400
2.6 3.3 3.7 LLDPE
LLDPE
190 150
670 140
4.0 3.2 LDPE—1
LDPE—2
150 150
285 67
0.48 0.85
I I I
HDPE-3 190°C
io2 L/D
101
Extrudate Distortion
L/D° 0.5
100 100
loll
I I
101 io2 io5 106
APPARENTSHEAR RATE Is1) I
LLDPE 190°C
10
io2
101
•
.
L/
L/ Extrudate Distortion0
100 I I
10° 10' io2 io3 1O' S
APPARENT ShEAR RATE (1)
TABLE 14. Characterization of Extrusion Instabilities by BASF
0 z
LUc
I/l
z0
F->(
LU
0 z
1/,
a-z
0
F-x
LU
A Q.
BO,.))1))IiD
QTETT
Extrudates of LLDPE and HDPE-3 at Different Extrusion Rates
Fig.
25. Characteristic flow curves for narrow MWD linear polyethylenes (ETH)Fig. 26. Shapes of the extrudates of HDPE—3 and LLDPE at various extrusion rates (ETH)
10 1&
CdFC
who used a screw extruder, classified their observations according to:
They present their data as die wall shear rate as a function of screw speed, using die dia- meter as a running parameter (see Fig. 27). Dotted lines delimit different visual aspect
M U froct re Smooth /•
2zone7i
/Z/•'
-
./h,or1ski/'./
-
98 Smooth
HDPE 3
2.5"/"
1:190°CN (tmin1)
0 i0
(c)
N (t.min)
I
iii l IIII
02
—smooth -sharkskin
—melt
fracture
—two zones
extrudate without any surface and diameter irregularities regular extrudate diameter by thread aspect
extrudate
with surface and diameter irregularities regular alternative zones of
sharkskin and melt fractureD—(s
7rtr40 Shear roteD(s)
10
HDPE-l 1:190°C
IC'
HDPE-2 102
T:1900C
N (t.min)
ii
I I ui_i_i_I 1010 102
(a)
275
Screw N speed (t.min) I uuuuuul I
I liii
I0 102
(b)
:-4- (s) 0:- (s) D-(s)
0
i0
102 Melt
LLDPE —I
T: 90°C
N (tmtn) I0
(d)
1.5
8 2.2 2.5 LDPE -I
1:190°C
N (t.min1)
LOPE -2 T:190°C
0
(e)
I0
(f)
Fig. 27. Apparent shear rate 4Q/irD3 as a function of screw rotation speed of extruder for polyethylene melts (CdFC) a) HDPE—l b) HDPE—2 c) HDPE—3
d) LLDPE e) LDPE—l f) LDPE—2
zones.
There are differences between the five samples. We
observe with increasing shear rate:— smooth —
sharkskin
— twozones —melt
fracture for one HDPE sample (HDPE—2) and for LLDPE 1;for HDPE—3 there is a supplementary smooth zone between 2 zones and melt fracture.
—
direct
modification from smooth extrudate to melt fracture for one IIDPE sample (HDPE—1) andfor the two LDPE samples.
Discussion
It
is noteworthy that the three HDPE melts and LLDPE exhibit similar flow breakdown with inception of apparent slippage at about the same wall shear stress level i.e., 2.64.0 x 10 pascal and thi probably the same mechanism. The LDPE breaks down at a lower shear stress 0.480.85 x 10 pascal apparently by a different mechanism. This corresponds to the obser- vations of Tordella (ref. 23) more than a quarter century ago.CONCLUSIONS
A series of
linear polyethylenes of varying molecular weight distribution and extent of branching
has been structurally and rheologically characterized in laminar shear flow and umiaxial extension. They have subsequently been investigated in a series of processing flows. Certaim gemeral conclusions may be reached classifying the stability behavior of the polymer melts in the different flows investigated. Specifically for umiaxial extension the stability as rated in terms of kinematic variables (strçtch ratio) may be expressed asLDPE-2 > HDPE-3 LLDPE > LDPE-1 > HDPE—2 > HDPE-1 For melt spinning the critical drawdown ratios order as
LDPE-2 > LDPE-1 > HDPE-3 LLDPE > HDPE-2 > HDPE-1
while for tubular film extrusion, the stability in terms of kinematics (drawdown ratio, blowup ratio) varies as
LDPE-1 > LDPE—2 > HDPE—1 HDPE—2 > LLDPE > HDPE—3 For extrusion instabilities evaluated in terms of shear rate
HDPE—3 > LLDPE > HDPE—1 > HDPE-2 (190°c) LDPE-l > LLDPE > LDPE—2 (150°c)
and shear stress
HDPE—1 HDPE—2 HDPE—3 LLDPE > LDPE—1 LDPE—2
The rating in each case is different. Long chain branching seems generally stabilizing in elongational flows including uniaxial stretching, melt spinning and tubular film extrusion.
Broadening molecular weight distribution in linear polymers is destabilizing for uniaxial stretching and melt spinning, but apparently stabilizing for tubular film extrusion.
PARTICIPATING MEMBERS AND LABORATORIES
Dr.
H.M. Laur, Dr. S.T.E. Aldhouse
BASF
AGBritish Petroleum
D-ZKM-G201
P.O. Box 21
D
6700 Ludwiqshafen/Rhein Boness Road
Germany Grangemouth, Stirlingshire FK 39XH
Scotland Mr. H. Coster
Borg Warner Chemicals Dr. D. Constantin
P.O. Box 8122 Societe Chimique des Charbonnages
Amsterdam
CcJF ChimieNetherlands Centre de Recherches Nord
62160 Bul 1 y-Les—Mi nes
France
Dr. 3. Meissner
Ei dgenoessi scheTechnische Hochschule Zurich
Techni sches Laboratori urnUniversitatstrasse 6
CH — 8006 Zurich Switzerland Dr. M. Fleissner
Hoechst AG
Kunststoff Forschung H Postfach 80 03 20
D — 6230 Frankfurt am Main 80 Germany
Dr. D.J. Groves
ICI Petrochemicals and Plastics Division Wilton Centre
P.O. Box No. 90 Wilton
Mi ddl esbrough
Cleveland United Kingdom Dr. L.A. Utracki
National Research Council Canada
Industrial Materials Research Institute 75, Soul De Mortagne
Bouchervi 1 1 e
uebec
Canada
Mr. A. Ghijsels
Koninklijke/Shell Laboratorium Postbus 3003
Badhuisweg 3 Amsterdam —
NNetherlands
Acknowledgements
Dr. J.M. Starita Rheometrics, Inc.
I Possumkown Road
Pi scatawayNew Jersey 08854 USA
Dr. Frank
Rheometrics GmbH Arabella Center Lyoner Strasse 44—48 D6000 Frankfurt aM. 71 West Germany
Dr. G. Ajroldi Montepolimeri SpA
Centre Richerche Bollate Via S. Pietro, 50
I —
20021Bollate
ItalyPr. J.L. White Dr. H. Vamane
Polymer Engineering Center The University of Akron Akron, Ohio 44325 USA
Pr. H.H. Winter
Dept. of Chemical Engineering University of Massachusetts Amherst, Mass. 01003
USA
Research at the University of Akron was supported by the Division of Engineering of the National Science Foundation. The authors also wish to thank the efforts of Mr. Ho Jong Kang of the University of Akron.
REFERENCES
J.
Meissner, Pure Appl. Chem. 42, 553 (1975).H.H. Winter, Pure Appl. Chem. 55, 943 (1983).
Y. Ide and J.L. White, J. Appl. Polym. Sci. 20, 2511 (1976).
Y. Ide and J.L. White, J. Appl. Polym. Sci. 22, 1061 (1978).
W. Minoshima, J.L. White and J.E. Spruiell, Polym. Eng. Sci.20, 1166 (1980).
H.I. Freeman and N.J. Coplan, J. Appl. Polym. Sci. 8, 2389 (1964).
S. Kase, T. Matsuo and Y. Yoshimoto, Seni Kikai Gakkaishi 19, 763 (1966).
A. Bergonzoni and A.J. DiCresci Polyn. Eng. Sci. 6, 45 (1966).
S. Kase, J. Appl. Polym.
Sci.
18, 3279 (1974).A. Ghijsels and J.J.S. Ente, Rheology Vol. 3, Edited by G. Astarita, G. Narrucci and L. Nicolais, Plenum, NY (1980).
W. Minoshinia, J.L. White and J.E. Spruiell, J. Appl. Polym. Sci. 25, 287 (1980).
H. Yamane and J.L. Vhite, Polym. Eng. Sci. 23, 516 (1983).
W. Minoshiina, Ph.D. Dissertation in Polymer Engineering University of Tennessee, Knoxville (1983). Also W. Minoshima and J.L. White, J.Nom. Newt. Fluid Mech.
19, 275 (1986).
1.
2.
3.
4.
5.
6.
7.
8.
9.
10.
11.
12.
13.
14. C.D. Han and J.Y. Park, J. Appl. Polym. Sci.
19,
3291 (1975).15. C.D. Han and R. Shetty, IEC Fund 16, 49 (1977).
16. T. Kanai and J.L. White, Polym. Eng. Sc 24, 1185 (1984).
17. R.S. Spencer and R.E. Dillon, J. ColloidSci. 4, 241 (1949).
18. J.P. Tordella, J. Appl. Phys. 27, 454 (1956).
19. J.P. Tordella, Rheol.
Acta
1, 216 (1958).20. P.L. Clegg, Trans. Plastics Inst. 28, 245 (1960).
21. E.B. Bagley and H.P. Schreiber, Trans Soc. Rheology 5, 341 (1961).
22. E.R. Howells and J.J. Benbow, Trans Plast. Inst. 30, 242 (1962).
23. J.P. Tordella, J. Appl. Polyn. Sci. 7, 215 (1963).
24. H.N. Laun and H. Munstedt, Rheol. Acta 17, 415 (1978).
25. H. Yamane and J.L. White, Polym. Eng. Rev. 2, 167 (1982).
26. F.N. Cogswell, Polyn. Eng. Sci. 12, 64 (1972).
27. T.G. Fox, S. Gratch and E. Loshaek in "Rheology" Vol. 1, Edited by F.R. Eirich, Academic Press, NY (1956).
28. G.V. Vinogradov and A.Y. Nalkin "Rheology of Polymers" Mir, Noscow (1980).
29. C.D. Han and T.C. Yu, Rheol. Acta 10, 398. (1971).
30. K. Oda, J.L. White and E.S. Clark, Polym. Eng. Sci. 18, 25 (1978).
31. B.D. Coleman and H. Narkovitz, J. Appl. Phys. 35, 1 (1964).
32. W.P. Cox and E.H. Merz, J. Polym. Sci. 28, 619 (1958).
33. J.L. White and H. Yamane, Pure Appl. Chem. 57, 1441 (1985).