THE HADLEY
CIRCULATION
The earlywork on the mean meridionalcirculation of the tropics was moti-
vated by observations of the trade winds. Halley (1686) and Hadley (1735)
concluded that the trade winds are part of a large-scale circulation which
results from the latitudinal distribution of solar heating. This circulation,
now known as the Hadley circulation, consists of upward motion at lower
latitudes, polewardmotionaloft,sinkingmotionathigherlatitudesandlow-
level equatorial ow. Despite the absence of upper-air observations Hadley
deduced thattheupper-levelowhas awesterlycomponentdue tothe eect
of the earth's rotation.
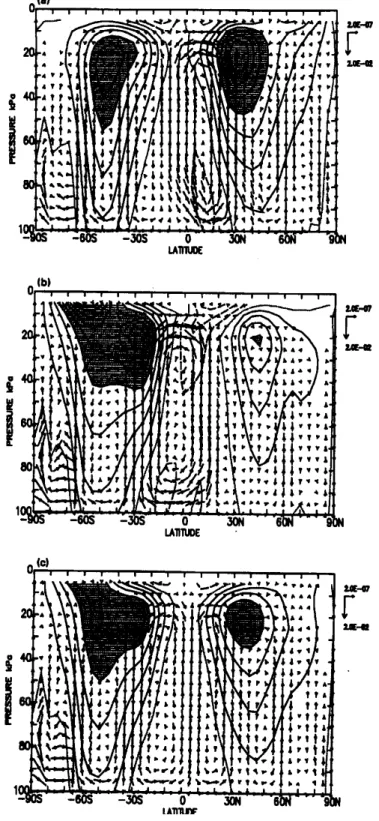
Themeanzonally-averagedcirculationof theatmosphereisillustrated in
Fig. 4.1. The annual mean (Fig. 4.1c) shows two thermally-direct circula-
tions, the Hadley Cells,with ascent atthe equator and descent at30 Æ
N and
30 Æ
S.TheHadleycellsare symmetricaboutthe equatorintheannualmean.
In each hemisphere there is a subtropical westerly upper-level jet located
just polewards of the descending branch of the Hadley cell. In the north-
ern hemisphere winter (DJF) (Fig. 4.1a) the northern Hadley cell is much
stronger and broader than the southern cell. The location of the ascending
branch has moved south of the equator into the summer hemisphere. The
westerly jetinthenorthern hemisphereisstrongerand furthersouththan in
the annualmean. In the southern hemisphere winter (Fig. 4.1b) the south-
ern Hadley celldominates the tropicalcirculation, the northern Hadley cell
isweakandverynarrow. Themaximumascentisnorthoftheequatorinthe
summerhemisphereandthesouthernhemispherewesterlyjetshowsadouble
jet structure with a maximum at the location of the descending branch of
the Hadleycelland a second maximum further south.
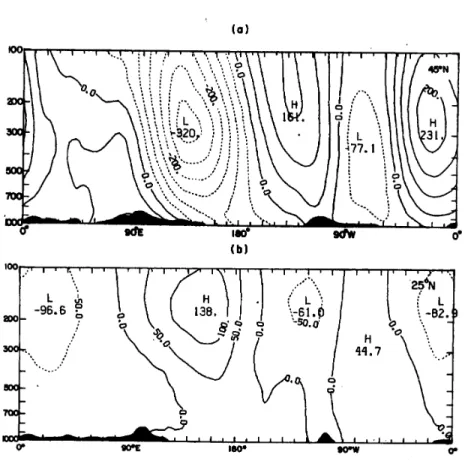
In the tropical troposphere the departure from zonal symmetry is much
smaller than that in midlatitudes. This is illustrated in Fig. 4.2 which
shows thedeparturesfromzonalsymmetryofthetime-averagedgeopotential
height. The cross-sectionat 45 Æ
N shows substantialeddy activity 1
through-
out thetroposphere. Incontrast, at25 Æ
Ntheeddyactivityhas muchsmaller
amplitude in the troposphere. Thus we can use an axisymmetric model to
develop a simple model of the Hadley circulation. Such a model was de-
veloped by Held and Hou (1980). The description of this modelgiven here
closely follows that of James (1994).
4.1 The Held-Hou Model of the Hadley Cir-
culation.
The Held-Hou model is symmetric about the equator and assumes steady,
linear, axisymmetric ow in hydrostatic balance. The main features of the
model are a simplied representation of solar heating and the use of angu-
lar momentum conservation and thermal wind balance. The model aims to
predict the strength and the width of the Hadley circulation.
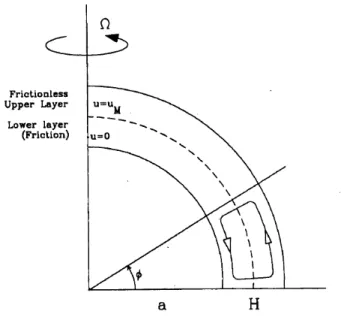
The Held-Hou model is a two-level model on the sphere with equator-
ward ow at the surface and poleward ow at height H, as illustrated in
Fig. 4.3. The radius of the earth is a, the angular velocity of the earth
, and the latitude '. The thermal structure is described by the mid-level
potential temperature, . Radiative processes are represented in the model
using a Newtonian cooling formulation in which the potential temperature
of the model is driven towards a prescribed radiative equilibrium potential
temperatureprole,
E
, onatime scale
E
. Mathematically,we write
D
Dt
=
E
E
; (4.1)
where
E
(')=
0 1
3
3 sin 2
' 1
: (4.2)
In the latter expression,
0
isthe globalmean radiativeequilibriumtemper-
ature and the equilibriumpole-to-equator temperature dierence.
It is assumed that, as a result of friction at the ground, the zonal wind
at the surface is much smaller than the zonal wind at height H and can be
neglected. The zonal ow atheightH, U
M
, is calculatedon the assumption
of conservationof angularmomentumasfollows. Letu bethe zonalvelocity
1
Substantialinthesensethat uctuationsaboutthemeanarecomparativelylarge.
of aringofairatlatitude'. Thenthe specic 2
absoluteangularmomentum
oftheringisgivenby(acos'+u)acos',whereaistheradiusoftheearth.
If we assume that u = 0 at the equator, the zonal ow at latitude ' is
given by
u(')=a sin
2
'
cos'
: (4.3)
We simplify the algebra by assuming that ' is small (i.e. ' sin'
y=a). Thus (4.2)becomes
E
(y)=
E0
y 2
a 2
; (4.4)
with
E0
=
0
+=3 and from(4.3), the upper-level zonal windis
U
M
=
a y
2
: (4.5)
The potential temperature structure at the middle level of the modelis
calculated from thermal wind balance 3
. With the assumptions of steady,
linear, axisymmetric ow in hydrostatic balance, the thermal wind relation
is satisedeven atlowlatitudes. As we have assumed that the zonalow at
the surface is much smaller than that at upper levels, the vertical shear in
the zonaldirection is
@u
@z
= U
M
H
=
aH y
2
:
Thermalwind balancegivesthe meridionalpotentialtemperaturegradi-
ent
@
@y
= 2
2
0
a 2
gH y
3
:
We integrate this expression to obtain the potentialtemperatureeld
M
=
M0
2
0
2a 2
gH y
4
; (4.6)
where the constant of integration,
M0
, is the temperature at the equator.
The subscript M is used here to remind us that the potential temperature
eld has been derived using conservation of angularmomentum.
2
Specic meansperunitmass.
3
Theapproximationusedisthatf(@u=@z)= (g=
o
)(@=@y),whereisthepotential
temperature,
0
is somereferencepotentialtemperature,f =2sin2y=a,andg is
theaccelerationdue togravity.
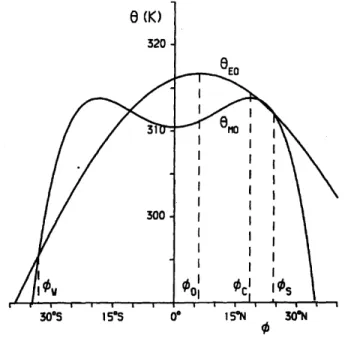
Figure 4.4 shows the equilibrium temperature,
E
, and the model tem-
perature,
M
. The temperature curves intersect each other twice in each
hemisphere, with
E
>
M
between the equator and the rst crossingpoint,
and
E
<
M
between therstandsecondcrossingpoints. From (4.1)wesee
that there is heating between the equator and the rst crossing point, and
cooling between the equator and the second crossing point. Heating occurs
at latitudes higher than the second crossing point. Since this is unphysi-
cal we assume that the second crossing point, y = Y, marks the poleward
boundary of the Hadley circulation. Fory >Y the temperature isgiven by
the radiative equilibriumtemperature,
E .
We have now two unknowns: the width of the Hadley cell, Y, and the
equatorial temperature,
M0
. Since the modelassumes a steady state, there
can be no net heating of an air parcel when it completes a circuit of the
Hadley cell, i.e.
Y
Z
0 D
Dt
dy=0;
and from (4.1), assumingthat
E
is a constant,
Y
Z
0
M dy=
Y
Z
0
E dy:
Using(4.4) and (4.6) we obtain
M0
2
0
10a 2
gH Y
4
=
E0
3a 2
Y 2
: (4.7)
Weassumecontinuityofpotentialtemperatureaty=Ysothat
M (Y)=
E
(Y). This gives
M0
2
0
2a 2
gH Y
4
=
E0
a 2
Y 2
: (4.8)
From (4.7) and (4.8) we obtainthe widthof the Hadley cell
Y =
5gH
3 2
0
1=2
; (4.9)
and the equatorialtemperature
M0
=
E0
5 2
gH
18a 2
2
: (4.10)
Taking
0
= 255 K, = 40 K, and H = 12 km gives the width of the
Hadley cell to be approximately 2400 km and the equatorial temperature
to be about 0.9 Kcooler than the equilibriumequatorial temperature. The
width ofthe Hadleycellfromthe simplemodelisroughlyinagreementwith
observations (see Fig. 3),althoughit issomewhat toosmall.
The meridionalvariation of the zonal wind is given by (4.5) for y Y.
The zonal wind increases quadratically withy toreacha maximum value of
approximately66ms 1
aty =Y. At higherlatitudesthe zonal windcan be
calculated fromthermal windbalance usingthe equilibriumtemperature
E
given by (4.4). This givesthe zonal windfor yY
U
E
=
gH
a
0
: (4.11)
For the parameter values given above U
E
is 40 ms 1
. Thus we see that
there is a discontinuity in the zonal wind at the poleward boundary of the
Hadleycirculation. Althoughthisdiscontinuityisnotphysicalwecouldthink
of it asrepresenting the upper-leveljet observed innature. Such asharp jet
wouldnotbeobserved eitherinnatureorinamoresophisticatedmodelsince
it would be veryunstable.
The strength of the Hadley circulation in the Held-Hou model can be
estimated as follows. By symmetry, v = 0 at the equator and (4.1) can be
expressed as
w
@
@z
=
E0
M0
E :
Assuming constant Brunt-Vaisala frequency, N, the middle-troposphere
vertical velocity atthe equator, w
H =2
isgiven by
w
H =2
= g
0 N
2 (
E0
M0 )
E :
Using
E
15 days and N 10 2
s 1
gives w
H =2
0:27 mms 1
.
Assuming that the vertical velocity varies quadratically with height, i.e.,
w = 4w
H =2
z(H z)=H 2
, then (@w=@z)
z=H
= 4w
H =2
=H. From continuity,
v
z=H
4Yw
H =2
=H 21.6 cms 1. Observations show that the strength of
the meridionalowintheHadleycirculationisapproximately1ms 1
. Thus
althoughtheHeld-Houmodelprovidesareasonableestimateofthegeometry
ofthe Hadleycirculationitgivesapoorestimateofthestrength ofthecircu-
lation. Part of the reason may be the use of the Boussinesq approximation.
TheHeld-HoumodelpredictsthatthewidthoftheHadleycellisinversely
proportional to the planetary rotation rate (see (4.9)). This prediction has
been conrmed in more realistic models of planetary atmospheres. At low
rotationrates the Hadleycells extendfar polewards andaccount formost of
the heat transport from equator to pole. At high rotationrates the Hadley
cells are conned near the equator and baroclinic waves polewards of the
Hadley circulations are responsible for a signicant proportion of the heat
transport. Formore details see, for example, James (1994,Ch. 10).
4.2 Extensions to the Held-Hou Model
Althoughthe Held-Hou modelgivesa reasonableestimatefor thesize of the
Hadley circulation it gives a very poor estimate of its strength. A better
model can be formulated by relaxing one of the assumptions of the Held-
Hou model, namely that of symmetry about the equator. Although the
annual mean solar heating is symmetric about the equator, the heating at
anygiventimeisgenerallynotandthustheresponsetothesolarforcingisnot
necessarily symmetric about the equator. Figure (4.1) shows that although
the annual mean Hadley circulation is symmetric about the equator, the
monthly mean Hadley circulation may be very asymmetric. Lindzen and
Hou (1988) extended the Held-Hou model to allow for such an asymmetry
whilst retainingthe otherassumptions described above.
The extended modelis sketched in Fig. (4.5). The removal of the sym-
metry constraint means that the locations of maximum heating, maximum
ascent,andthestreamlinedividingthesummerandwinterHadleycellsneed
not coincide. The solar heating is maximum at y = Y
0
. The streamline
dividing the summerand winter cells is located at y=Y
1
and the poleward
extent of the summer and winter cells are given by Y
+
and Y respectively.
Radiative processes are represented by (4.1) as before, but the equilibrium
potentialtemperature isgiven by
E
=
E0
a 2
y 2
Y 2
0
: (4.12)
sothat
E
ismaximumatY
0
. Conservationofangularmomentumisusedas
beforeto calculatethe upper-level zonal ow, with the assumption that the
zonalwindiszeroatthedividingstreamlinebetweenthewinterand summer
cells, i.e. aty=Y
1
. The upper-levelzonal ow forsmall y is
U
M
=
a y
2
Y 2
1
: (4.13)
Usingthermalwind balance we obtainthe potential temperature
M
(y)=
M (Y
1 )
2
0
2
4a 2
gH y
2
Y 2
1
2
: (4.14)
Note that both U
M
and
M
are asymmetric about the equator. The asym-
metry inthe solutionarisesfromthe dierentsize of thesummerand winter
cells. For jyj < jY
1
j, Eq. (4.13) gives U
M
< 0, i.e. there are upper-level
easterlies atthe equator. The formof
E and
M
isshown inFig. (4.6). The
poleward extent of each Hadley cell is dened as the second crossing point
of thetwopotentialtemperaturecurvestothe northorsouth ofthe latitude
of maximum heating. Note that the magnitude of heating and cooling in
the summer cell is much smaller than that in the winter cell. Figure (4.6)
shows a strong asymmetry in the size of the summer and winter cells when
the maximum heatingis at6 Æ
N.
We have now four unknowns: Y
1 , Y
+
, Y , and
M (Y
1
). These can be
found using the conditions of no net heating for an air parcel completing a
circuit of eachcell
Y
1
Z
Y (
E
M
)dy=0 and Y+
Z
Y
1 (
E
M
)dy=0
and of continuity of potential temperatureat y=Y
+
and y=Y .
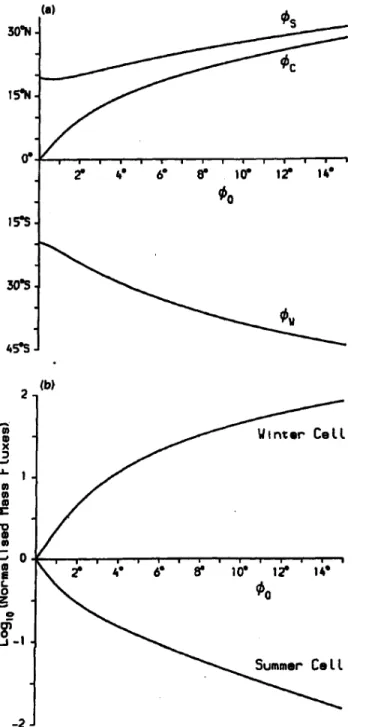
The poleward extent of the two cells and the latitude of the dividing
streamline are shown in Fig. (4.7a) for varying latitude of maximum heat-
ing. As the latitudeof maximumheatingincreases thewidth of the summer
cell decreases signicantly. For maximum heating only 2 Æ
away from the
equator, the winter cellis over three times as wide as the summercell. The
relative width of the winter and summer cell changes most signicantly for
smalldisplacementsawayfromthe equatorofthelatitudeofmaximumheat-
ing. Thedividingstreamlineisalwayspolewardsofthe latitudeofmaximum
heating. The mass ux in the winter and summer cells is shown in Fig.
(4.7b), normalized by the mass ux for symmetric heating. As the latitude
of maximum heatingmoves away fromthe equator the mass ux carried by
the winter cell increases strongly and that carried by the summer cell de-
creases. For maximum heating 4 Æ
away from the equator the mass ux in
the winter cellisoveranorder ofmagnitude largerthan that inthe summer
cell. When the maximum heating is 6 Æ
from the equator the dierence in
the mass uxes is two orders of magnitude. Figure4.7 shows that both the
strength and the width of theHadley circulationsare relatedto the latitude
of maximum heating in a highly nonlinear manner. The Hadley circulation
inthesymmetric Held-Houmodelistooweakbecausetheannuallyaveraged
response to solar heating is much stronger than the response to the annu-
ally averaged heating. Discrepancies exist still between the results of this
simple model and the observations. For example, the upper-level equatorial
easterlies are too strong. However, it is perhaps more surprising that the
model canreproducemany oftheobserved featuresofthezonally symmetric
circulation, when one considers the natureof the approximations made.
Furtherimprovements tothe Held-Hou modelcan be madeby including
the eects of friction in the upper atmosphere and of moisture. Inclusion
of these eects in the axisymmetric framework is discussed in James (1994
Section 4.3).
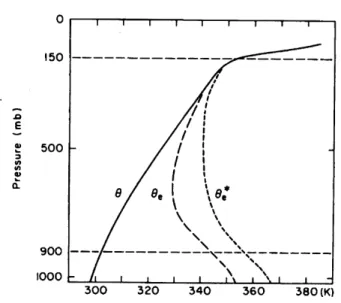
Amoreseriousdrawbackofsuchsimplemodelsoflarge-scaleoverturning
isthatthey arenot consistentwith theobserved verticalproleof equivalent
potential temperature, as discussed by Holton (1992, Ch. 11). The simple
model requires air from the lower troposphere to rise uniformly and then
movepolewards,transportingheatfromequator topole. The verticalprole
of equivalent potential temperature,
e
, in the tropics (Fig. 4.8) exhibits a
mid-tropospheric minimum. Large-scale ascent in this environment would
leadtoanincreasein
e
inthelowertroposphereand adecrease inthe upper
troposphere, in other words, the observed distribution of
e
could not be
maintained.
In reality the ascending motion of the Hadley circulation takes place in
deep convection in the ITCZ. Air parcels from the boundary layer which
ascendincumulonimbustowersthroughtheenvironmentshowninFig. (4.8)
canarriveatthetropopausewithpositivebuoyancy. RiehlandMalkus(1958)
estimated thatofthe orderof1500 -5000cumulonimbus towers arerequired
simultaneously around the ITCZ to account for the required vertical heat
transport.
Figure4.1: Thezonalmeanzonalwindandvectorsofthemeridionalwindfor
(a) December-January-February, (b) June-July-August, and (c) the annual
mean, based on six years of ECMWF data. Contour interval 5 ms 1
, with
valuesinexcess of 20ms 1
shaded. Thehorizontalsample arrowindicatesa
meridionalwind of 3ms 1
,and the vertical samplearrowa vertical velocity
1
Figure4.2: Longitude-heightcross-sectionsofthe departurefromzonalsym-
metry ofthe time-averagedgeopotentialheighttaken along(a)45 Æ
Nand (b)
25 Æ
N. The contour interval is 50 m. The localorography is depicted at the
bottomof the gures. (From Gill,1982)
Figure 4.3: Schematic illustration of the Held-Hou model. (From James,
1994)
Figure 4.4: Showing
E
and
M
as a function of poleward distance for the
Held and Hou model. The constant
M0
must be chosen so that the areas
between the two curves are equal, i.e. so that there is no net heating of air
parcels. (From James, 1994).
Figure 4.5: Schematic illustration of the Held-Hou model without the as-
sumption of symmetry about the equator. Y
0
denotes the latitude of max-
imum heating, Y
1
the dividing streamline between the summer and winter
cells. Y
+
and Y give the poleward extent of the summer and winter cells
respectively.
Figure 4.6: The Held-Hou model for asymmetric heating with maximum
value at6 Æ
N. Here '
W
;'
0
;'
c
and '
S
correspond with y Y ;Y
0
;Y
1
and Y
+
in Fig. (4.5). (From James, 1994)
Figure 4.7: Results of the Held-Hou model for asymmetric heating with
varying latitude of maximum heating. (a) Variation of the poleward extent
of the summer and winter circulations and of the latitude of the dividing
streamline. (b) Variationof the massux carriedbythe winter and summer
cells. Here '
W , '
0 , '
c
and '
S
correspond with Y , Y
0 , Y
1
and Y
+
in Fig.
Figure4.8: Typicalsounding inthe tropicalatmosphereshowingthe vertical
proles ofpotentialtemperature,equivalentpotentialtemperature
e , and
the saturated equivalent potential temperature
c
. (From Holton (1992),
after Ooyama, 1969)