• Keine Ergebnisse gefunden

Nitrogen deposition but not ozone affects productivity and community composition of subalpine grassland after 3 yr of treatment

N/A
N/A
Protected

Academic year: 2021

Aktie "Nitrogen deposition but not ozone affects productivity and community composition of subalpine grassland after 3 yr of treatment"

Copied!
15
0
0

Wird geladen.... (Jetzt Volltext ansehen)

Volltext

(1)

www.newphytologist.org 523

Research

Blackwell Publishing Ltd

Nitrogen deposition but not ozone affects productivity and community composition of subalpine grassland after 3 yr of treatment

Seraina Bassin

1

, Matthias Volk

1

, Matthias Suter

2

, Nina Buchmann

3

and Jürg Fuhrer

1

1

Air Pollution and Climate Group, Agroscope Research Station ART, CH-8046 Zurich, Switzerland;

2

Institute of Integrative Biology, ETH Zurich, CH-8092 Zurich, Switzerland,

3

Institute of Plant Sciences, ETH Zurich, CH-8092 Zurich, Switzerland

Summary

• A field experiment was established at 2000 m above sea level (asl) in the central Swiss Alps with the aim of investigating the effects of elevated ozone (O

3

) and nitrogen deposition (N), and of their combination, on above-ground productivity and species composition of subalpine grassland.

• One hundred and eighty monoliths were extracted from a species-rich Geo- Montani-Nardetum pasture and exposed in a free-air O

3

-fumigation system to one of three concentrations of O

3

(ambient, 1.2 × ambient, 1.6 × ambient) and five concentrations of additional N. Above-ground biomass, proportion of functional groups and normalized difference vegetation index (NDVI) were measured annually.

• After 3 yr of treatment, the vegetation responded to the N input with an increase in above-ground productivity and altered species composition, but without changes resulting from elevated O

3

. N input > 10 kg N ha

–1

yr

–1

was sufficient to affect the composition of functional groups, with sedges benefiting over–proportionally. No interaction of O

3

× N was observed, except for NDVI; positive effects of N addition on canopy greenness were counteracted by accelerated leaf senescence in the highest O

3

treatment.

• The results suggest that effects of elevated O

3

on the productivity and floristic composition of subalpine grassland may develop slowly, regardless of the sensitive response to increasing N.

Key words: Carex , grassland, Nardetum , nitrogen, ozone, seminatural, subalpine zone.

New Phytologist (2007) 175 : 523–534

© The Authors (2007). Journal compilation © New Phytologist (2007) doi : 10.1111/j.1469-8137.2007.02140.x

Author for correspondence:

Seraina Bassin Tel: + 41 44 377 75 08 Fax: + 41 44 377 72 01

Email: Seraina.Bassin@art.admin.ch Received: 16 February 2007 Accepted: 25 April 2007

Introduction

During the last century, concentrations in the troposphere of ozone (O

3

) and reactive nitrogen compounds (N) have risen substantially on a global scale as a result of increasing anthropogenic emissions (Matson et al ., 2002; Ashmore, 2005). Today many regions are exposed to O

3

concentrations and N deposition rates that exceed preindustrial values several-fold (Volz & Kley, 1988; Preunkert et al ., 2003). In Switzerland, current annual rates of N deposition in remote

mountain areas are around 5 kg N ha

–1

yr

–1

, but reach up to

60 kg N ha

–1

yr

–1

in regions with intensive livestock farming

(Rihm & Kurz, 2001). Both N input and O

3

have been found

separately to affect plant communities of natural and

seminatural habitats in ways that threaten the structure and

function of these systems (Ashmore, 2005; Phoenix et al .,

2006). To protect sensitive communities from excess pollutant

input, effect-based abatement strategies applying critical

concentrations for O

3

and critical loads for N have been developed

under the UNECE Convention on Long–range Transboundary

(2)

Research 524

Air Pollution (CLRTAP). However, owing to the lack of suitable experimental data, possible interactive effects of O

3

and N have not been considered.

As an essential nutrient, atmospheric N can alter ecosystem properties such as productivity, cycling of carbon (C) and N (Vitousek et al ., 1997) or biodiversity (Stevens et al ., 2004).

In particular, in natural and seminatural ecosystems species characteristic of nutrient-poor conditions may be displaced by a few fast-growing and highly competitive species (Bobbink et al ., 1998). When, as a result of increasing nutrient availability, below-ground competition for resources shifts to above-ground competition for light, species that effectively invest available N into high relative growth rates are favoured (Schieving & Poorter, 1999), as observed in several N addition experiments in dune vegetation (van den Berg et al ., 2005) and calcareous grasslands (Bobbink, 1991).

Herbaceous systems in climatically extreme environments such as mountain regions may be most susceptible to even low rates of N addition, as suggested by Bowman & Steltzer (1998). These systems are currently marginally exposed to air pollutants, and in the absence of high concentrations of N input they are typically nutrient-poor and species-rich, and thus of high conservation value. In the alpine zones, N addition experiments concentrated on unmanaged alpine heaths (Soudzilovskaia & Onipchenko, 2005) and tundra (Theodose & Bowman, 1997; Bowman et al ., 2006), but little is known about effects of increasing N inputs on subalpine grasslands which play an important role for both conservation and agriculture.

Ozone is the major phytotoxic air pollutant on regional scales. There is ample evidence that current ambient concen- trations are sufficiently high to cause widespread visible O

3

injury in plants in Europe and elsewhere (Benton et al ., 2000). Elevated O

3

impairs photosynthesis, leaf life span, reproduction and growth (Ojanperä et al ., 1998). In species- poor productive grass/legume swards, experimental exposure to elevated O

3

consistently caused an increase in the dominance of grasses at the expense of legumes (cf. Fuhrer et al ., 1994).

In contrast, in natural multispecies communities, few available studies revealed less consistent responses with either declining (Volk et al ., 2006) or rising proportions of legumes (Evans & Ashmore, 1992), and unaffected (Barbo et al ., 1998) or reduced total yield (Evans & Ashmore, 1992; Volk et al ., 2006). These conflicting results suggest that in complex mature communities, multiple plant–plant and plant–environment interactions might strongly modulate the effect of O

3

.

In grasslands, large variability in responsiveness to O

3

stress exists among and within species (Bungener et al ., 1999;

Bassin et al ., 2004b). Recently, the responses to O

3

of different species and community types have been compared (Bassin et al ., 2006; Jones et al ., 2006; Mills et al ., 2006).

Bassin et al . (2006) discussed the importance of physiological and ecological traits in determining O

3

sensitivity. They suggested that a high relative growth rate with related leaf

traits such as high stomatal conductance and high specific leaf area (SLA) promote the specific sensitivity to O

3

. Accordingly, low-productivity communities such as alpine and subalpine grasslands could be considered less responsive to O

3

because of their high proportion of slow-growing, stress-tolerant species. In contrast, Mills et al . (2006) classified this type of grassland among the most sensitive vegetation types based on individual species’ responses to O

3

observed under controlled conditions.

Theoretically, an increase in N availability and in O

3

exposure could have opposing effects. Owing to phenotypic plasticity, plants might become more susceptible to O

3

when growth rates are stimulated by extra available N, or alternatively enhanced detoxification capacity from N-stimulated photo- synthesis could reduce O

3

sensitivity. For instance, high nutrient supply protected Plantago major against O

3

damage (Whitfield et al ., 1998) and Trifolium repens from accelerated leaf senescence (Sanz et al ., 2005). However, data from in situ experiments with intact communities, including multiple treatment levels and factor combinations to test the interaction between N and O

3

, are lacking.

This study was designed to investigate the long-term impact of elevated O

3

and N input, and of their combination, in extensively managed grassland in the Swiss Alps. The aim was to determine: (i) total above-ground productivity; (ii) productivity and proportion of functional groups (grasses, forbs, sedges and legumes); (iii) individual species’ abundance and diversity;

and (iv) the development of the vegetation greenness as an indicator of leaf senescence, in relation to individual and combined concentrations of O

3

and N deposition. Here we report results from the initial 3 yr of experiments.

Materials and Methods

Study area

The experimental site is located at Alp Flix, Sur, Switzerland (2000 m asl, 9 ° 39 ′ N/46 ° 32 ′ E), a high plateau near Julier Pass in the central Alps. The plateau, located c . 100 m below the climatic tree line, is dominated by a raised bog surrounded by extensively managed pastures and hay meadows. Climatic conditions are characterized by cold winters with permanent snow cover and a growing season from April to October.

Precipitation peaks in summer (long-term average 120–

140 mm monthly from May to September) with an annual sum of 1200 mm. Long-term mean annual temperature is 2.8 ° C, and monthly average temperatures are highest in July and August (9–10 ° C).

Vegetation and soil

The vegetation is a Geo-Montani-Nardetum , which is a typical

pasture community covering large areas in the subalpine zone

of the European Alps and Pyrenees (EUNIS classification

(3)

© The Authors (2007). Journal compilation © New Phytologist (2007) www.newphytologist.org New Phytologist (2007) 175 : 523–534 Research 525

35.1, http://eunis.eea.europa.eu/). The most frequent species are Festuca violacea , Nardus stricta and Carex sempervirens , which together account for approximately one-half of the cover. The remaining half is composed of > 70 forb and a few legume species. The low-intensity management, as a cattle pasture with c . 1.3 livestock units ha

–1

grazing during 3 – 4 wk yr

–1

, was replaced in the present study by a cutting regime. It is uncertain to what extent above-ground productivity and species composition might be affected in the long term as a result of the release from grazing selection and potential modifications of the nutrient turnover.

The soil is a slightly acidic cambisol (pH 4.8–6) developed on Serpentinite bedrock. Soil depth varies between 20 and 40 cm, but rooting depth is limited to a maximum of 20 cm.

Experimental design, fumigation and N deposition treatment

A free air fumigation system was installed in spring 2004, consisting of nine rings of 7 m diameter (for details of the system and of its performance, see Volk et al ., 2003). Rings were arranged in three linear blocks on a small ridge of length 150 m. The ridge is orientated east–west and orthogonal to the two main wind directions. Three fumigation treatments (ambient (control), 1.2 × ambient (O

3

+ ), 1.6 × O

3

ambient concentration (O

3

++)) were randomly assigned to the three rings in each block. With O

3

concentrations at these altitudes being mainly controlled by the global background con- centration (Staehelin et al., 1994), we aimed to increase O

3

concentration during the day as well as during the night.

Exposure to elevated O

3

concentrations lasted from 16 June to 25 October in 2004, from 15 April to 24 October in 2005, and from 21 April to 23 October 2006. In 2004, late snow- melt delayed the installation of the fumigation system.

Meteorological conditions allowed O

3

release 74, 62 and 78%

of the time during the fumigation periods in the years 2004, 2005, and 2006, respectively. O

3

concentrations were measured at canopy height in control and fumigation treatments and at reference height (2 m) in ambient air.

Experimental plots consisted of monoliths (L × W × D = 40 × 30 × 20 cm). These were excavated in autumn 2003 from a nearby pasture, placed in drained plastic boxes and randomly assigned to the rings. Boxes were placed in shallow pits flush with the surrounding surface. They were rearranged every year between the rings within each O

3

treatment to minimize confounding effects of microclimatic differences between rings.

Five concentrations of N application were established to simulate atmospheric N deposition during the growing season. Extra N input in these treatments was equivalent to 0, 5, 10, 25, 50 kg N ha

–1

yr

–1

. These annual N amounts were separated into biweekly additions of 200 ml of a solution of ammonium nitrate in well water. Each N concentration was replicated four times in each fumigation ring. The amount of added water was equivalent to only 2% of the annual rainfall

amount, and N addition from well water was < 0.05 kg N ha

–1

yr

–1

. Considering the annual background deposition measured at the study site (c. 4 kg N ha

–1

yr

–1

, see the Results section), total N loads in the different treatments were 4, 9, 14, 29 and 54 kg N ha

–1

yr

–1

. In the following, treatments are referred to as N4, N9, N14, N29 and N54, respectively.

Micrometeorological measurements

Meteorological parameters were recorded at 2 m reference height outside the fumigation rings: global radiation (W m

–2

), wind speed (m s

–1

), air temperature (°C), relative humidity (%), and precipitation (mm h

–1

). For details concerning measurement equipment see Volk et al. (2003).

Background N deposition measurements

Background N deposition was calculated from concentrations measured in air, rainwater and snow. During the growing season, biweekly average ammonia (NH

3

) and nitrogen dioxide (NO

2

) concentrations in air were determined by means of passive samplers (NH

3

, Radiello

®

Fondazione Salvatore Maugeri, Pavia, Italy; NO

2

, constructed after Palmes et al., 1976)). Fluxes of NH

3

-N and NO

3

-N were estimated as a function of the serial resistances R

a

(aerodynamic resistance), R

b

(boundary layer resistance), R

s

(stomatal resistance), and, in the case of NH

3

, R

w

(leaf surface resistance), following the parameterization proposed by Bassin et al. (2004a) and Smith et al. (2000). Total gaseous N deposition per growing season (1 May–31 October) was calculated as the sum of hourly fluxes. Monthly rates of wet deposition of ammonium ( ) and nitrate ( ) were obtained from concentrations measured in rainwater collected in a wet-only sampler (Aerochem Metrics Inc., Bushnell, FL, USA). During winter, and loads of the snow pack were measured shortly before snow-melt, assuming that at this time the snow pack contained the accumulated wet and dry deposition.

Chemical analysis of NO

2

in passive samplers (as nitrite), and in rainwater and melted snow were measured by spectro- photometry (Lambda 25, Perkin Elmer, Shelton, CT, USA).

from NH

3

in passive samplers and in water were analysed by ionchromatography (DX1-03, DIONEX, Sunnyvale, CA, USA). In 2006, the methods for the determination of were replaced by flow injection analysis (Fiastar, FOSS, Hillerød, Denmark).

Vegetation measurements

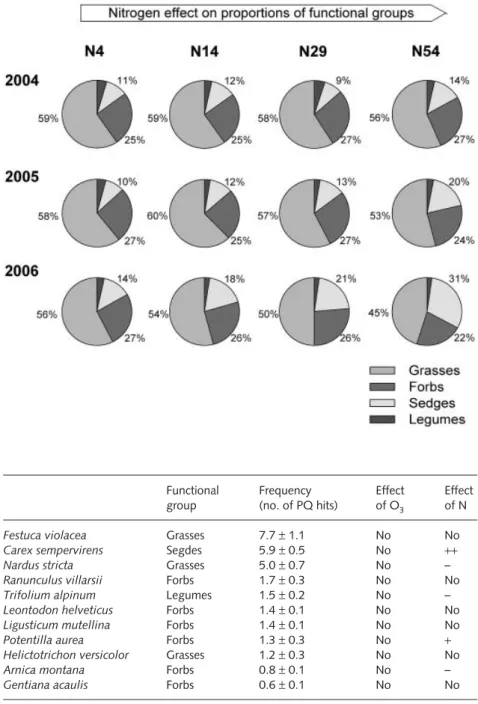
Plants were cut at 2 cm above the surface once each year in August. Plant material was stored at 4°C until separation into functional groups (grasses, forbs, sedges, and legumes). Samples were dried at 60°C to constant weight.

The frequency of individual plant species was recorded each year during the first 2 wk of July using the point-quadrat NH

4+

NO

3

NH

4+

NO

3

NH

+4

NH

4+

NO

3

NH

+4

(4)

(PQ) method (Stampfli, 1991) with 18 sampling points within a 6 cm grid. Based on these values, canopy density ( = total number of PQ hits per monolith) as well as diversity index were derived (Shannon-Wiener index, H′ ) according to the following:

Eqn 1 (s, species number; p

i

, relative abundance of the ith species).

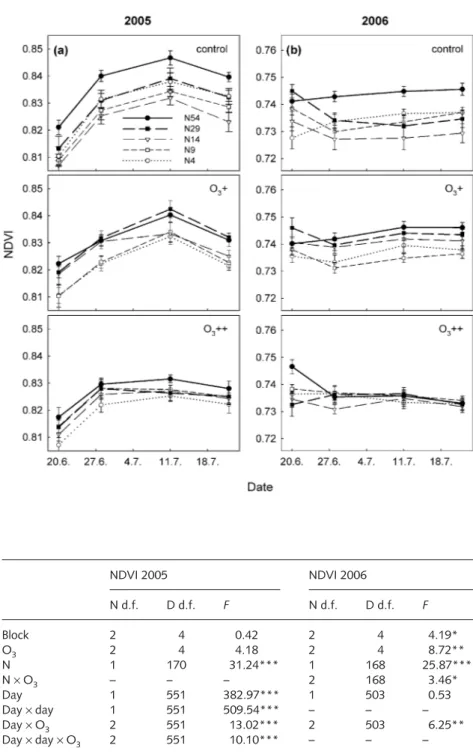
Vegetation development was monitored by measuring the normalized difference vegetation index (NDVI) at 2-wk intervals during June and July. In sparse canopies, NDVI provides an integrative measure of leaf area index (LAI) and chlorophyll content of the vegetation (Gamon et al., 1995). A multispectral radiometer sensor (MSRSYS16R system, Cropscan Inc., Rochester, MN, USA) to measure reflectance at 810 and 680 nm was placed 90 cm above the centre of a monolith. During the measurement, the sur- rounding monoliths were covered. Measurements were taken only on cloudless days during hours with a sun angle > 60 ° (from 10 am to 5 pm). NDVI was calculated following Tucker (1979):

NDVI = (NIR – RED)/(NIR + RED) Eqn 2 (RED and NIR, the measured spectral reflectance in the red and near-infrared regions, respectively).
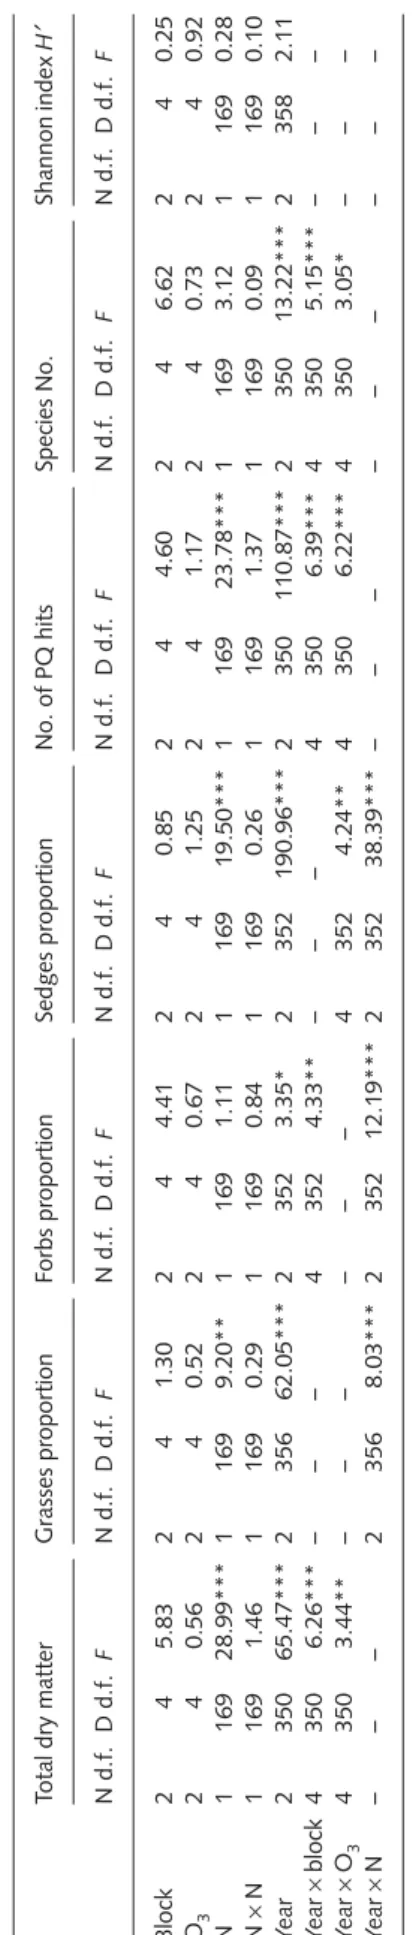
Data analysis

Effects of treatments on above-ground dry matter weight, proportions of functional groups, species number per monolith, diversity index H′, and NDVI were tested in a repeated-measures split-plot analysis of variance (

ANOVA

) with O

3

at the main-plot level and N at the subplot level. All parameters except NDVI were repeated by year; NDVI was analysed separately for the two years 2005 and 2006 and repeated by day of the year. Block, O

3

, and year entered the model as class variables, while N and day (NDVI) were defined as continuous variables. Inclusion of higher-order interactions and quadratic effects into the model were assessed with the AICc criterion (Burnham & Anderson, 2002) with one exception: the interaction of N × N was always included since it refers to the curvature of N as a design variable. To evaluate differences between dry matter weight of functional groups at different N concentrations, values were grouped by N concentration separately for 2005 and 2006, and a one-way

ANOVA

followed by a Tukey post-hoc test was performed.

Treatment-induced changes in the abundance of the 11 most frequent species were analysed qualitatively. All analyses were carried out with the statistical software SAS (SAS Institute Inc., Cary, NC, USA), applying the procedures ‘proc mixed’

and ‘proc anova’. To meet the assumptions of

ANOVA

(normal distribution and homogeneity of residual variance), data were

transformed when necessary. To account for the multidimensional data structure appropriately, estimated means and standard errors (SE) resulting from back-transformation are displayed in figures and the text.

Results

Climatic conditions, O

3

exposure, background N deposition

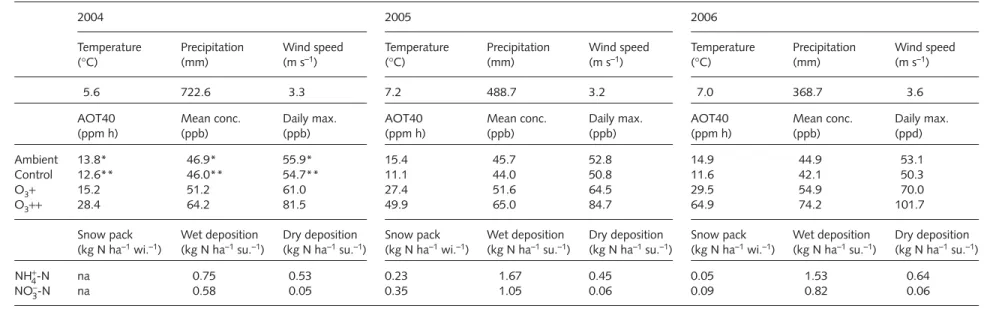
Weather conditions varied considerably over the 3 yr (Table 1) with the summer of 2004 being the wettest, and that of 2006 the warmest and driest. Overall, the region experienced warmer and drier years in 2004–06 compared with the long- term annual mean (data from Swiss Meteorological Service, http://www.meteosuisse.ch/web/en/weather.html).

Ambient O

3

concentrations (24 h means) during the fumigation period were c. 46 ppb (Table 1), showing only a small diurnal variation. Accumulated exposures above a threshold of 40 ppb (AOT40) averaged 12 ppm h in the control plots, 24 ppm h in the O

3

+ treatment and 48 ppm h in the O

3

++

treatment. Year-to-year variations in AOT40 in the elevated O

3

treatments were associated with variations in meteorological conditions and variable length of exposure duration.

Estimated total annual N deposition was between 3.2 and 3.8 kg N ha

–1

yr

–1

, with 1.33–2.7 kg N ha

–1

yr

–1

deposited with rain and c. 0.5 kg N ha

–1

yr

–1

as dry deposition (Table 1).

Winter N input to the vegetation was low (0.14–0.58 kg N ha

–1

yr

–1

) because of the small amount of snow accumulation.

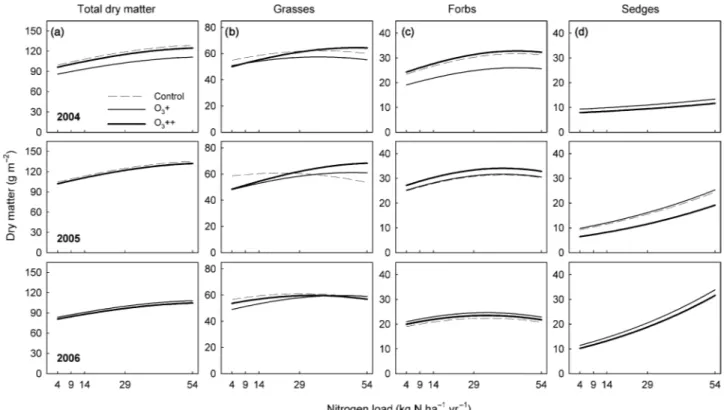
Total above-ground biomass

Above-ground productivity generally did not respond to elevated O

3

during the 3 yr (Fig. 1, Table 2). The O

3

effect pattern was not consistent over time, as indicated by the significant O

3

× year interaction: in year 2004, there was a reduction of total dry matter with O

3

+ (Fig. 1). N addition persistently stimulated biomass, but no O

3

× N interaction was observed (Fig. 1a, Table 2). Growth stimulation in the N29 treatment relative to control plots was + 24% (P < 0.05, Tukey test for multiple comparisons) in 2005 and + 25%

(P < 0.05) in 2006 (Supplementary material, Fig. S1), while in the N54 treatment, the growth increase amounted to + 34% in both years (P < 0.05 in both years). In the N9 treatment, biomass was also slightly, but nonsignificantly, stimulated by 8 and 6% in the 2 yr, respectively, and in the N14 treatment by 13 and 10%, respectively.

Harvested above-ground biomass differed significantly among the years (Table 2). In control plots, it dropped from c. 100 g m

–2

in 2004 and 2005–83 g m

–2

in 2006 (Fig. 1a). So far it is unclear whether this drop was caused by the dry weather conditions in 2006 (Table 1) or whether it is an early indication of long-term effects of the management change.

′ ∑

H p p

i s

=

i

= i 1

ln

(5)

© The A uthors (2007). J ournal compilation © N ew P hytologist (2007) www .newphytologist.or g N ew P hytologist (2007) 175 : 523–534 Research 527

Table 1 Mean temperatures, sum of precipitation, wind velocity and AOT40, mean ozone (O

3

) concentrations, and mean daily O

3

concentration maxima measured in the O

3

fumigation

experiment at Alp Flix during the growing seasons (April–October) in 2004–06, as well as the contribution of reduced (NH

3

, ) and oxidized (NO

2

, ) N to the annual total N deposition,

according to deposition form (winter, snow pack; summer, wet and dry deposition)

2004 2005 2006

Temperature ( ° C)

Precipitation (mm)

Wind speed (m s

–1

)

Temperature ( ° C)

Precipitation (mm)

Wind speed (m s

–1

)

Temperature ( ° C)

Precipitation (mm)

Wind speed (m s

–1

)

5.6 722.6 3.3 7.2 488.7 3.2 7.0 368.7 3.6

AOT40 (ppm h)

Mean conc.

(ppb)

Daily max.

(ppb)

AOT40 (ppm h)

Mean conc.

(ppb)

Daily max.

(ppb)

AOT40 (ppm h)

Mean conc.

(ppb)

Daily max.

(ppd)

Ambient 13.8* 46.9* 55.9* 15.4 45.7 52.8 14.9 44.9 53.1

Control 12.6** 46.0** 54.7** 11.1 44.0 50.8 11.6 42.1 50.3

O

3

+ 15.2 51.2 61.0 27.4 51.6 64.5 29.5 54.9 70.0

O

3

++ 28.4 64.2 81.5 49.9 65.0 84.7 64.9 74.2 101.7

Snow pack (kg N ha

–1

wi.

–1

)

Wet deposition (kg N ha

–1

su.

–1

)

Dry deposition (kg N ha

–1

su.

–1

)

Snow pack (kg N ha

–1

wi.

–1

)

Wet deposition (kg N ha

–1

su.

–1

)

Dry deposition (kg N ha

–1

su.

–1

)

Snow pack (kg N ha

–1

wi.

–1

)

Wet deposition (kg N ha

–1

su.

–1

)

Dry deposition (kg N ha

–1

su.

–1

)

-N na 0.75 0.53 0.23 1.67 0.45 0.05 1.53 0.64

-N na 0.58 0.05 0.35 1.05 0.06 0.09 0.82 0.06

na, not available; wi., winter; su., summer.

*, Reconstructed for the entire growth period with values from the O

3

-monitoring station at Davos (1590 m asl).

**, Reconstructed for the period of 16 August to 20 October with values from the O

3

-monitoring station at Davos (1590 m asl).

NH

4+

NO

3

NH

4+

NO

3

(6)

Dry matter and proportion of functional groups Nitrogen addition but not O

3

modified the functional group composition with no significant O

3

× N interaction. The group of sedges benefited most from the additional N input and the N-induced increase in biomass became more pronounced over the years (Fig. 1d). In 2006, even the N14 concentration ( + 55%) was significantly different from the N4 concentration (P < 0.05, Fig. S1b). Biomass of sedges was simulated by 124 and 257% in the N29 and N54 treatments, respectively (P < 0.05). In terms of proportions, the fraction of sedges increased from 11% in the control plots to 14% in the N54 treatment in 2004, and more than doubled from 14% (N4) to 31% (N54) in 2006 (Table 2: year × N interaction); thus sedges became the second most abundant functional group in this treatment (Fig. 2).

Grasses as the dominating functional group with an average dry matter yield of around 60 g m

–2

did not benefit from the extra N input (Table S2). As a result, their fraction declined in the N54 treatment progressively from 2004 to 2006 (Fig. 2, Table 2: year × N interaction).

By contrast, forbs with approximately 30 g m

–2

were signif- icantly promoted by N addition, but the stimulating effect declined during the 3 yr (Fig. 1c), and in 2005 and 2006 differences between N treatments disappeared (Fig. S1).The fraction of forbs declined from 27% (2005 and 2006) in the

N4 treatment to 24% (2005) and to 22% (2006) in the N54 treatment (Fig. 2, Table 2: year × N interaction).

Dry matter of legumes ranged between 2 and 3 g m

–2

and accounted for only 2–5% of the total biomass (Fig. 2). Statistical analyses were not feasible because of the heterogeneous distribution among plots, but N addition tended to slightly reduce the fraction of legumes, while neither O

3

nor the O

3

× N interaction caused a detectable response.

Species composition and frequency

The total number of vascular species was 91 (Table S1) with 10% grasses, 7% sedges, 4% legumes, and a majority (79%) of forbs. The dominating species with an average of more than five point-quadrat hits (PQ hits) were the grasses F. violacea and N. stricta, and the sedge C. sempervirens (Table 3). The six most frequent forb species (Ranunculus villarsii, Leontondon helveticus, Ligusticum mutellina, Potentilla aurea, Arnica montana and Gentiana acaulis), and one legume species (Trifolium alpinum) averaged between 0.5 and 1.7 PQ hits, while the majority (80 species) touched the probe on the average

< 0.5 times per monolith (0.12 m

2

). Neither the number of species per monolith nor the Shannon diversity index was influenced by O

3

or N treatments, but the total species number differed significantly among years (Table 2).

Fig. 1 Total above-ground total dry matter (a) and dry matter of the functional groups of grasses (b), forbs (c) and sedges (d) as a function of

ozone (O

3

), nitrogen deposition (N), and year. To allow a clear interpretation, only fitted lines based on the

ANOVA

model (Table S2) are displayed.

(7)

© The Authors (2007). Journal compilation © New Phytologist (2007) www.newphytologist.org New Phytologist (2007) 175: 523–534 Research 529

Corresponding to measured dry matter, N but not O

3

affected the abundance of the most frequent 11 species (Table 3).

In some cases, individual species reflected the performance of the functional group to which they belong. For instance, C.

sempervirens as the most abundant sedge showed an N response similar to the respective functional group. Among the grasses, only the fraction of N. stricta decreased in response to N addition (Table 3), while F. violacea and Helictotrichon versicolor remained unaffected. In the group of forbs, N affected P. aurea positively and A. montana negatively, while all other forbs did not respond to any of the treatments. The legume T. alpinum declined with increasing N addition.

NDVI

Normalized difference vegetation index clearly reflected differences in phenological development. NDVI peaked on 10 July 2005 at values between 0.82 and 0.85, followed by a slight decline owing to the senescing vegetation (Fig. 3a). In 2006, NDVI only reached values between 0.72 and 0.75 without a detectable maximum, thus indicating that the vegetation developed only marginally after the start of the measurements (Fig. 3b). This pattern corresponded to the comparatively low dry matter yield in 2006 (Fig. 1a).

In both years, NDVI increased with higher N concentrations (Fig. 3, Table 4). In the O

3

++ treatment, this effect was less pronounced (nonsignificant trend in 2005) or marginal (2006, Table 4: N × O

3

interaction). In both years, NDVI curves levelled off only in the O

3

++ treatment, which resulted in a significant day × O

3

interaction (Table 4).

Discussion

Elevated N deposition

The measured background N deposition of 3–4 kg N ha

–1

yr

–1

corresponds to deposition rates measured at comparable alpine sites in the central Swiss Alps (Hiltbrunner et al., 2005). Such alpine and subalpine ecosystems together with moorland and heathland habitats in northern Europe (Smith et al., 2000; Fremstad et al., 2005) represent relic sites with little influence from anthropogenic N input in the past. In most of the published studies on herbaceous plant communities, the simulated N deposition rates by far exceeded the range of anthropogenic deposition for the respective study site (Theodose & Bowman, 1997; Soudzilovskaia & Onipchenko, 2005). However, such efforts to shortcut long-term accumulation of low N deposition rates disregard the boosting effects of an abrupt rise in N availability on soil microorganisms and plants. Therefore, long-term experiments, including high- resolution treatments between 5 and 50 kg ha

–1

yr

–1

in regions with low background N deposition, are required to elucidate the effects of chronic low-level N deposition on nutrient poor vegetation (Achermann & Bobbink, 2003).

Table 2 Ef fects of ozone (O

3

), nitr ogen deposition (N), and year on total harvested above-gr ound biomass, the proportion of grasses, forbs and sedges, and on the total number of point-quadrat hits (PQ hits), species number , and Shannon diversity index H ′ in monoliths of a free-air fumigation experiment at Alp Flix in 2004–06 Total dry matter Grasses pr oportion Forbs pr oportion Sedges pr oportion No. of PQ hits Species No. Shannon index H ′ N d.f. D d.f. F N d.f. D d.f. F N d.f. D d.f. F N d.f. D d.f. F N d.f. D d.f. F N d.f. D d.f. F N d.f. D d.f. F Block 2 4 5.83 2 4 1.30 2 4 4.41 2 4 0.85 2 4 4.60 2 4 6.62 2 4 0.25 O

3

24 0.56 2 4 0.52 2 4 0.67 2 4 1.25 2 4 1.17 2 4 0.73 2 4 0.92 N1 169 28.99*** 1 169 9.20** 1 169 1.11 1 169 19.50*** 1 169 23.78*** 1 169 3.12 1 169 0.28 N × N1 169 1.46 1 169 0.29 1 169 0.84 1 169 0.26 1 169 1.37 1 169 0.09 1 169 0.10 Y ear 2 350 65.47*** 2 356 62.05*** 2 352 3.35* 2 352 190.96*** 2 350 110.87*** 2 350 13.22*** 2 358 2.11 Y ear × block 4 350 6.26*** – – – 4 352 4.33** – – – 4 350 6.39*** 4 350 5.15*** – – – Y ear × O

3

4 350 3.44** – – – – – – 4 352 4.24** 4 350 6.22*** 4 350 3.05* – – – Y ear × N ––– 2 356 8.03*** 2 352 12.19*** 2 352 38.39*** – – – – – – – – – Numerator (N d.f.) and denumerator degrees of fr eedom (D d.f.) and F -values ar e displayed. T erms with ‘–’ were not fitted in the particular model. *, P < 0.05; **, P < 0.01; ***, P < 0.001.

(8)

Increased N deposition caused quick and strong changes in dry matter production and species composition. Owing to the lack of suitable experiments in the subalpine zone, these results can only be compared with those of studies in the alpine zone. However, alpine and subalpine grasslands have similar edaphic and climatic conditions and share various component species and characteristics, such as sparse canopies, prevailing slow-growing plants of low stature, or small and often needle-like leaves. In different studies, alpine vegetation did not respond in a consistent way to N addition, with stim- ulated productivity in some cases (Theodose & Bowman, 1997; Soudzilovskaia & Onipchenko, 2005) and no change in others (Bowman et al., 2006). The discrepancies might be

related to differences in N-binding capacity of alpine soils (Körner, 2003), or to a colimitation by other macronutrients such as phosphorus (P) (e.g. in Theodose & Bowman, 1997;

Soudzilovskaia & Onipchenko, 2005).

The N-induced change in vegetation composition was determined largely by an increase in sedges. Productivity of the other functional groups, species number per monolith, and evenness were not negatively affected by the success of sedges, in contrast to decreasing species richness generally found in lowland communities after N addition (Bobbink et al., 1998). A similar increase in the cover of a few responsive species without a concomitant decrease in productivity of other species was observed in alpine plant communities

Fig. 2 Relative contribution to the total harvested above-ground biomass of the four functional groups (grasses, forbs, sedges and legumes) in relation to the nitrogen deposition (N) treatments and the three experimental years (2004–06).

Functional group

Frequency (no. of PQ hits)

Effect of O

3

Effect of N

Festuca violacea Grasses 7.7 ± 1.1 No No

Carex sempervirens Segdes 5.9 ± 0.5 No ++

Nardus stricta Grasses 5.0 ± 0.7 No –

Ranunculus villarsii Forbs 1.7 ± 0.3 No No

Trifolium alpinum Legumes 1.5 ± 0.2 No –

Leontodon helveticus Forbs 1.4 ± 0.1 No No

Ligusticum mutellina Forbs 1.4 ± 0.1 No No

Potentilla aurea Forbs 1.3 ± 0.3 No +

Helictotrichon versicolor Grasses 1.2 ± 0.3 No No

Arnica montana Forbs 0.8 ± 0.1 No –

Gentiana acaulis Forbs 0.6 ± 0.1 No No

Table 3 The 11 most abundant species

observed in the ozone (O

3

) fumigation

experiment at Alp Flix, their functional

group, the 3 yr average frequency per

monolith in the control plots (no. of point-

quadrat hits ± SE), and the extent or direction

of their response to the O

3

and nitrogen

deposition (N) treatments, respectively

(9)

© The Authors (2007). Journal compilation © New Phytologist (2007) www.newphytologist.org New Phytologist (2007) 175: 523–534 Research 531

(Soudzilovskaia & Onipchenko, 2005; Bowman et al., 2006).

It was suggested that limited competition for light in sparse alpine canopies (Körner, 2003) allows unresponsive species to maintain their productivity.

Alpine studies consistently found sedges to benefit more from experimental N addition than grasses and forbs (Theodose

& Bowman, 1997; Soudzilovskaia & Onipchenko, 2005).

This contradicts the common theory (e.g. C-S-R, Grime et al., 1996) that species with a competitive growth strategy should benefit most. But according to Aerts (1999), in nutrient- limited habitats, typical sedge traits such as low nutrient loss through low tissue concentration, slow turnover rates and high resorption efficiency (Shane et al., 2006) are more important for competitive success than investing into high growth rates.

Fig. 3 Normalized difference vegetation index (NDVI, means ± SE) during June and July of 2005 (a) and 2006 (b) in plots exposed to different concentrations and combinations of nitrogen deposition (N) and ozone (O

3

).

NDVI 2005 NDVI 2006

N d.f. D d.f. F N d.f. D d.f. F

Block 2 4 0.42 2 4 4.19*

O

3

2 4 4.18 2 4 8.72**

N 1 170 31.24*** 1 168 25.87***

N × O

3

– – – 2 168 3.46*

Day 1 551 382.97*** 1 503 0.53

Day × day 1 551 509.54*** – – –

Day × O

3

2 551 13.02*** 2 503 6.25**

Day × day × O

3

2 551 10.10*** – – –

Numerator (N d.f.) and denumerator degrees of freedom (D d.f.) and F-values are displayed.

Terms with ‘–’ were not fitted in the particular model.

*, P < 0.05; **, P < 0.01; ***, P < 0.001.

Table 4 Effects of ozone (O

3

), nitrogen

deposition (N), and day on normalized

difference vegetation index (NDVI) in

vegetation monoliths of a free-air fumigation

experiment at Alp Flix in 2005 and 2006

(10)

Elevated O

3

After 3 yr of fumigation, elevated O

3

concentrations had no detectable effects on harvested above-ground dry matter and species composition of the subalpine grassland. The most likely explanation for the absence of a response to O

3

involves specific characteristics of this old, multispecies community.

More pronounced O

3

effects were observed in past studies using individual plants, monocultures or binary mixtures of newly sown plants (Fuhrer et al., 1994). Owing to their high growth rates, high stomatal conductance and high SLA, and in the absence of a large rooting system, plants in the establishing phase are assumed to be most sensitive to O

3

, whereas established communities generally show weaker O

3

responses (Bassin et al., 2006). Transient or absent O

3

effects on dry matter production were also observed in open-top chamber experiments with established vegetation (Evans &

Ashmore, 1992; Thwaites et al., 2006) and were explained by the large heterogeneity of the community composition as a result of edaphic and weather conditions. In a previous free- air fumigation experiment, productivity of old seminatural grassland was reduced only after 4 and 5 yr of exposure to elevated O

3

(Volk et al., 2006). The old communities’ ability to tolerate elevated O

3

concentrations has been related to functional redundancy, interspecific interactions, a large rooting system, and high genetic diversity (Bassin et al., 2006).

Alternatively, the absence of a strong O

3

effect might be the result of the species composition of the monoliths. Low- productivity vegetation such as subalpine grassland is mainly composed of species with a stress-tolerant growth strategy, which have been considered unresponsive to O

3

(Bassin et al., 2006). Adaptation to tolerate low nutrient availability and climatic conditions at the respective sites might protect (sub)alpine plant species from O

3

damage. In particular, the capacity to cope with O

3

-induced oxidative stress could be pronounced in species from elevated sites because of their high amounts of antioxidants as an adaptation to natural oxidative stress by UV-radiation (Wildi & Lutz, 1996) and historically higher average O

3

concentrations (Staehelin et al., 1994). Moreover, the monoliths contained only small propor- tions of legumes as their abundance decreases with elevation, and their altitudinal distribution is limited to below 2600 m asl (Jacot et al., 2000). In a large number of studies, legumes consistently reacted highly sensitively to elevated O

3

concen- trations (Hayes et al., 2006), presumably because of their high relative growth rates and their specific chemical response to oxidative stress (Ranieri et al., 2002). Accordingly, in grass/

clover mixtures as well as in multispecies communities, observed changes in species composition resulted predomi- nantly from a reduction in the legume fraction (Fuhrer et al., 1994; Nussbaum et al., 2000). In the present situation, an O

3

-induced reduction in legumes would not lead to strong compositional changes because of their low abundance. Legume- poor communities could also be less sensitive to O

3

because

they depend less on N supplied by N fixation, which is often impaired by O

3

stress (Rämö et al., 2006).

Lastly, the absence of O

3

effects could be related to the fumigation regime and/or the experimental design. The constant enrichment of background air during the entire growing season led to a seasonal O

3

exposure (AOT40) that was substantially higher than in previous studies (for comparison, see Rämö et al., 2006; Thwaites et al., 2006). Mean O

3

con- centrations in ambient air persistently exceeded 40 ppb, and AOT40 of control plots exceeded by far the critical level for protecting seminatural vegetation of 5 ppm h over a 6 month period (CLRTAP, 2004). However, peak O

3

concentrations above 120 ppb that have been found to affect plants most effectively (Nussbaum et al., 1995) were absent. Finally, the low number of replication at main plot level (O

3

) limits the power of the experiment to detect significant O

3

effects.

Interactive effects of elevated O

3

and N deposition After 3 yr, no interactive effect of O

3

and N deposition on productivity and species composition was detected, thus suggesting that possible modifications in leaf morphology and stomatal conductance associated with increased growth as a result of N addition did not affect the specific sensitivity to O

3

. The alternative hypothesis that increased N availability would reduce O

3

sensitivity could not be tested because of the absence of an O

3

effect in the monoliths receiving no additional N.

An interactive effect of O

3

and N appeared for NDVI. N increased NDVI, but the effect was reduced in the O

3

++ . The N-induced increase in NDVI can be explained by a higher canopy density (PQ hits) and by increased chlorophyll con- tent, as shown in Bell et al. (2004). Since there is no O

3

× N interaction in any measure of productivity, we can assume that the observed O

3

and O

3

× N effects on NDVI was rather the result of declining chlorophyll contents. O

3

-induced reductions in NDVI in crops have been related to visible and nonvisible O

3

damage (Kraft et al., 1996). The leaves of some of the species in the monoliths showed visible O

3

symptoms exclusively in the O

3

++ treatment (e.g. A. montana), but more pronounced early leaf senescence was observed in the form of yellowing leaf tips (e.g. in C. sempervirens, N. stricta). Early leaf senescence is a common symptom of O

3

stress leading to reduced leaf longevity and C assimilation (Grandjean & Fuhrer, 1989). It could thus be expected that on longer timescales a continuous reduction of assimilation might affect the plants’

C budget and, consequently, lead to long-term effects on productivity.

Conclusions

After 3 yr of treatment under realistic environmental conditions,

it can be concluded that N inputs in the range of the current

critical load for alpine and subalpine grassland in Europe of

(11)

© The Authors (2007). Journal compilation © New Phytologist (2007) www.newphytologist.org New Phytologist (2007) 175: 523–534 Research 533

10–15 kg N ha

–1

yr

–1

stimulate the productivity of a Geo- Montani-Nardetum pasture at 2000 m and alter community composition in favour of a few species, mainly sedges. When considering the possibility of N accumulation in the system, it seems likely that under conditions of low N export and nonlimiting P availability in soils, even lower concentrations of N deposition could induce vegetation changes in the long term. Such long-term effects merit further studies.

Productivity and community composition does not respond to 3 yr of increased O

3

exposure above current ambient concentrations. The lack of an O

3

response in spite of high cumulative exposures (AOT40) suggests considerable O

3

tolerance of the system. Inherent community characteristics or the absence of effective peak concentrations could be reasons for the absence of a detectable biomass response.

Elevated O

3

reduced the positive effects of N on greenness of the canopy (NDVI) through accelerated leaf senescence.

This effect on leaf life span may be manifested as growth reductions in the longer term as a result of continuous reduc- tions in C assimilation.

Prolonged treatment of this subalpine grassland will be necessary before drawing firm conclusions related to possible interactive effects of increased N input and elevated O

3

.

Acknowledgements

This work was supported by the Swiss Federal Office of Environment in the framework of the International Cooperative Programme ‘Vegetation’ (ICP Vegetation) of the UNECE CLRTAP. The help of V. Spinas, M. Montani, R. Giger, F.

Contat and the ART field team in setting up the experiment and performing the fieldwork and vegetation analysis is greatly acknowledged. All chemical analyses were performed at the FUB-Research Group for Environmental Monitoring (Rapperswil, Switzerland).

References

Achermann B, Bobbink R. 2003. Empirical critical loads for nitrogen.

Swiss Agency for Environment, Forest and. Landscape SAEFL. Berne, Switzerland.

Aerts R. 1999. Interspecific competition in natural plant communities:

mechanisms, trade-offs and plant-soil feedbacks. Journal of Experimental Botany 50: 29 –37.

Ashmore MR. 2005. Assessing the future global impacts of ozone on vegetation. Plant, Cell & Environment 28: 949 –964.

Barbo DN, Chappelka AH, Somers GL, Miller-Goodman MS, Stolte K.

1998. Diversity of an early successional plant community as influenced by ozone. New Phytologist 138: 653 – 662.

Bassin S, Calanca P, Weidinger T, Gerosa G, Fuhrer E. 2004a. Modeling seasonal ozone fluxes to grassland and wheat: model improvement, testing, and application. Atmospheric Environment 38: 2349 –2359.

Bassin S, Kölliker R, Cretton C, Bertossa M, Widmer F, Bungener P, Fuhrer E. 2004b. Intra-specific variability of ozone sensitivity in Centaurea jacea L., a potential bioindicator for elevated ozone concentrations.

Environmental Pollution 131: 1–12.

Bassin S, Volk M, Fuhrer J. 2006. Factors affecting the ozone sensitivity of

temperate European grasslands: an overview. Environmental Pollution 146:

678 – 691.

Bell GE, Howell BM, Johnson GV, Raun WR, Solie JB, Stone ML. 2004.

Optical sensing of turfgrass chlorophyll content and tissue nitrogen.

Hortscience 39: 1130–1132.

Benton J, Fuhrer J, Gimeno BS, Skärby L, Palmer-Brown D, Ball G, Roadknight C, Mills G. 2000. An international cooperative programme indicates the widespread occurrence of ozone injury on crops. Agriculture Ecosystems and Environment 78: 19 –30.

van den Berg LJL, Tomassen HBM, Roelofs JGM, Bobbink R. 2005.

Effects of nitrogen enrichment on coastal dune grassland: a mesocosm study. Environmental Pollution 138: 77–85.

Bobbink R. 1991. Effects of nutrient enrichment in Dutch chalk grassland.

Journal of Applied Ecology 28: 28 –41.

Bobbink R, Hornung M, Roelofs JGM. 1998. The effects of air-borne nitrogen pollutants on species diversity in natural and semi-natural European vegetation. Journal of Ecology 86: 717–738.

Bowman WD, Gartner JR, Holland K, Wiedermann M. 2006. Nitrogen critical loads for alpine vegetation and terrestrial ecosystem response: are we there yet? Ecological Applications 16: 1183 –1193.

Bowman WD, Steltzer H. 1998. Positive feedbacks to anthropogenic nitrogen deposition in Rocky Mountain alpine tundra. Ambio 27: 514 – 517.

Bungener P, Nussbaum S, Grub A, Fuhrer J. 1999. Growth response of grassland species to ozone in relation to soil moisture condition and plant strategy. New Phytologist 142: 283 –293.

Burnham KP, Anderson DR. 2002. Model selection and multimodel inference:

a practical-theoretic approach. Berlin, Germany: Springer.

CLRTAP. 2004. Manual on methodologies and criteria for modelling and mapping critical loads and levels and air pollution effects, risks and trends.

Convention on Long–Range Transboundary Air Pollution. Online.

[http://www.icpmapping.org.]

Evans PA, Ashmore MR. 1992. The effects of ambient air on a seminatural grassland community. Agriculture Ecosystems and Environment 38: 91–97.

Fremstad E, Paal J, Mols T. 2005. Impacts of increased nitrogen supply on Norwegian lichen-rich alpine communities: a 10-year experiment. Journal of Ecology 93: 471– 481.

Fuhrer J, Shariatmadari H, Perler R, Tschannen W, Grub A. 1994. Effects of ozone on managed pasture II. Yield, species composition, canopy structure, and forage quality. Environmental Pollution 86: 307–314.

Gamon JA, Field CB, Goulden ML, Griffin KL, Hartley AE, Joel G, Penuelas J, Valentini R. 1995. Relationships between NDVI, canopy structure, and photosynthesis in 3 Californian vegetation types. Ecological Applications 5: 28 – 41.

Grandjean A, Fuhrer J. 1989. Growth and leaf senescence in spring wheat (Triticum-aestivum) grown at different ozone concentrations in open-top field chambers. Physiologia Plantarum 77: 389 –394.

Grime JP, Hodgson JG, Hunt R. 1996. Comparative ecology. A functional approach to common British species. London, UK: Chapman & Hall.

Hayes F, Jones MLM, Mills G, Ashmore MR. 2006. Meta-analysis of the relative sensitivity of semi-natural vegetation species to ozone.

Environmental Pollution 146: 754 –762.

Hiltbrunner E, Schwikowski M, Körner C. 2005. Inorganic nitrogen storage in alpine snow pack in the Central Alps (Switzerland). Atmospheric Environment 39: 2249–2259.

Jacot KA, Lüscher A, Nösberger J, Hartwig UA. 2000. Symbiotic N

2

fixation of various legume species along an altitudinal gradient in the Swiss Alps. Soil Biology and Biochemistry 32: 1043 –1052.

Jones MLM, Hayes F, Mills G, Sparks TH, Fuhrer J. 2006. Predicting community sensitivity to ozone, using Ellenberg indicator values.

Environmental Pollution 146: 744 –753.

Körner C. 2003. Alpine plant life. Heidelberg, Germany: Springer.

Kraft M, Weigel HJ, Mejer GJ, Brandes F. 1996. Reflectance measurements of leaves for detecting visible and non-visible ozone damage to crops.

Journal of Plant Physiology 148: 148 –154.

(12)

Matson P, Lohse KA, Hall SJ. 2002. The globalization of nitrogen deposition: consequences for terrestrial ecosystems. Ambio 31: 113 –119.

Mills G, Hayes F, Jones MLM, Cinderby S. 2006. Identifying ozone- sensitive communities of (semi-) natural vegetation suitable for mapping exceedance of critical levels. Environmental Pollution 146: 736 –743.

Nussbaum S, Bungener P, Geissmann M, Fuhrer J. 2000. Plant–plant interactions and soil moisture might be important in determining ozone impacts on grasslands. New Phytologist 147: 327–335.

Nussbaum S, Geissmann M, Fuhrer J. 1995. Ozone exposure-response relationships for mixtures of perennial ryegrass and white clover depend on ozone exposure patterns. Atmospheric Environment 29: 989 –995.

Ojanperä K, Patsikka E, Ylaranta T. 1998. Effects of low ozone exposure of spring wheat on net CO

2

uptake, Rubisco, leaf senescence and grain filling. New Phytologist 138: 451–460.

Palmes ED, Gunnison AF, Dimattio J, Tomczyk C. 1976. Personal sampler for nitrogen-dioxide. American Industrial Hygiene Association Journal 37:

570 –577.

Phoenix GK, Hicks WK, Cinderby S, Kuylenstierna JCI, Stock WD, Dentener FJ, Giller KE, Austin AT, Lefroy RDB, Gimeno BS, Ashmore MR, Ineson P. 2006. Atmospheric nitrogen deposition in world biodiversity hotspots: the need for a greater global perspective in assessing N deposition impacts. Global Change Biology 12: 470 – 476.

Preunkert S, Wagenbach D, Legrand M. 2003. A seasonally resolved alpine ice core record of nitrate: comparison with anthropogenic inventories and estimation of preindustrial emissions of NO in Europe. Journal of Geophysical Research-Atmospheres 108: D21, 4681.

doi: 10.1029/2003JD003475

Rämö K, Kanerva T, Nikula S, Ojanperä K, Manninen S. 2006. Influences of elevated ozone and carbon dioxide in growth responses of lowland hay meadow mesocosms. Environmental Pollution 144: 101–111.

Ranieri A, Scebba F, Castagna A, Guidi L, Soldatini GF. 2002. The impact of ozone stress on herbaceous semi-natural ecosystems: analysis of physiological and biochemical markers related to plant sensitivity to ozone.

Phyton-Annales Rei Botanicae 42: 165 –169.

Rihm B, Kurz D. 2001. Deposition and critical loads of nitrogen in Switzerland. Water Air and Soil Pollution 130: 1223–1228.

Sanz J, Muntifering RB, Bermejo V, Gimeno BS, Elvira S. 2005. Ozone and increased nitrogen supply effects on the yield and nutritive quality of Trifolium subterraneum. Atmospheric Environment 39: 5899 –5907.

Schieving F, Poorter H. 1999. Carbon gain in a multispecies canopy: The role of specific leaf area and photosynthetic nitrogen-use efficiency in the tragedy of the commons. New Phytologist 143: 201–211.

Shane MW, Cawthray GR, Cramer MD, Kuo J, Lambers H. 2006.

Specialized ‘dauciform’ roots of Cyperaceae are structurally distinct, but functionally analogous with ‘cluster’ roots. Plant, Cell & Environment 29:

1989–1999.

Smith RI, Fowler D, Sutton MA, Flechard C, Coyle M. 2000.

Regional estimation of pollutant gas dry deposition in the UK:

model description, sensitivity analyses and outputs. Atmospheric Environment 34: 3757–3777.

Soudzilovskaia NA, Onipchenko VG. 2005. Experimental investigation of fertilization and irrigation effects on an alpine heath, northwestern Caucasus, Russia. Arctic Antarctic and Alpine Research 37: 602– 610.

Staehelin J, Thudium J, Buehler R, Volz A, Graber W. 1994. Trends in surface ozone concentrations at Arosa (Switzerland). Atmospheric Environment 28: 75 –87.

Stampfli A. 1991. Accurate determination of vegetational change in meadows by successive point quadrant analysis.

Vegetatio 96: 185 –194.

Stevens CJ, Dise NB, Mountford JO, Gowing DJ. 2004. Impact of nitrogen deposition on the species richness of grasslands. Science 303:

1876 –1879.

Theodose TA, Bowman WD. 1997. Nutrient availability, plant abundance, and species diversity in two alpine tundra communities. Ecology 78: 1861–

1872.

Thwaites RH, Ashmore MR, Morton AJ, Pakeman RJ. 2006. The effects of tropospheric ozone on the species dynamics of calcareous grassland.

Environmental Pollution 144: 500 –509.

Tucker CJ. 1979. Red and photographic infrared linear combinations for monitoring vegetation. Remote Sensing of Environment 8: 127–150.

Vitousek PM, Aber JD, Howarth RW, Likens GE, Matson PA, Schindler DW, Schlesinger WH, Tilman DG. 1997. Human alteration of the global nitrogen cycle: sources and consequences. Ecological Applications 7:

737–750.

Volk M, Bungener P, Contat F, Montani M, Fuhrer J. 2006. Grassland yield declined by a quarter in 5 years of free-air ozone fumigation. Global Change Biology 12: 74–83.

Volk M, Geissmann M, Blatter A, Contat F, Fuhrer J. 2003. Design and performance of a free-air exposure system to study long-term effects of ozone on grasslands. Atmospheric Environment 37: 1341–1350.

Volz A, Kley D. 1988. Evaluation of the Montsouris series of ozone measurements made in the 19th-century. Nature 332: 240 –242.

Whitfield CP, Davison AW, Ashenden TW. 1998. The effects of nutrient limitation on the response of Plantago major to ozone. New Phytologist 140:

219–230.

Wildi B, Lutz C. 1996. Antioxidant composition of selected high alpine plant species from different altitudes. Plant, Cell & Environment 19: 138 –146.

Supplementary Material

The following supplementary material is available for this article online:

Fig. S1 Means ( ± SE) of total above-ground dry matter (g m

–2

) and dry matter of the functional groups (grasses, forbs, and sedges) in the years 2005 (a) and 2006 (b). Back-transformed values from

ANOVA

are shown. Letters indicate significant differences at P < 0.05 (Tukey test for multiple comparisons) among the N treatments within each functional group.

Table S1 List of species recorded by point-quadrat method in the Geo-Montani-Nardetum monoliths exposed in the fumigation experiment on Alp Flix, 2000 m asl

Table S2 Effects of O

3

, N, and year on harvested above- ground biomass of grasses, forbs and sedges in monoliths of a free-air fumigation experiment at Alp Flix in 2004 – 06 This material is available as part of the online article from:

http://www.blackwell-synergy.com/doi/abs/10.1111/

j.1469-8137.2007.02140.x

(This link will take you to the article abstract).

Please note: Blackwell Publishing are not responsible for

the content or functionality of any supplementary materials

supplied by the authors. Any queries (other than missing

material) should be directed to the journal at New Phytologist

Central Office.

(13)

Supplementary Material

Table S1 List of species recorded by point-quadrat method in the Geo-Montani-Nardetum monoliths exposed in the fumigation experiment on Alp Flix, 2000 m asl

Species name

Achillea millefollium L. Hieracium hoppeanum Schult.

Agrostis capillaris L. Homogyne alpina (L.) Cass.

Agrostis rupestris All. Hypochaeris uniflora Vill.

Alchemilla fissa aggr. Leontodon helveticus Mérat

Alchemilla glabra aggr. Leontodon hispidus L.

Alchemilla hybrida L. Leucanthemum vulgare Lam.

Alchemilla xanthochlora aggr. Ligusticum mutellina (L.) Crantz Androsace chamaejasme Wulfen Loiseleuria procumbens (L.) Desv.

Anemone narcissifolia L. Lotus alpinus (DC.) Rämönd

Antennaria dioica (L.) Gaertn. Luzula multiflora (Retz.) Lej.

Anthoxanthum alpinum Á. & D. Löve Myosotis alpestris F. W. Schmidt

Anthyllis vulneraria L. Nardus stricta L.

Arnica montana L. Nigritella nigra auct.

Aster bellidiastrum (L.) Scop. Pedicularis tuberosa L.

Bartsia alpina L. Phleum rhaeticum (Humphries) Rauschert

Biscutella laevigata L. Phyteuma orbiculare L.

Briza media L. Plantago alpina L.

Botrychium lunaria (L.) Sw. Plantago atrata Hoppe

Campanula barbata L. Poa alpina L.

Campanula scheuchzeri Vill. Polygonum viviparum L.

Cerastium fontanum Baumg. Potentilla aurea L.

Carex sempervirens Vill. Potentilla erecta (L.) Raeusch.

Carex caryophyllea Latourr. Primula farinosa L.

Carex ericetorum Pollich Primula integrifolia L.

Carex montana L. Pulmonaria australis (Murr) W. Sauer

Carex ornithopoda Willd. Pulsatilla alpina (L.) Delarbre subsp. apiifolia Nyman

Carlina acaulis L. Pulsatilla vernalis (L.) Mill.

Centaurea nervosa Willd. Ranunculus villarsii DC.

Cerastium alpinum L. Salix spec.

Coeloglossum viride (L.) Hartm. Salix herbacea L.

Crepis aurea (L.) Cass. Scabiosa columbaria L.

Crepis pontana (L.) Dalla Torre Selaginella spec.

Crocus albiflorus Kit. Silene nutans L.

Daphne striata Tratt. Soldanella alpina L.

Elyna myosuroides (Vill.) Fritsch Solidago virgaurea L. subsp. minuta (L.) Arcang.

Euphrasia minima Schleich. Thesium alpinum L.

Lloydia serotina (L.) Rchb. Thymus serpyllum aggr.

Festuca violacea Gaudin Tofieldia spec.

Galium anisophyllon Vill. Trifolium alpinum L.

Gentiana acaulis L. Trifolium pratense L. subsp. nivale (W. D. J. Koch) Arcang.

Gentiana campestris L. Trollius europaeus L.

Gentiana verna L. Vaccinium myrtillus L.

Geum montanum L. Vaccinium uliginosum L.

Gymnadenia conopsea (L.) R. Br. Vaccinium vitis-idaea L.

Helictotrichon versicolor (Vill.) Pilg. Viola calcarata L.

Helianthemum nummularium (L.) Mill.

(14)

sedges in monoliths of a free-air fumigation experiment at Alp Flix in 2004–06

Grasses dry matter (g m

-2

) Forbs dry matter (g m

-2

) Sedges dry matte (g m

-2

) r N

df D

df F

N df

D

df F

N df

D

df F

Block 2 4 2.58 2 4 6.63 2 4 1.91 O

3

2 4 0.78 2 4 0.89 2 4 1.18

N 1 167 2.83 1 169 5.77* 1 169 39.9***

N × N 1 167 1.30 1 169 2.58 1 169 0.02 N × O

3

2 167 0.85 - - - - - -

Year 2 344 112.28*** 2 348 51.38*** 2 352 101.04***

Year × Block 4 344 3.39** 4 348 9.32*** 4 352 3.66**

Year × O

3

4 344 1.37 4 348 3.98** - - - Year × N 2 344 0.83 2 348 3.22* 2 352 40.46***

Year × N× O

3

4 344 2.35 - - - - - -

Numerator (N df) and denumerator degrees of freedom (D df) and F-values are displayed.

Terms with ‘-’ were not fitted in the particular model. *, P < 0.05; **, P < 0.01; ***, P <

0.001.

(15)

Abbildung

Table 1 Mean temperatures, sum of precipitation, wind velocity and AOT40, mean ozone (O 3 ) concentrations, and mean daily O 3  concentration maxima measured in the O 3  fumigation
Fig. 1 Total above-ground total dry matter (a) and dry matter of the functional groups of grasses (b), forbs (c) and sedges (d) as a function of  ozone (O 3 ), nitrogen deposition (N), and year
Table 2Effects of ozone (O 3), nitrogen deposition (N), and year on total harvested above-ground biomass, the proportion of grasses, forbs and sedges, and on the total number of point-quadrat  hits (PQ hits), species number, and Shannon diversity index H′
Fig. 2 Relative contribution to the total  harvested above-ground biomass of the four  functional groups (grasses, forbs, sedges and  legumes) in relation to the nitrogen  deposition (N) treatments and the three  experimental years (2004–06)
+3

Referenzen

ÄHNLICHE DOKUMENTE

Figure 4 shows the modelled annual average surface ozone concentration in the five major HTAP Tier 1 regions in the Northern Hemisphere (Europe; Russia, Belarus, and the Ukraine;

Using a three- dimensional global chemistry transport model, Butler and Lawrence (2009) applied this perturbation method to show that the global megacity impact on tropospheric

Especially in windy conditions with wind speeds ≥ 2 m s -1 , as indicated by transport of mean turbulent kinetic energy TKE, high kurtosis and negative skewness of the vertical

1 Relationship between changes in the CO a concentration of the intercellular spaces of the leaf mesophyll, Aci, in the propor- tion of phosphoenol pyruvate carboxylase

The aim of this study was to explore the effect of temperature and increased N availability created by the presence of N 2 -fixing trees and tall shrubs on soil N 2 O emissions in

Previous studies investigating the effect of grazing intensities on insect diversity often only compared two stocking rates (Kruess &amp; Tscharntke 2002;

Summary of analyses for the effects of climate scenario (CS), irrigation, and N deposition on aboveground biomass yield of subalpine grassland over 4 experimental years.. F tests

Lindsey Rustad, Northern Research Station, USDA Forest Service, Durham, NH, United States; Lourdes Morillas, Centre for Ecology, Evolution and Environmental Changes, Faculdade