SFB 823
WTA-WTP disparity: The role of perceived realism of the valuation setting
Discussion Paper Manuel Frondel, Stephan Sommer,
Lukas Tomberg
Nr. 5/2019
WTA-WTP Disparity: The Role of Perceived Realism of the Valuation Setting
Manuel Frondel
∗, Stephan Sommer
†, Lukas Tomberg
‡March 4, 2019
Abstract
Based on a survey among more than 5,000 German households and a single-binary choice experiment in which we randomly split the respondents into two groups, this paper elicits both households’ willingness to pay (WTP) for power supply security and their willingness to accept (WTA) compensations for a reduced security level.
In accord with numerous empirical studies, we find that the mean WTA value sub- stantially exceeds the mean WTP bid, in our empirical example by a factor of 3.56.
Yet, the WTA-WTP ratio decreases to 2.35 among respondents who believe that the hypothetical valuation setting is likely to become true. Conversely, the WTA-WTP ratio increases to 3.81 among respondents who deem the setting unlikely. Given this discrepancy, we conclude that to diminish the WTA-WTP disparity resulting from stated-preference surveys at least to some extent, inquiring about respondents’ per- ception on the realism of the valuation setting is an essential element of any survey design.
Keywords: Willingness-to-pay, willingness-to-accept, stated preferences.
JEL codes: D12, H41, Q41.
Acknowledgements: We are immensely grateful for comments and suggestions by Colin Vance. This work has been supported by the Collaborative Research Center “Statistical Modeling of Nonlinear Dynamic Processes” (SFB 823) of the German Research Founda- tion (DFG), within Project A3, “Dynamic Technology Modeling”.
∗RWI Leibniz Institute for Economic Research and Ruhr-Universit¨at Bochum
†RWI Leibniz Institute for Economic Research
‡RWI Leibniz Institute for Economic Research and Ruhr Graduate School in Economics
1 Introduction
To gauge the utility that consumers draw from a public good, valuation studies typ- ically elicit the consumers’ willingness to pay (WTP) for the good or, alternatively, the willingness-to-accept (WTA) a compensation to forgo it (Carson et al., 2001). Although economic theory suggests that in the absence of income effects, both measures are equiv- alent (Willig, 1976), empirical findings indicate a strong disparity, with WTA values often exceeding WTP bids substantially – see, for instance, the review studies by Horowitz and McConnell (2002) and Tunc¸el and Hammitt (2014).
Various explanations for this disparity have been proposed in the literature. A fre- quent argument is that its causes are rooted in human preferences. For instance, a promi- nent explanation for the WTA-WTP disparity is the endowment effect (Kahneman et al., 1990; Thaler, 1980), according to which individuals have a higher valuation of goods they already own than those they have yet to purchase. Another prominent explanation is provided by Hanemann (1991), who demonstrates from a theoretical perspective that the divergence between WTA and WTP depends on the degree of substitutability between goods, with a good with close substitutes exhibiting a small WTA-WTP disparity, whereas large disparities would emerge for goods with imperfect substitutes. In an experimental auction market, Shogren et al. (1994) find empirical evidence that for a non-market good with imperfect substitutes, such as a reduced health risk, this divergence is persistent.
Plott and Zeiler (2005), however, argue that there is no consensus on whether the
WTA-WTP disparity is a fundamental manifestation of human preferences. Instead, the-
ses authors suggest that the disparity may be due to the misconception of a valuation
study with respect to the underlying elicitation mechanism. In a similar vein, Zhao and
Kling (2001) suggest that the particularities of a survey or experiment, including lim-
ited information on the good under scrutiny and the impossibility to postpone a pur-
chasing decision in such a setting, induce commitment costs that may increase the stated
WTA value and diminish the stated WTP bid, thereby leading to the WTA-WTP disparity.
These commitment costs arise because respondents are forced to commit to the purchase of a good before all relevant information is available.
Based on a survey among more than 5,000 German households and a single-binary choice experiment within a hypothetical setting in which we randomly split the respon- dents into two experimental groups, either the WTA or the WTP group, this paper adds to this line of inquiry by eliciting households’ WTA and WTP for power supply security.
As hypothetical bias is a major caveat of hypothetical elicitation formats (e.g. Groothuis and Miller, 1994, Harrison and Rutstr ¨om, 2008), we correct for this bias by taking into ac- count the degree to which respondents perceive their answers as consequential in terms of policy-making, thereby following recent research (Carson and Groves, 2007; Carson et al., 2014; Vossler et al., 2012), which demonstrates that accounting for the perceived policy consequentiality of the survey is a prerequisite for the truthful elicitation of prefer- ences.
In accordance with numerous studies originating from other areas (Beenstock et al., 1998; Blass et al., 2010; Carlsson and Martinsson, 2008; Carlsson et al., 2011; Hensher et al., 2014), we find a large WTA-WTP discrepancy. In fact, in line with Praktiknjo (2014), who also investigates German households’ WTA and WTP for power supply security, in our empirical example, the mean WTA value substantially exceeds the mean WTP bid, by a factor of 3.56. Yet, the WTA-WTP ratio decreases to 2.35 if we consider only respondents who believe that the hypothetical valuation setting is likely to become reality. Conversely, the WTA-WTP ratio increases to 3.81 among respondents who deem the setting unrealis- tic. It bears noting that our results are non-causal in nature, as stated perceptions obtained by follow-up questions do not allow for causal inference (Czajkowski et al., 2017).
11A potential causal approach would be to employ an instrumental variable for stated perception that is correlated with perception, but uncorrelated with WTA and WTP. A candidate instrument, however, is not available in our case, as well as in many similar studies (e.g. Vossler et al., 2012; Vossler and Watson, 2013;
Interis and Petrolia, 2014).
Given our finding of a large WTA-WTP discrepancy, we conclude that, first, ignoring the respondents’ perception about the realism of the hypothetical valuation setting would result in overestimating WTA values, but underestimating WTP bids, and, hence, an ex- cessive WTA-WTP disparity. Second, our finding supports the proposition of Plott and Zeiler (2005) that human preferences are not the only source giving rise to this disparity.
Third, with respect to welfare analysis and policy advice, we further conclude that know- ing the reason underlying the WTA-WTP disparity is of crucial importance: If the dispar- ity is primarily the result of the misconception of a valuation study and would vanish if the misconception was to be avoided, then policy measures based on stated WTA values might be too expensive, while measures implemented on the basis of stated WTP may be too conservative. For our empirical example, this implies that policy-makers would rather take the risk of temporary blackouts than heavily investing in grid expansion and energy storage technologies to maintain supply security, whose costs have to be borne by the electricity consumers.
The following three sections describe the database, the design of the experiment, and the econometric approach. Thereafter, we present the results of our analysis. The final section summarizes and concludes.
2 Data
To elicit people’s preferences for power supply security, we draw on survey data that
was gathered in collaboration with the professional survey institute forsa. forsa maintains
a panel of German households that is representative of the German-speaking population
aged 14 and above and a state-of-the-art tool that allows panelists to fill out the question-
naire using either a television or the internet. Panelists can interrupt and continue the
survey at any time. Between December 23, 2015, and February 19, 2016, 5,640 household
heads were asked a variety of energy-related questions, such as their experience with
power outages (Table 1).
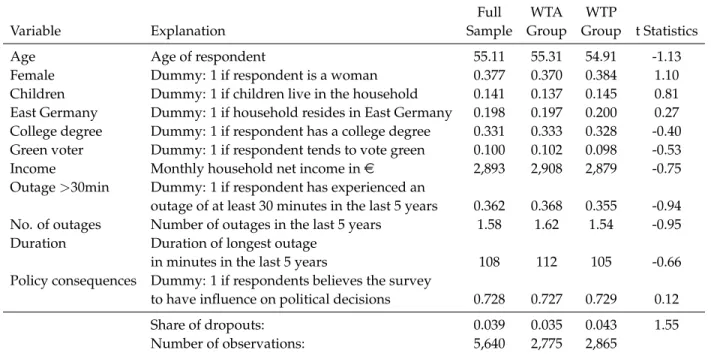
Table 1: Summary Statistics
Full WTA WTP
Variable Explanation Sample Group Group t Statistics
Age Age of respondent 55.11 55.31 54.91 -1.13
Female Dummy: 1 if respondent is a woman 0.377 0.370 0.384 1.10
Children Dummy: 1 if children live in the household 0.141 0.137 0.145 0.81 East Germany Dummy: 1 if household resides in East Germany 0.198 0.197 0.200 0.27 College degree Dummy: 1 if respondent has a college degree 0.331 0.333 0.328 -0.40 Green voter Dummy: 1 if respondent tends to vote green 0.100 0.102 0.098 -0.53
Income Monthly household net income ine 2,893 2,908 2,879 -0.75
Outage>30min Dummy: 1 if respondent has experienced an
outage of at least 30 minutes in the last 5 years 0.362 0.368 0.355 -0.94 No. of outages Number of outages in the last 5 years 1.58 1.62 1.54 -0.95 Duration Duration of longest outage
in minutes in the last 5 years 108 112 105 -0.66
Policy consequences Dummy: 1 if respondents believes the survey
to have influence on political decisions 0.728 0.727 0.729 0.12
Share of dropouts: 0.039 0.035 0.043 1.55
Number of observations: 5,640 2,775 2,865
Note: Based on the t statistics reported in the last column, we test on differences in variable means across WTP and WTA groups.
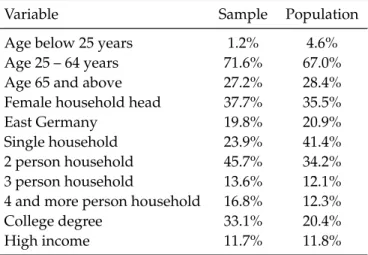
About 38% of the participants are women, which is likely due to our decision to ask the household head to participate, as household heads typically make the financial decisions at the household level. Obviously, this percentage does not reflect the share of women in the German population, but it closely fits the percentage of female household heads in Germany (see Table A1 in the appendix). Around a third of the sample holds a college degree, whereas this only holds for about one fifth of the household heads in the census data. Consequently, the typical education bias (Andor et al., 2014) is also present in our sample, and, thus, our results are not representative for the German population.
To control for environmental attitudes, we construct a binary variable that equals unity if a respondent tends to vote for Germany’s green party. This holds true for about 10%
of the respondents, which is broadly in line with the result of the most recent national
election in 2017. As experience with power outages might matter for the preferences on
power supply security (e.g. Carlsson et al., 2011), we asked several questions pertaining
to this issue. For instance, 36.2% of the respondents indicate that, during the last five years, they experienced at least one outage that lasted at least 30 minutes. On average, the outages lasted for 108 minutes.
Finally, as we employ the consequentiality approach proposed by Vossler and Watson (2013) as a robustness check, it bears highlighting that about three quarters of the sample believes that the survey is consequential with respect to policy-making (see the last row of Table 1). This belief was measured on a 5-point Likert scale, with the options ranging from “very unlikely” to “very likely” – the corresponding question is reported in the appendix. In accordance with Vossler and Watson (2013), we recode the answers to this question by creating a dummy variable that equals zero if a respondent chooses the option
“very unlikely” and unity otherwise.
3 Experimental Design
To uncover the value that households ascribe to power supply security, we employed an experimental design in which respondents were randomly split into two experimental groups, the WTA and the WTP group. At the outset of the experiment, all participants were informed that for reasons of power supply security, it might be reasonable to discon- nect individual households from the grid. Following the recommendation of the NOAA- Panel (Arrow et al., 1993) and the recent literature (Carson and Groves, 2007; Carson et al., 2014), we then asked a single binary-choice question that differs across experimen- tal groups with respect to the underlying preference measure (for the exact questions, see the appendix). Participants of the WTA group were requested to state their willingness to accept a monthly compensation of ex, with x ∈ { 3, 6, 9 } , to allow the grid operator to once in a year disconnect the household from the grid for a maximum of four hours without prior notification. The concrete amount of x was assigned in a random manner.
Participants of the WTP group were asked whether they are willing to pay a randomly
given amount of ex, with x ∈ { 3, 6, 9 } , to avoid such a power outage. Note that the ran- domly assigned values of e3 to e9 per month, that is, e36 to e108 per year, are within the range of those mean WTP and WTA values that are found in other valuation studies of four-hour power outages for Germany (Praktiknjo, 2014; Schubert et al., 2013).
The t statistics reported in the last column of Table 1 indicate that randomization was successful: There are no statistically significant deviations in the means of the covariates across both experimental groups, leading to the conclusion that our empirical results are not driven by distinct distributions of the explanatory variables.
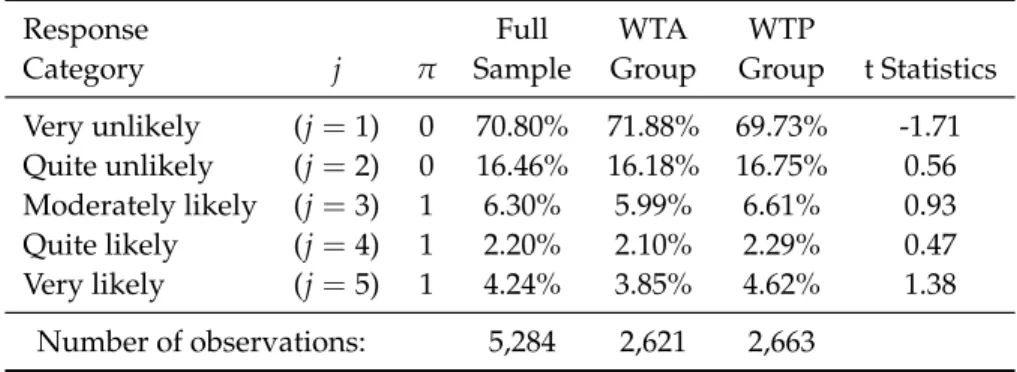
Subsequent to the valuation questions described above, we asked the respondents about their perceptions on the likelihood that their electricity supplier will actually make such an offer, with a response scale ranging from j = 1 (very unlikely) to j = 5 (very likely). Exploiting this information on the households’ perception about the realism of the hypothetical setting plays a key role in our empirical analysis. Around 70% of the respondents deem any such offer as very unlikely (Table 2), while only a minority of 4%
of the respondents believes that such an offer is very likely to become true. As indicated by the t statistics reported in the last column of Table 2, there are hardly any differences in the respondents’ perceptions across the WTA and WTP groups. Moreover, the perceived probability that any such offer actually becomes reality does not vary significantly across hypothetical bids (see Table A2 in the appendix).
In what follows, we further split the respondents into two additional groups: those who believe that the offer from the electricity supplier is unlikely (j = 1, 2) and those who perceive that the offer is likely, at least to some extent (j = 3, . . . , 5). Accordingly, as the central variable employed in our empirical approach, we define a dummy variable π that equals unity if j = 3, . . . , 5 and equals zero otherwise (see Table 2).
22Analogous to the treatment of perceived political consequentiality in Vossler and Watson (2013), we alternatively have assigned only those respondents to the first group who deem the offer very unlikely (j=1), with the second group comprising the remaining respondents (j=2, . . . , 5). This robustness check is presented in Tables A3 and A4 in the appendix. The results are the same in qualitative terms.
Table 2: Responses to the Question: “What do you think: How likely is it that your electricity supplier approaches you with such an offer?”
Response Full WTA WTP
Category j π Sample Group Group t Statistics
Very unlikely (j=1) 0 70.80% 71.88% 69.73% -1.71 Quite unlikely (j=2) 0 16.46% 16.18% 16.75% 0.56 Moderately likely (j=3) 1 6.30% 5.99% 6.61% 0.93 Quite likely (j=4) 1 2.20% 2.10% 2.29% 0.47
Very likely (j=5) 1 4.24% 3.85% 4.62% 1.38
Number of observations: 5,284 2,621 2,663
Note: Based on the t statistics reported in the last column, we test on differences in variable means across WTP and WTA groups.
4 Econometric Approach
While the focus of our analysis is on the effect of the perception about the realism of the valuation setting reflected by π on WTA and WTP, it is clear that a simple compari- son of groups for which π either equals zero or unity, as is presented in the subsequent section, will not yield the causal effect of π on WTA and WTP, as π is likely to be endoge- nous: while it is unlikely that all confounders are observed, both groups may differ in unobservable characteristics. Hence noting that potential endogeneity is a caveat of our analysis, it seems unlikely, however, that endogeneity completely invalidates our results.
To obtain estimates of the mean WTA and WTP values, simply taking means from the summary statistics is not an option, as we have employed a discrete-choice valuation design. Instead, we use the approach developed by Bishop and Heberlein (1979) and profoundly analyzed by Buckland et al. (1999), Hanemann (1984), and Hanemann and Kanninen (2001). This approach rests on estimating a logistic regression model, such as the following Model (1):
Pr ( y
i= 1 | bid
i, π
i, x
i) = Λ [ β
0+ β
1ln ( bid
i) + β
2π
i+ β
xTx
i] , (1)
where y
iis a binary indicator that equals unity if respondent i is willing to accept e3, e6,
or e9 as a compensation for an outage or is willing to pay either of these amounts for avoiding an outage and zero otherwise. Λ is the logistic cumulative distribution function (cdf), where the hypothetical compensation or payment (bid) is included in logarithmic terms. By using this logarithmic transformation, it is ruled out that the resulting mean WTA and WTP values become negative, which is a frequent problem when analyzing discrete-choice contingent valuation data (Haab and McConnell, 1997). In fact, this trans- formation ensures that the probability of accepting a compensation offer approaches zero if the proposed compensation goes to zero. In the WTP case, it ensures that the proba- bility of accepting the offer approaches unity if the offer price goes to zero (Hanemann, 1989). Vector x subsumes the covariates reported in Table 1, the βs are coefficients to be estimated, and π denotes a dummy variable that equals unity if a respondent deems it likely to obtain a compensation or payment offer from the electricity supplier as described in the previous section.
Using the conditional density function of y given by Model (1), the mean WTA, which renders a respondent indifferent between accepting the offered compensation or declin- ing it, can be estimated on the basis of the following expression (Hanemann, 1984):
E [ WTA
i| π
i, x
i] = Z
∞0
Λ [ β ˆ
0+ β ˆ
1ln ( bid
i) + β ˆ
2π
i+ β ˆ
xTx
i] dbid
i, (2)
where ˆ β
0, ˆ β
1, ˆ β
2and ˆ β
xdenote the coefficient estimates obtained from the logit regression
of Model (1). Building upon Buckland et al. (1999) and Expression (2), we compute the
mean WTA for each observation, that is, at individual-specific values of π and x, taking
into account that the probability Pr ( y
i= 1 ) of accepting an offer is a function of all possi-
ble bids (Parzen, 1960; Hanemann, 1984): Pr ( y
i= 1 ) = Λ
i( bid ) . Integrating the resulting
cumulative density function Λ
i( bid ) over the entire range of bids yields the observation-
specific mean WTA: E [ WTA
i] . Lastly, we arrive at sample means for WTA by averaging
E [ WTA
i] over all observations.
Because the probability Pr ( y
i= 1 ) of accepting an offer is increasing in the bids in the WTA case, but decreasing in case of WTP, the formula for the mean WTP differs from Equation (2) for the mean WTA – see the theoretical and graphical motivation for this differentiation provided by Hanemann (1984):
E [ WTP
i| π
i, x
i] = Z
∞0
n
1 − Λ [ β ˆ
0+ β ˆ
1ln ( bid
i) + β ˆ
2π
i+ β ˆ
3Tx
i] o dbid
i, (3)
but the way to arrive at sample means for WTP is identical to that described above.
Following Bishop and Heberlein (1979), to avoid obtaining unreasonably high esti- mates of mean WTA and WTP values, we only integrate Equations (2) and (3) up to the highest bid of e9, rather than integrating up to infinity, thereby providing conservative estimates of the mean values (Hanemann and Kanninen, 2001). This approach is in line with the NOAA-Panel’s recommendation to prefer a conservative estimate over an esti- mate that is likely to be too large (Arrow et al., 1993).
5 Results
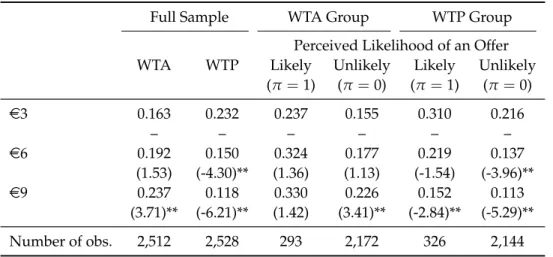
Focusing first on the descriptive results, in line with economic theory, the willingness to accept compensations for tolerating a power outage increases with the compensation level, yet the difference between the compensations of e6 and e3 is indistinguishable in statistical terms (first column of Table 3). Conversely, the willingness to pay for avoiding a power outage decreases with the amounts that respondents have to pay (second column of Table 3).
Turning next to the subsamples of households that deem compensation offers and
WTP payments to be realistic scenarios (third and fifth column), we find the rates of ac-
cepting any such offers to be notably higher than in the full sample. In contrast, the
acceptance rates are lowest among those individuals who believe that any such offer is
Table 3: Percentage of Yes Responses to Randomly Given Compensation Offers (WTA) and WTP Payments
Full Sample WTA Group WTP Group
Perceived Likelihood of an Offer WTA WTP Likely Unlikely Likely Unlikely
(π=1) (π=0) (π=1) (π=0)
e3 0.163 0.232 0.237 0.155 0.310 0.216
– – – – – –
e6 0.192 0.150 0.324 0.177 0.219 0.137
(1.53) (-4.30)** (1.36) (1.13) (-1.54) (-3.96)**
e9 0.237 0.118 0.330 0.226 0.152 0.113
(3.71)** (-6.21)** (1.42) (3.41)** (-2.84)** (-5.29)**
Number of obs. 2,512 2,528 293 2,172 326 2,144
Note: t statistics for testing differences in means relative to thee3 group are in parentheses. ** and * indicate statistical significance at the 1% and 5% level, respectively.
unlikely (fourth and sixth column). Overall, the pattern that acceptance rates increase with the compensation level and decrease with the payment amount is to be observed for both the full sample and the subsamples.
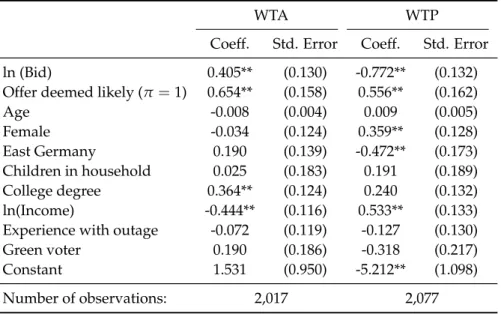
To obtain mean values for WTA and WTP, we have employed the approach developed by Bishop and Heberlein (1979) and have separately estimated Model (1) for each exper- imental group. The estimation results reported in Table 4 indicate that if a respondent believes that the hypothetical offer is likely to become reality, both the WTP for avoiding an outage and the probability of accepting any compensation increase, implying a lower mean WTA.
With a few exceptions, socio-economic characteristics do not have a significant bearing
on the probability to accept a compensation for tolerating an unplanned outage of four
hours. One of these exceptions is household income. In line with economic theory, the
probability to accept any compensation decreases with income, whereas the willingness
to pay for the avoidance of an outage increases with income. In contrast, the experience
with outages does not affect the willingness to pay for power supply security, nor does
it impact the willingness to accept compensations for a diminished supply security. This
Table 4: Logit results for Model (1), estimated separately for the WTA and WTP Group
WTA WTP
Coeff. Std. Error Coeff. Std. Error
ln (Bid) 0.405** (0.130) -0.772** (0.132)
Offer deemed likely (π=1) 0.654** (0.158) 0.556** (0.162)
Age -0.008 (0.004) 0.009 (0.005)
Female -0.034 (0.124) 0.359** (0.128)
East Germany 0.190 (0.139) -0.472** (0.173)
Children in household 0.025 (0.183) 0.191 (0.189)
College degree 0.364** (0.124) 0.240 (0.132)
ln(Income) -0.444** (0.116) 0.533** (0.133)
Experience with outage -0.072 (0.119) -0.127 (0.130)
Green voter 0.190 (0.186) -0.318 (0.217)
Constant 1.531 (0.950) -5.212** (1.098)
Number of observations: 2,017 2,077
Note: ** and * indicate statistical significance at the 1% and 5% level, respectively.
result seems to be at odds with the empirical literature, as for instance Carlsson et al.
(2011) find that the WTP for power supply security increases after an outage. However, that study was unique in that it followed a severe storm in Sweden from which 15% of the households suffered from power outages of up to three weeks, which many of the respondents presumably recalled.
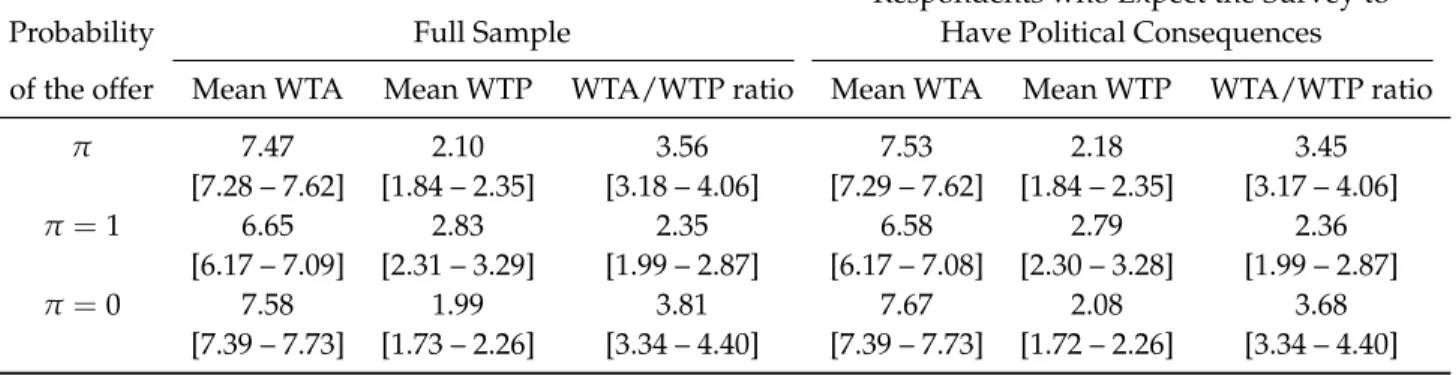
By inserting the coefficient estimates reported in Table 4 into Equations (2) and (3), we are able to predict WTA and WTP values for each household observation. Averaging over all individual values yields the mean WTA and WTP for power supply security and a mean WTA-WTP ratio of 3.56 (see first row of Table 5). Our empirical results indicate that this ratio critically depends on: (i) whether a respondent believes that the hypothetical setting is likely to become true and (ii) the hypothetical compensation that is offered for incurring power outages is realistic. Among respondents who deem the offer likely, that is, for π
i= 1, the mean WTA-WTP ratio shrinks to 2.35.
In contrast, among respondents who deem any such offer as unlikely (π
i= 0), the
mean WTA-WTP ratio increases to 3.81. It bears noting that the differences in mean WTA
across π values, as well as the differences in mean WTP, are statistically significant, as can be seen from the 95% confidence intervals presented in Table 5. Similar results are obtained when we follow the recent literature (Carson and Groves, 2007; Vossler et al., 2012) and take into account the respondents’ perceived consequentiality with respect to policy making (see the right-hand panel of Table 5 and Table A5 in the appendix).
Table 5: Mean Values for WTA and WTP
Respondents who Expect the Survey to
Probability Full Sample Have Political Consequences
of the offer Mean WTA Mean WTP WTA/WTP ratio Mean WTA Mean WTP WTA/WTP ratio
π 7.47 2.10 3.56 7.53 2.18 3.45
[7.28 – 7.62] [1.84 – 2.35] [3.18 – 4.06] [7.29 – 7.62] [1.84 – 2.35] [3.17 – 4.06]
π=1 6.65 2.83 2.35 6.58 2.79 2.36
[6.17 – 7.09] [2.31 – 3.29] [1.99 – 2.87] [6.17 – 7.08] [2.30 – 3.28] [1.99 – 2.87]
π=0 7.58 1.99 3.81 7.67 2.08 3.68
[7.39 – 7.73] [1.73 – 2.26] [3.34 – 4.40] [7.39 – 7.73] [1.72 – 2.26] [3.34 – 4.40]
Note: 95% Confidence intervals are in brackets and obtained via bootstrapping with 1,000 replications.
In sum, our results suggest that the respondents’ perception of the realism of our hy-
pothetical valuation setting has a significant bearing on the WTA-WTP disparity: if we
only consider respondents who deem the hypothetical setting likely to become reality, at
least to some extent, the disparity shrinks (see the line with π
i= 1 in Table 5), but if
the setting is perceived as unlikely, the disparity grows (see the line with π
i= 0 in Ta-
ble 5). An explanation for these outcomes might be that respondents who are uncertain
about the realism of the setting tend to answer in a conservative way by overstating their
WTA value and understating their WTP bid. This explanation of the WTA-WTP dispar-
ity, which is based on the uncertainty about the realism of the valuation setting, has some
parallels to the suggestion of Zhao and Kling (2001), who argue that respondents answer
conservatively because they are uncertain about the value of the good under scrutiny.
6 Conclusion
Using a survey among about 5,000 households and a discrete-choice experiment within a hypothetical setting, this paper has elicited both the households’ willingness to accept (WTA) compensations for allowing the grid operator to disconnect a house- hold from the grid once a year for a maximum of four hours and their willingness to pay (WTP) to avoid such a power outage. In accordance with numerous studies originating from other areas (Horowitz and McConnell, 2002; Tunc¸el and Hammitt, 2014), we find that the mean WTA value substantially exceeds the mean WTP bid, in our example by a factor of 3.56.
Yet, when accounting for respondents’ perception about the realism of the hypotheti- cal setting, we find that the WTA-WTP ratio decreases to 2.35 if respondents believe that the hypothetical valuation setting is likely to become true. Conversely, the WTA-WTP ratio increases to 3.81 if respondents deem the setting unlikely. Although non-causal in nature, these results indicate that observed WTA values might overestimate the genuine WTA, whereas observed WTP bids might be underestimated if the survey design does not account for the respondents’ perception of the realism of the setting.
Based on these results, we conclude that to diminish, at least to some extent, the WTA-WTP disparity typically resulting from stated-preference surveys, inquiring about respondents perception about the realism of the valuation setting is an essential element of any survey design. Moreover, we interpret our findings as support for the argument by Plott and Zeiler (2005) that the frequently observed WTA-WTP disparity may not be entirely a manifestation of human preferences. Instead, we argue that the disparity is at least to some extent due to respondents’ uncertainty about the realism of the hypothetical valuation setting, in our case the emergence of a market for electricity supply security.
Finally, we also believe that our empirical results are relevant for the evaluation of new
technologies and innovative policy measures whose realization appears unlikely: Failing
to account for the perceived realism of the valuation setting might result in an excessive
WTA-WTP disparity. Hence, we suggest asking a debriefing question about the realism
of the valuation setting.
Appendix
Wording of the Experiment
“For reasons of securing electricity supply, it might sometimes be necessary to disconnect individual households from the electricity grid.”
WTA group: “Imagine that your local grid operator therefore offers you a monthly com- pensation of eWTA [ ∈ { 3, 6, 9 } ] (i. e. eWTA × 12 per year) to be allowed to disconnect your household from the grid once a year for a maximum of four hours without prior notification. Would you accept this offer?”
WTP group: “Imagine that your local grid operator asks whether you are willing to pay eWTP [ ∈ { 3, 6, 9 } ] (i. e. eWTP × 12 per year) to avoid outages. Otherwise, the grid operator would be allowed to disconnect your household from the grid once a year for a maximum of four hours without prior notification. Would you accept this payment?”
Probability of the offering: “What do you think, how likely is it that your electricity supplier approaches you with such an offer?” The answers to this question are measured on a 5-point Likert scale, where 1 stands for “Very unlikely” and 5 indicates “Very likely”.
Probability of political consequences: “How likely do you believe that results of sur-
veys, such as the present one, influence policy decisions on the amount of the surcharge
for the promotion of renewable energy technologies (EEG Levy)?” The answers to this
question are measured on a 5-point Likert scale, where 1 stands for “Very unlikely” and
5 indicates “Very likely”.
Tables
Table A1: Comparison of the Sample with the Population of Household Heads in Germany
Variable Sample Population
Age below 25 years 1.2% 4.6%
Age 25 – 64 years 71.6% 67.0%
Age 65 and above 27.2% 28.4%
Female household head 37.7% 35.5%
East Germany 19.8% 20.9%
Single household 23.9% 41.4%
2 person household 45.7% 34.2%
3 person household 13.6% 12.1%
4 and more person household 16.8% 12.3%
College degree 33.1% 20.4%
High income 11.7% 11.8%
Note: Data for the population are drawn from Destatis (2016) where the main income earner is asked to complete the survey, whereas we ask the household head.
Table A2: Percentage of Respondents who Deem the Offer Likely across Experimental Groups
Bid WTA Group WTP Group
e3 11.68 14.16
– –
e6 12.05 12.88
(0.25) (-0.79)
e9 12.09 13.52
(0.26) (-0.39) Number of observations: 2,621 2,663
Note: t statistics for testing differences in means relative to thee3 group are in parentheses.
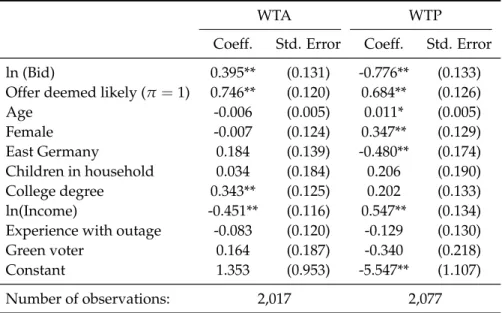
Table A3: Logit results for Model (1), estimated separately for the WTA and WTP Group - Robust- ness Check
WTA WTP
Coeff. Std. Error Coeff. Std. Error
ln (Bid) 0.395** (0.131) -0.776** (0.133)
Offer deemed likely (π=1) 0.746** (0.120) 0.684** (0.126)
Age -0.006 (0.005) 0.011* (0.005)
Female -0.007 (0.124) 0.347** (0.129)
East Germany 0.184 (0.139) -0.480** (0.174)
Children in household 0.034 (0.184) 0.206 (0.190)
College degree 0.343** (0.125) 0.202 (0.133)
ln(Income) -0.451** (0.116) 0.547** (0.134)
Experience with outage -0.083 (0.120) -0.129 (0.130)
Green voter 0.164 (0.187) -0.340 (0.218)
Constant 1.353 (0.953) -5.547** (1.107)
Number of observations: 2,017 2,077
Note: ** and * indicate statistical significance at the 1% and 5% level, respectively.
Here we defineπas unity ifj=2, . . . , 5 and zero otherwise (see Table 2).
Table A4: Mean Values for WTA and WTP - Robustness Check
Respondents who Expect the Survey to
Probability Full Sample Have Political Consequences
of the offer Mean WTA Mean WTP WTA/WTP ratio Mean WTA Mean WTP WTA/WTP ratio
π 7.46 2.10 3.55 7.53 2.18 3.45
[7.27 – 7.62] [1.81 – 2.35] [3.17 – 4.07] [7.34 – 7.7] [1.88 – 2.45] [3.07 – 4.03]
π=1 6.74 2.80 2.41 6.77 2.80 2.42
[6.38 – 7.06] [2.40 – 3.17] [2.11 – 2.82] [6.37 – 7.09] [2.36 – 3.21] [2.08 – 2.86]
π=0 7.74 1.81 4.28 7.90 1.85 4.27
[7.56 – 7.90] [1.53 – 2.08] [3.72 – 5.11] [7.72 – 8.07] [1.51 – 2.14] [3.70 – 5.25]
Note: Confidence intervals are in brackets and obtained via bootstrapping with 1,000 replications.
Here we defineπas unity ifj=2, . . . , 5 and zero otherwise (see Table 2).
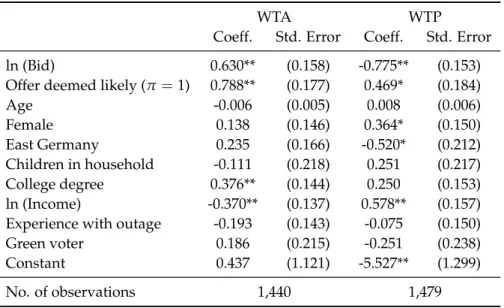
Table A5: Logit results for WTA and WTP for the Subsample of Resondents who Expect the Survey to have Political Consequences
WTA WTP
Coeff. Std. Error Coeff. Std. Error
ln (Bid) 0.630** (0.158) -0.775** (0.153)
Offer deemed likely (π=1) 0.788** (0.177) 0.469* (0.184)
Age -0.006 (0.005) 0.008 (0.006)
Female 0.138 (0.146) 0.364* (0.150)
East Germany 0.235 (0.166) -0.520* (0.212)
Children in household -0.111 (0.218) 0.251 (0.217)
College degree 0.376** (0.144) 0.250 (0.153)
ln (Income) -0.370** (0.137) 0.578** (0.157)
Experience with outage -0.193 (0.143) -0.075 (0.150)
Green voter 0.186 (0.215) -0.251 (0.238)
Constant 0.437 (1.121) -5.527** (1.299)
No. of observations 1,440 1,479
Note: ** and * indicate statistical significance at the 1% and 5% level, respectively.