High resolution analysis of local and global protistan soil community structures using morphological and modern
molecular techniques
Inaugural-Dissertation zur
Erlangung des Doktorgrades
der Mathematisch-Naturwissenschaftlichen Fakultät der Universität zu Köln
vorgelegt von
Anne Kathrin Domonell aus Bergisch-Gladbach
Köln 2013
2
Berichterstatter: Prof. Dr. Hartmut Arndt (Gutachter) Prof. Dr. Michael Bonkowski
Tag der mündlichen Prüfung: 18.10.2013
3
Danksagung
Zuallererst möchte ich mich bei meinem Betreuer Prof. Hartmut Arndt bedanken, der mir die Möglichkeit zur Promotion gegeben hat und mir während meiner Dissertation mit wissenschaftlichen Diskussionen und Anregungen zur Seite stand. Außerdem danke ich ihm, dass er mir die Möglichkeit gab an einer Forschungsreise nach Grönland und zahlreichen Tagungen teilzunehmen.
Prof. Michael Bonkowski danke ich für die Zweitbegutachtung meiner Dissertation und seine Hilfe bei bodenökologischen und statistischen Fragen.
Prof. Frank Schäbitz danke ich für die Übernahme des Vorsitzes meiner Disputation.
Der deutschen Forschungsgemeinschaft (DFG) und Hartmut Arndt möchte ich für die Finanzierung meiner Stelle und die im Rahmen dieser Arbeit benötigten Sachmittel danken.
Großen Dank möchte ich Frank Nitsche aussprechen, der mir in den schwierigen Zeiten der molekularbiologischen und bioinformatischen Analysen stets engagiert zur Seite stand. Seine fachlichen Ratschläge und seine Geduld waren mir überaus hilfreich.
Dank auch an die gesamte Arbeitsgruppe Arndt, vor allem Bärbel Jendral, Rosita Bieg und Anja Schwerwaß für die Hilfe bei adminstrativen und technischen Problemen und die schöne gemeinsame Zeit.
Des Weiteren möchte ich die gute Zusammenarbeit mit Marian Brabender in Bezug auf die Cercomonaden-Beschreibungen nicht unerwähnt lassen.
Meinen lieben Kollegen Alex, Jana, Mar, Kathi und Timm, danke ich für ihre Freundschaft und moralische Unterstützung. Danke für die schöne gemeinsame Zeit und die anregenden fachlichen und privaten Gespräche. Es war gut euch dabei gehabt zu haben.
Besonderer Dank gilt meinen Eltern und meinem Bruder, die mir während und
besonders zum Ende der Dissertation eine unersetzbare Stütze waren. Ich danke
euch für diesen Rückhalt und euer Vertrauen in mich.
4
…
„Alles Wissen und alle Vermehrung unseres Wissens endet nicht mit einem Schlusspunkt, sondern mit Fragezeichen.“
Hermann Hesse
…
5
Table of Contents
Zusammenfassung ... 7
Abstract ... 9
General Introduction ... 11
Chapter 1 – Community structure of cultivable protists in different grassland and forest soils of Thuringia ... 17
Introduction ... 18
Material and Methods ... 19
Results ... 23
Discussion ... 28
Summary ... 31
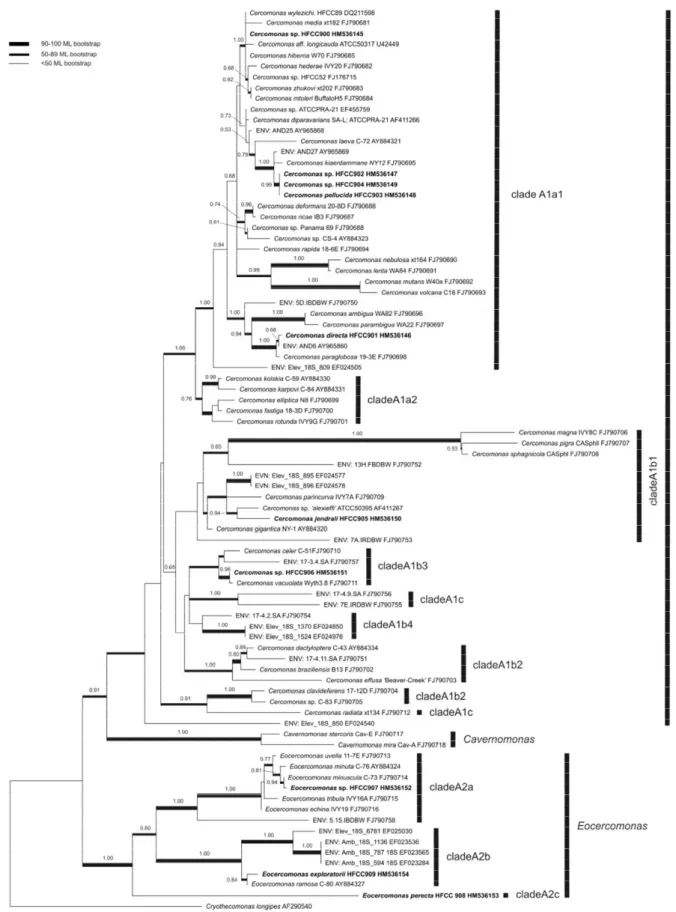
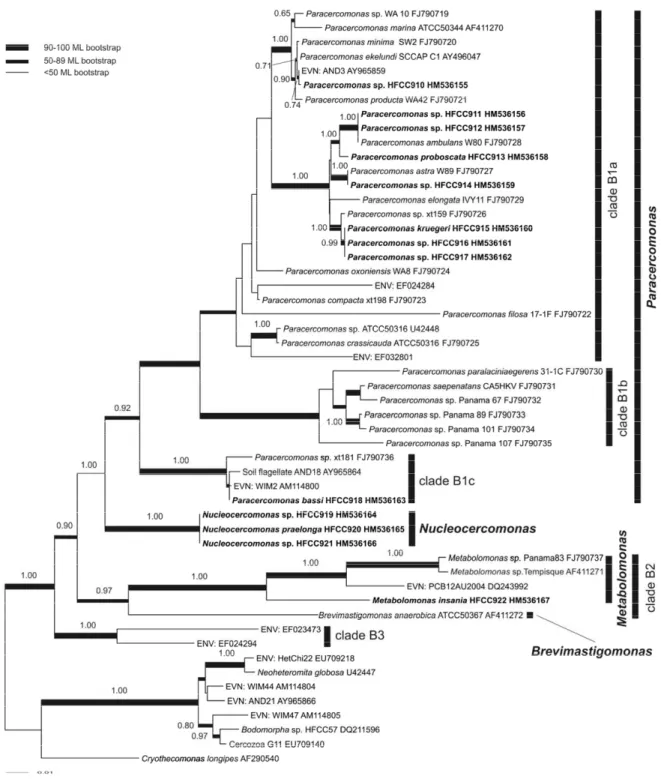
Chapter 2 – Diversity of soil cercomonad species: phylogeny, morphology and description of new species ... 33
Introduction ... 34
Material and Methods ... 35
Results ... 39
Discussion ... 52
Summary ... 55
Chapter 3 – Evaluation of next generation sequencing to identify in-vitro simulated flagellate community structures ... 57
Introduction ... 58
Material and Methods ... 59
Results ... 63
Discussion ... 68
Summary ... 70
6
Chapter 4 – Protistan soil communities revealed by NGS: A detailed local
study supported by morphological investigations ... 73
Introduction ... 74
Methods ... 76
Results ... 79
Discussion ... 93
Summary ... 96
Chapter 5 – Protistan soil communities revealed by NGS: A comparison of globally distant sites and indications of distribution pathways ... 99
Introduction ... 100
Material and Methods ... 101
Results ... 105
Discussion ... 120
Summary ... 123
Concluding Remarks and Perspective ... 125
List of References ... 128
Appendices ... 141
Appendix Chapter 1 ... 141
Appendix Chapter 2 ... 144
Appendix Chapter 3 ... 146
Appendix Chapter 4 ... 147
Appendix Chapter 5 ... 151
Teilpublikationen ... 153
Erklärung ... 155
7
Zusammenfassung
Protisten sind einzellige Eukaryoten, die verschiedenste aquatische und terrestrische Lebensräume besiedeln. In der vorliegenden Arbeit wurden vor allem Protistengemeinschaften in terrestrischen Habitaten untersucht. Als Hauptkonsumenten von Bakterien im Boden tragen sie dort maßgeblich zu Mineralisierungsprozessen und bedeutsamen Ökosystemprozessen bei.
Protistengemeinschaften verschiedener Grünland- und Waldböden mit unterschiedlicher Landnutzung wurden mittels morphologischer und molekularer Methoden untersucht. Die morphologischen Untersuchungen konnten dabei hohe Abundanzen an Protozoen (heterotrophe Protisten), beeinflusst durch die Landnutzung, in den untersuchten Böden aufdecken. Zudem waren erste Einblicke in die Zusammensetzung der Protozoengemeinschaften der Böden möglich, die vor allem durch Flagellaten und nackte Amöben dominiert wurden.
Cercomonaden, eine der diversesten und abundantesten Flagellaten der Studie,
wurden mittels weiterer morphologischer Bestimmungen und phylogenetischer
Analysen untersucht. Die Ergebnisse der morphologischen Studien begründeten
eine weitere detaillierte Analyse der Protisten im Boden und stellten zugleich die
Basis für weitere molekulare Analysen dar. Die morphologisch untersuchten
Böden wurden mittels next generation sequencing (NGS) der V4-Region der SSU
rDNA vertiefend analysiert. Durch das eingeführte Verfahren zur Analyse der
NGS-Daten, konnten sehr detaillierte und umfangreiche Untersuchungen der
Protistengemeinschaft durchgeführt werden. Zum ersten Mal wurden so
Bodengemeinschaften bis auf das Artniveau hin untersucht. Die Kombination von
morphologischen und molekularen Methoden zur Untersuchung von
Gemeinschaften von Flagellaten ist einzigartig. Verschiedene isolierte und
neubeschriebene Arten wurden mittels NGS wieder aufgefunden und deuten
darauf hin, dass einige abundante Arten bisher möglicherweise übersehen
wurden. Vertreter der SAR Gruppe (Stramenopiles, Alveolata und Rhizaria)
dominierten die mittels NGS analysierten Protistengemeinschaften im Boden. Ein
Landnutzungseffekt zeigte sich vor allem im Vorkommen bestimmter
Thekaamöben und Ciliaten. Methodische Untersuchungen der NGS-Technik
zeigten, dass sich Schlussfolgerungen über das Vorkommen von Arten ziehen
8
lassen, Aussagen über Abundanzen jedoch nur vorsichtig getroffen werden sollten.
Weitere Proben aus der Arktis, Antarktis und der USA wurden untersucht und
zeigten eine größere Abhängigkeit der Protistengemeinschaft hinsichtlich des
Habitats in dem sie leben, als hinsichtlich der geographischen Region, aus der sie
stammen. Die Untersuchungen von Luft-, Schnee-, Eis- und Bodenproben eines
anthropogen wenig beeinflussten Ortes in Grönland unterstützten, zusammen mit
den unterschiedlichen globalen Proben, die Annahme einer unbegrenzten
Luftverbreitung von Protisten.
9
Abstract
The unicellular protists inhabit all types of aquatic and terrestrial environments.
This thesis is focused on terrestrial protistan communities where they contribute significantly to mineralization processes and key ecosystem functions, as they are major consumers of bacterial production. The protistan soil communities of grassland and forest sites with a different land use were morphologically and molecularly investigated in this study. The morphological investigations revealed high protozoan abundances influenced by the intensity of land use. First insights to the community composition, dominated by flagellates and amoebae could be made, giving the basis for further molecular investigations. Cercomonads were the most abundant and diverse flagellates and were analyzed in more detail, resulting in new description of species. Next generation sequencing (NGS) of the V4 SSU rDNA on the same soil sites was applied. The development of an analysis pipeline for NGS data made in this study, led to a high resolution of the protistan community. This resulted in the first detailed study down to species level of total protistan community structures in soil. Several isolated and newly described species could be recovered by NGS in various samples, indicating that several very common protozoan species in soil have been overlooked. A combination of morphological and molecular studies of soil protistan flagellate communities is unique. Members of the SAR group dominated the protistan communities and land use effects by changes of testate amoebae and ciliates could be registered.
Further investigations of Arctic, Antarctic and USA samples, confirmed protistan
communities to be dependent on the habitat, but independent on the geographic
region. The idea of unrestricted global distribution by air was supported by several
genotypes reported from a variety of globally distant sites. The assumed pathways
by air were supported by air, ice, snow and soil samples of a low anthropogenic
influenced site in Greenland.
10
11
General Introduction
Protists are unicellular organisms, compromising autotrophic, heterotrophic and mixotrophic eukaryotes (Hausmann et al. 2003). The organisms are small sized, mainly between 2 and 200µm, and may occur in high abundances up to 10
4-10
7active individuals per gram dry soil and litter (e.g. Adl and Gupta 2006). Their ability to form cysts make them highly adaptive to environmental changes, allowing them to outlive various harsh conditions (e.g. Rivera et al. 1992). Protists are globally distributed and inhabit all types of aquatic and terrestrial environments (e.g.Ekelund and Ronn 1994; Finlay et al. 2000; Sherr and Sherr 2002).
This thesis is focused on terrestrial protistan communities where they contribute significantly to mineralization processes and key ecosystem functions (Bonkowski and Clarholm 2012; Darbyshire et al. 1974; Finlay et al. 2000; Ronn et al. 2012).
Protists are major consumers of bacterial production and link primary producers with higher trophic levels (Bonkowski 2004; Bonkowski and Brandt 2002; Clarholm 1985).
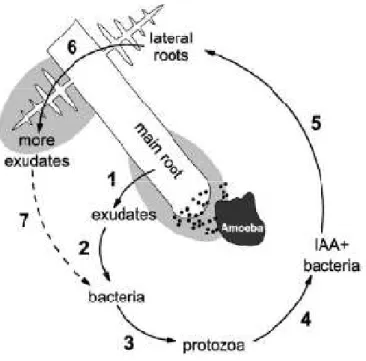
Figure 1. Connection between bacterial grazing and root growth. Exudates are released by the roots (1) and stimulate bacterial growth (2) and protozoan grazing (3). The selective bacterial grazing favor IAA-producing bacteria (producing plant growth promoting hormones) (4) and subsequently increase roots growth (5) and by this the rates of released exudates (6) (from Bonkowski and Brandt 2002).
12
As illustrated in Figure 1, their grazing has been shown to stimulate plant growth and bacterial metabolism, respectively (Adl and Gupta 2006; Bonkowski 2004;
Bonkowski and Brandt 2002; Kreuzer et al. 2004). The selective grazing of protozoans on bacteria has a strong influence on the bacterial community composition and by this on the bacterial-plant interactions (Glücksman et al. 2010;
Rosenberg et al. 2009). Additional effects on bacterial functional gene expression due to protistan grazing are indicated (Rosenberg et al. 2009). Plant growth is mainly limited by N availability (Mokhele et al. 2012) and microbial growth mainly by C availability (Jones et al. 2009; Paterson 2003). The availability of both is enhanced by protozoan grazing (e.g. Bonkowski 2004; Bonkowski and Brandt 2002; Clarholm 1985). The importance of the interaction between abuscular Mycorrhiza and grazing protozoans for plant growth is indicated by an increased uptake of N via abuscular Mycorrhiza and an increased C release from the plants to the soil (Herdler et al. 2008; Koller et al. 2013; Wamberg et al. 2003). Detailed analysis of protistan soil communities are required to enlarge the knowledge of protists and the understanding of the microbial interactions in soil. Other studies based on next generation sequencing (NGS) concentrated on certain protistan taxa or identified the protistan community only to a very rough taxonomic level (Bates et al. 2013; Kamono et al. 2013; Triado-Margarit and Casamayor 2012;
Urich et al. 2011). The aim of the thesis was a high resolution analysis of protistan soil community structures, based on morphological (Chapters 1 and 2) and molecular analysis (Chapters 4 and 5). NGS was applied for comprehensive analysis of protistan communities down to species level.
In Chapter 1, the protozoan (heterotrophic protists) soil communities of different
grassland and forest sites of Thuringia were investigated by cultivation and
morphological investigation. The analyses were carried out in the framework of the
Biodiversity Exploratories. Among the community structures, the influence of
habitat type and land use intensity on the protozoan community structure was
revealed. The ability of protists to colonize and reproduce in new habitats is mainly
defined by the given conditions, like soil moisture, temperature and food
abundance (Adl and Coleman 2005). The dependency on those conditions, their
contribution on nutrient cycling processes (Bonkowski 2004) and their short
generation time, high abundances and consumption (Foissner 1999b) make them
13 very suitable as indicators of abiotic and biotic changes. Thereby environmental changes are reflected by differences in the protistan abundance, community structure and diversity, as certain species are adapted to different environmental conditions, where they are metabolically active and reproduce. Traditionally ciliates and testate amoebae were widely used as soil bioindicators, mainly due to their larger body size and easier identification (Foissner 1999b). The present study was intended to increase the general understanding how other protistan groups such as small forms of flagellates, naked and testate filose amoebae and small ciliates contribute to microbial soil communities. Cercozoans and especially cercomonads, were the most diverse and abundant flagellates in the soil samples, which was supported by other studies (Bass et al. 2009; Ekelund and Patterson 1997; Foissner 1991). Their metabolic cell shape, the possession of flagella and the ability to form cysts within a short period of time, make them very suitable to survive extreme conditions. The identification of cercomonads is difficult because of their highly variable cell shape. Nevertheless, the biflagellated gliding amoeboflagellates are up to now mainly determined based on their morphology (e.g. Mylnikov and Karpov, 2004). The development of molecular techniques enabled further work on the taxonomic position of cercomonads. A combination of morphological investigations, including detailed ultrastructural studies, with phylogenetic analysis is required to determine these highly metabolic flagellate and was applied in the studies of Chapter 2.
The morphological analyses of Chapters 1 and 2 gave first ideas regarding the protozoan structure in different soil communities and additionally provide the basis for further detailed analysis. A preliminary knowledge about the species and their abundances representing the community of a certain habitat, are necessary for a successful study design of culture independent techniques. Morphological studies on protists are generally restricted by the low abundances of certain species, encysted resting stages and methodological biases based on selective determination and enrichment (Weisse 2008). The use of high-throughput methods can evade these morphological determination restrictions and additionally provide larger datasets, which enables a highly resolved analysis of e.g. species richness and diversity (Buee et al. 2009; Gottel et al. 2011;
Jumpponen and Jones 2009; Lecroq et al. 2011; Nacke et al. 2011; Stoeck et al.
14
2010; Stoeck et al. 2009; Triadó-Margarit and Casamayor 2013). In Chapter 4, NGS was applied on the preliminary investigated sites of grassland and forest, to improve the influence of land use intensity and site type on protistan soil, giving the first detailed study of protistan communities in soil. The higher resolution of protistan species richness, due to the large NGS dataset, has the potential to enlarge and refine the assumptions made by the morphological investigations made in Chapter 1.
As NGS is applied more frequently and the data yielded by this method accumulate, new questions arise on the application fields as well as the data reliability of these methods (Edgcomb et al. 2011; Lee et al. 2012; Medinger et al.
2010; Weber and Pawlowski 2013). Sequencing errors of individual sequencing reads can result in misidentification and an overestimation of diversity (Huse et al.
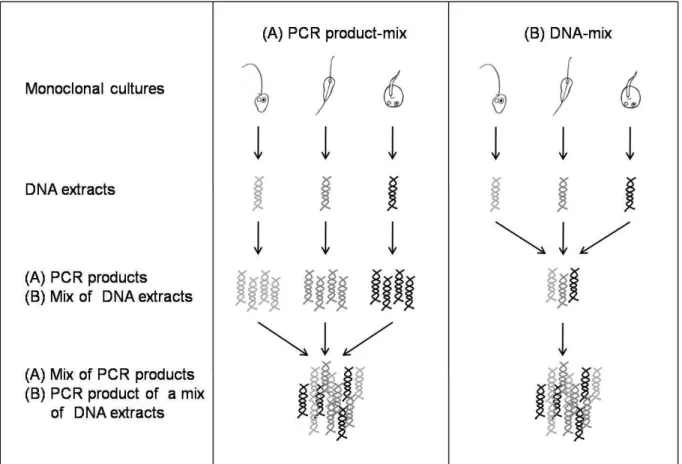
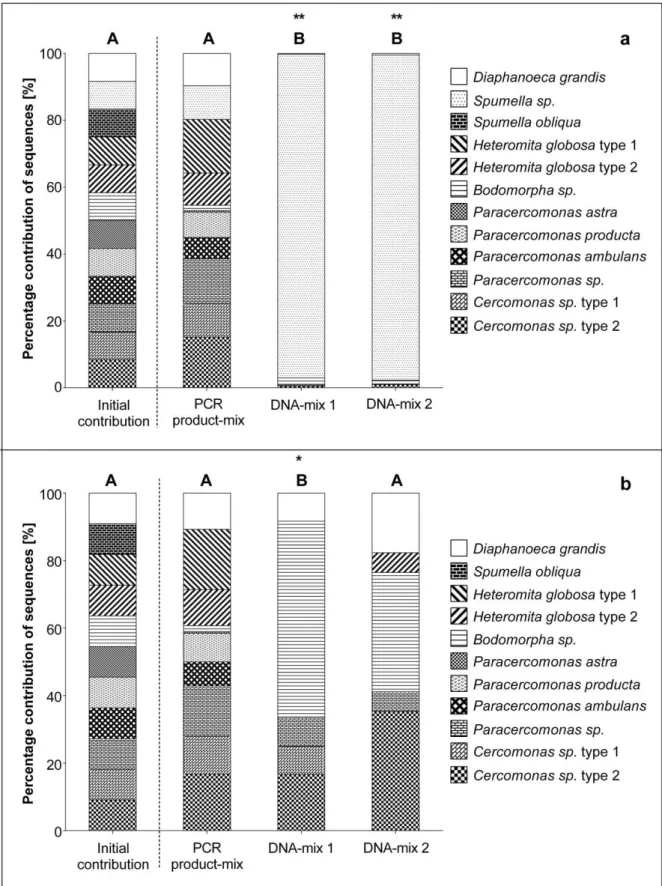
2010; Kunin et al. 2010). Therefore, a prerequisite of the proper interpretation of NGS data from field studies were methodological studies. In Chapter 3 the influence of protozoan community composition, based on the species diversity and species richness on the NGS outcome of a given artificially composed community was investigated. Furthermore the influence of PCR amplification was considered in this study. The influence of NGS on the recovery of artificial constructed protozoan communities was applied to verify the results based on NGS made in Chapter 4 and 5.
The understanding of protistan biodiversity and their biogeography is a current issue of ecological studies (e.g. Nolte et al. 2010; Scheckenbach et al. 2010;
Stoeck et al. 2010). Different aspects support the assumption of microbial potential of global and long distance dispersal, i. the ability to form cysts (e.g. Rivera et al.
1992), ii. the low weight and small body/cyst size facilitating distribution via air by wind as single cysts or associated to dust particles and other organisms (Rivera et al. 1992; Rogerson and Detwiler 1999; Wilkinson 2001) and iii. the large population sizes increasing the chance for individuals dispersing (Wilkinson et al.
2012). Thus, geographical limitations of dispersal are absent in microorganism in
contrary to larger organisms, which have to overcome vertical and horizontal
boundaries, such as mountains and seas.
Figure 2. Hypothetical model of the ubiquity
be located in the species size range 1 to 10 mm, as large mammal species obviously have biogeographies (from Finaly 2002).
The dependency of organism size to unrestricted dispersal is indicated in Figure 2, where 1mm borders organism’s ubiquity. Recent investigations even suggest a size limit of as low as 20µm for global dispersal (Wilkinson et al., 2012).
study of Chapter 5 aims at applying molecular methods to protist dispersal between air, ice, snow and soil
influenced model site in Greenland globally distant sites.
. Hypothetical model of the ubiquity-biogeography transition, which is believed to be located in the species size range 1 to 10 mm, as large mammal species obviously have
(from Finaly 2002).
The dependency of organism size to unrestricted dispersal is indicated in Figure 2, where 1mm borders organism’s ubiquity. Recent investigations even suggest a size limit of as low as 20µm for global dispersal (Wilkinson et al., 2012).
ims at applying molecular methods to give first insights into protist dispersal between air, ice, snow and soil using a low anthropogenic influenced model site in Greenland and to compare protist species richness
15
biogeography transition, which is believed to be located in the species size range 1 to 10 mm, as large mammal species obviously have
The dependency of organism size to unrestricted dispersal is indicated in Figure 2,
where 1mm borders organism’s ubiquity. Recent investigations even suggest a
size limit of as low as 20µm for global dispersal (Wilkinson et al., 2012). In the
give first insights into
using a low anthropogenic
to compare protist species richness of
16
17
Chapter 1 – Community structure of cultivable protists in different
grassland and forest soils of Thuringia
18
Introduction
Protozoa are ubiquitous and essential components in terrestrial ecosystems. They are major consumers of bacterial production and link primary producers with higher trophic levels (Clarholm 1985; Bonkowski 2004). Protozoan grazing has been shown to stimulate plant growth and bacterial metabolism, respectively (Adl and Gupta 2006; Bonkowski 2004; Bonkowski and Brandt 2002; Ekelund and Ronn 1994; Kreuzer et al. 2004). Therefore grazing of bacteria by soil protozoans plays an important role in mineralization and cycling of nutrients in soil food webs (Finlay et al. 2000).
Up to now, data on the taxonomic composition of protozoans in soil are very scarce. A comprehensive study by Finlay et al. (2000) at the Sourhope experimental grassland site showed average densities of 45*10
3flagellates g
-1dry weight, 17*10
3naked amoebae g
-1dry weight, 3.5*10
3testate amoebae g
-1dry weight and 5*10
3ciliates g
-1dry weight. Although flagellates and naked amoebae appear to be the most abundant protozoans in soil and constitute an important part of soil food webs, testate amoebae and ciliates traditionally have gained more attention in taxonomic studies due to their larger size, but mostly to their distinct morphology that made species identification easier (Foissner 1987a, 1987b;
Foissner et al. 1990). For biodiversity studies, more detailed analyses including the abundances of all protozoan groups are needed. There are only very few data available which combine quantitative and qualitative studies especially regarding the abundant nanoprotists in the size range of 1-20 µm (Arndt et al. 2000). This is a major problem for understanding of the role of protozoans in respect to the flux of matter in soil.
The aim of the study was to contribute to the above mentioned gap of knowledge
regarding the diversity and abundance of nanosized protozoans in soil. The
protozoan communities of eight different sampling sites including four grassland
and four forest soils with variable land use were compared. Higher abundances at
intensively used sites and a significant difference in community structure of
grassland and forest soils were expected. The abundances of flagellates and
naked amoebae were determined with a modification of the liquid aliquot method
(Butler and Rogerson 1995) and combined this with a rough classification of these
19 nanoprotists into morphotypes via light microscopy. The function of nanofauna soil communities should be derived from the obtained knowledge of the community structure and published data on the feeding ecology of the recorded protozoan taxa.
Material and Methods Study site and soil sampling
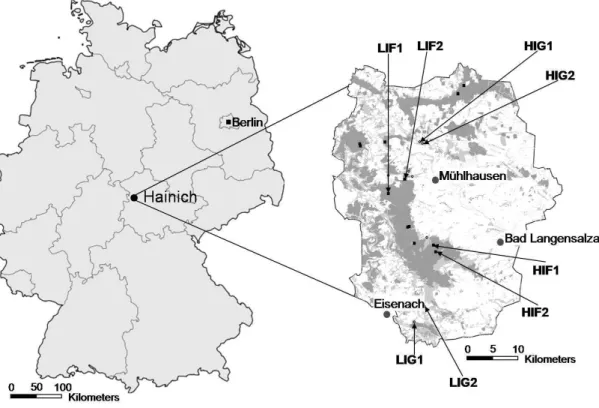
The study area was located in central Germany (N 51°13'0'', E 10°27'0''), in the Hainich-Dün region (Thuringia, Germany Fig. 1), a limestone plateau (300-400 m a.s.l.) with an annual mean temperature of 6.5-7.5 °C and annual mean precipitation of 750-800 mm (Fischer et al. 2010). The experimental plots were extremes of a land use gradient in established land use systems as part of an interdisciplinary project, the Biodiversity Exploratories (http://www.biodiversity- exploratories.de).
Figure 1. Study area with sampling sites of biodiversity project across Germany, with a closer look to National Park of Hainich-Dün. Explored grassland areas of Hainich-Dün were marked with circles and forest areas were marked with squares. (http://www.biodiversity- exploratories.de).
20
A comparison of the protozoan community structure at different plots (four grassland sites and four forest sites) chosen according to their degree of land use (for details see Table 1) was carried out. Grassland sampling sites comprised two fertilized low intensively used managed grasslands, mown three times per year (referred as LIG 1 and LIG 2) and two unfertilized pastures grazed by cattle with intensive land use (referred as HIG 1 and HIG 2). The forest sampling sites included two low intensity unmanaged beech forests at late succession (referred as LIF 1 and LIF 2) and two intensive managed spruce age class forests at early succession (referred as HIF 1 and HIF 2).
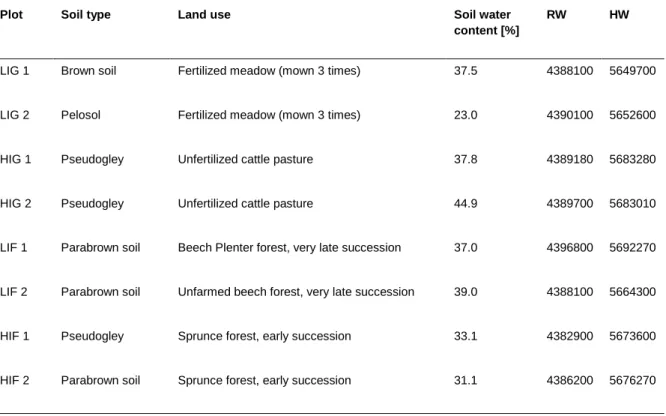
Table 1. List of sampling sites in grassland (LIG and HIG) and forests (LIF and HIF). Dataset obtained from the Biodiversity Exploratories (www.biodiversity-exploratories.de).
Plot Soil type Land use Soil water
content [%]
RW HW
LIG 1 Brown soil Fertilized meadow (mown 3 times) 37.5 4388100 5649700
LIG 2 Pelosol Fertilized meadow (mown 3 times) 23.0 4390100 5652600
HIG 1 Pseudogley Unfertilized cattle pasture 37.8 4389180 5683280
HIG 2 Pseudogley Unfertilized cattle pasture 44.9 4389700 5683010
LIF 1 Parabrown soil Beech Plenter forest, very late succession 37.0 4396800 5692270
LIF 2 Parabrown soil Unfarmed beech forest, very late succession 39.0 4388100 5664300
HIF 1 Pseudogley Sprunce forest, early succession 33.1 4382900 5673600
HIF 2 Parabrown soil Sprunce forest, early succession 31.1 4386200 5676270
The samples were collected during the 14
thand 30
thof April in 2008 in the Hainich-
Dün National Park (Fig. 1). Grassland plots and forest plots were 20m x 20m in
size. At each sampling plot nine subsamples were taken. For each subsample a
metal frame (20cm x 20cm) was driven into the soil. After removing the root-layer
of the top 5cm of grassland samples and the litter-layer of the forest samples, the
deadwood and roots with a diameter > 2cm were rejected. The A-level of the nine
subsamples was collected and thoroughly mixed to one sample to reduce small-
scale heterogeneity. The samples were stored at field moisture content at 4°C until
21 the analysis started. Soil water content was determined by subtraction of soil dry weight from soil fresh weight, after drying at 105°C for 24h.
Determination of cultivable protozoans
For quantification of cultivable protozoans the liquid aliquot method (LAM) according to Butler and Rogerson (1995)was employed which is a modification of the classical MPN method (Darbyshire et al. 1974). The LAM method bears the advantage that the inoculum per culture vessel is so small that maximal one cultivable protist is contained. Thus, potentially selective further dilutions are not necessary and the establishment of clonal cultures for later identification is easier.
Pre-experiments were carried out to apply adequate dilution rates. One g of homogenized soil sample was suspended for 10 min by shaking in 200 ml Volvic
©mineral water (Danone Waters Deutschland GmbH, Frankfurt, Germany) to dilute and separate the organisms from the soil. 5 µl aliquots of this suspension were filled into wells of six 24-well plates (Sarstedt, Nümbrecht, Germany), each well contained 1.5 ml Volvic
©water and one sterilized amaranth (Amaranthus caudatus) grain to stimulate bacterial growth. The plates were checked weekly for a period of four weeks using an inverted microscope (Zeiss Axiovert S100) with phase contrast optics. For better identification and later sequencing, some protists were transferred into 50ml tissue culture flasks (Sarstedt, Nümbrecht, Germany) filled with 30ml WC-medium, a freshwater medium of double-distilled water supplied with inorganic salts and vitamins (Guillard and Lorenzen 1972) and one sterilized quinoa (Chenopodium quinoa) grain. The 24-well plates and culture flasks were stored at 14°C in the dark. To maintain sterile conditions, the whole work was conducted at a clean bench.
Morphotypes of protozoans were determined according to keys and figures
published by Lee et al. (2000) and Smirnov and Goodkov (1999). Systematics
followed Cavalier-Smith and Chao (2003) and Howe et al. (2009). Protozoan
species were determined to the morphotype level or summed up to morphotype-
groups, based on their similar and variable morphology as follows: (i)
glissomonads: including species of bodomorphids and thamatomonads; (ii)
cercomonad morphotype-group A: bulb shaped cercomonads with moderate
22
metabolic cell shape in a size range of 12-18µm possessing a long anterior flagellum; (iii) cercomonad morphotype-group B: cercomonads with a metabolic cell shape in the size of 5-11µm; (iv) cercomonad morphotype-group C:
cercomonads with a very metabolic cell shape in the size range of 15-20µm. All aboved mentioned cercomonads as well as other cercomonads and glissomonads were summarized under the term cercozoans; (v) euglenozoans: bodonids and euglenids.
Total protozoan numbers were calculated from the cumulative appearance of protists in the 24-well plates and corrected by a modified Poisson distribution.
Statistical analyses
All statistical tests were performed using the SAS
®software (SAS Institute Inc., Cary, NY, USA, 1993). Data were analyzed by analysis of variance (ANOVA).
Data of percentage contributions were arcsin-transformed to approximate homogeneity of variance.
A cluster analysis (Bray Curtis similarity) in respect to the abundance and community structure was performed with the program Primer 6 (Clarke and Gorley 2006).
The diversity of the cultivable protozoan morphotypes was calculated by the Shannon-Weaver index (Shannon and Weaver 1949):
where P
iis the proportion of the i-th morphotype.
To calculate the evenness of the cultivable protozoan morphotypes, the Simpson index (D) was calculated (Simpson 1949):
where n
iis the number of individuals of one morphospecies and n is the total
number of individuals.
23 Results
Comparison of protozoan community structure
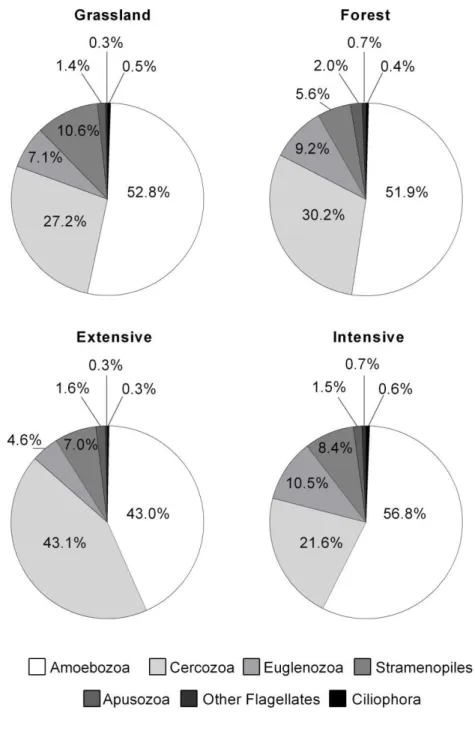
For an overall comparison, all four subsamples of a respective landscape type (grassland/forest, extensive/intensive land use) were summarized in Figure 2 to simplify the comparison and to clarify general differences between these different land types. The percentage contribution of the protozoan groups did not differ significantly between the site types (ANOVA, P>0.05, see Appx. Tab. 1.1). The comparison of the protozoan community concerning different land use intensities revealed higher numbers of amoebae and significantly lower numbers of cercozoans (F
[3,7]= 17.03; P=0.015 for land use) in intensively used sites. A significant influence of the intensity of land use on any other protozoan group could not be confirmed (ANOVA, P>0.05, see Appx. Tab. 1.1).
Variability of the protozoan community across different grassland and forest sites On average, forest sites showed slightly lower abundances (49.7 *10
3± 8.9 ind. g
-1dry weight) compared to grassland sites (69.3 *10
3± 48.5 ind. g
-1dry weight, see Table 2). The relative contribution of each protozoan group was similar at grassland and forest sites. Flagellates and amoebae each had a similar share of about 50% of the abundance at all site types. Total numbers of protozoans differed significantly between extensive and intensive grassland sites (F
[3,7]= 9.39; P=
0.038 for the interaction site type x land use), mainly caused by variability of amoebae. Total numbers of amoebae increased 5.4 fold from extensively to intensively managed grasslands (F
[4,7]= 12.12; P= 0.025 for the interaction site type x land use), but no significant effect of land use on amoebae in forests could be detected. Monotactic (F
[3,7]= 4.68; P=0.097) and fan-shaped (F
[3,7]= 10.52;
P=0.032) amoebae were mainly responsible for the increase in abundance of protozoans in intensively managed grassland. Among flagellates, cercomonads dominated followed by euglenozoans (mainly bodonids) and stramenopiles.
Apusomonads and ciliates were of minor importance.
24
Figure 2. Comparison of the composition of cultivable protozoans at grassland and forest sites and at extensive and intensive used sites (Percentage contribution in brackets).
The two grassland sites with a more intensive land use (HIG 1 and 2) had highest
protozoan abundances (88.3 and 127.3 *103 ind. g
-1dry weight) both, in
comparison to the other grassland sites and to the forest sites (Table 2). The four
forest sites had similar abundances ranging between 41.0 and 61.2 *103 ind. g
-1dry weight. The extensively used grassland sites (LIG 1 and 2) had slightly lower
abundances of 44.3 and 17.2 *103 ind. g
-1dry weight (Fig. 3a). While the
protozoan community was dominated by flagellates (35 - 65%) and amoebae (32 -
25 65%) at each sampling site, ciliates were only rarely recorded (0.0 – 1.6 %).
Though the general community structure of protozoans was very similar in grassland and forest sites, a higher resolution of morphotypes revealed a high variability between sites (Fig. 3b). Only cercomonad morphotype A was significantly correlated with site type and land use intensity, all other protozoan morphotypes had no significant relationship neither to the site type nor to the land use intensity (see Appx. Tab. 1.3).
The most abundant groups of cultivable soil Protozoa were cercozoans, euglenozoans (especially bodonids) and various amoebae (Fig. 3b). Within the groups of amoebae and cercozoans just slight differences between grassland and forest sites could be detected. At all sites, the amoebae community was dominated by fan-shaped taxa (mostly vannellids) followed by other naked amoebae morphotypes. Testate amoebae were of minor importance with respect to their abundance. Representatives of the Neobodo designis–complex were the most important euglenids at all sites followed by representatives of the Bodo saltans-complex which tended to have higher abundances at forest sites. Among cercozoans, glissomonads contributed the highest proportion, followed by other cercomonad morphotypes (Fig. 3b).
The cluster analysis indicated a significant difference between the grassland sites
LIG 2 and HIG 2 and both sites compared to the other grassland and forest sites
(P<0.05). All other sites were not significantly different from each other. There
were no significant differences between the diversities of grassland and forest
sites (Shannon-Weaver P>0.05, Simpson P>0.05).
26
Figure 3. Protozoan community structure at grassland sites (LIG and HIG) and forest sites (LIF and HIF) in Thuringia, Germany. a) Abundances of cultivable protozoans of grassland and forest sites with different land use. Different letters indicate a significant difference (Turkey’s Studentized Range Test (HSD) at p=0.05). b) Percentage contribution of different protozoan groups. The “other"-groups contained forms which could not be assigned to one of the specific morphotypes.
27
Table 2. Abundance estimates [ind./g soil dry weight] of cultivable protozoans of grassland (LIG and HIG) and forest (LIF and HIF) sites with different land use.
Morphotype LIG1 LIG2 HIG1 HIG2 LIF1 LIF2 HIF1 HIF2
Bicosecids 902 0 0 5854 0 0 860 0
Chrysomonads 2784 1597 3497 15792 2417 2791 2624 2471
Rhynchomonas nasuta -group 902 0 257 630 0 455 0 0
Bodo saliens -group 0 117 0 0 0 0 0 0
Bodo saltans -group 1131 0 3218 0 857 455 0 7753
Neobodo designis -group 902 0 11330 0 1964 1384 1301 3318
Other bodonids 0 0 0 0 212 0 0 0
Euglenids 0 0 0 630 0 0 0 0
Apusomonads 222 0 0 3863 1740 915 428 810
Glissomonads 8149 2840 4499 11249 12487 8179 3475 4556
Other cercomonads 902 3651 257 1916 857 455 428 810
Cercomonad morphotype C 673 117 1043 0 212 1849 428 1226
Cercomonad morphotype B 5569 597 6130 13568 2190 4718 3523 2052
Cercomonad morphotype A 6644 476 2660 3208 4301 2791 2624 3318
Other flagellates 0 236 0 630 0 0 0 1226
Acanthopodian amoebae 4020 1215 1307 9982 1077 915 3523 810
Monotactic amoebae 3769 236 18211 8583 2190 4718 3523 3318
Testate amoebae 1131 236 2938 630 1077 1384 428 403
Hartmannellid-like amoebae 222 842 4068 15791 1517 4718 6780 1226
Fan-shaped amoebae 4273 3506 25119 33090 6821 20710 13859 11563
Other amoebae 2064 1341 3782 630 1077 4718 860 6386
Ciliates 0 236 0 1267 0 0 0 810
![Table 2. Abundance estimates [ind./g soil dry weight] of cultivable protozoans of grassland (LIG and HIG) and forest (LIF and HIF) sites with different land use](https://thumb-eu.123doks.com/thumbv2/1library_info/3634939.1502409/27.892.108.724.144.842/table-abundance-estimates-weight-cultivable-protozoans-grassland-different.webp)