Standardisation and optimisation techniques in gut microbiome community analysis
DISSERTATION ZUR ERLANGUNG DES DOKTORGRADES DER NATURWISSENSCHAFTEN (DR. RER. NAT.)
DER FAKULTÄT FÜR BIOLOGIE UND VORKLINISCHE MEDIZIN DER UNIVERSITÄT REGENSBURG
vorgelegt von
Frank Michael Nikolaus Stämmler
aus
Königstein im Taunus
im Jahr 2019
Der Promotionsgesuch wurde eingereicht am:
13.06.2019
Die Arbeit wurde angeleitet von:
Prof. Dr. Rainer Spang Unterschrift:
Frank Michael Nikolaus Stämmler
ii
I dedicate this thesis to my beloved family and friends who supported me throughout these years far beyond imagination. A special feeling of gratitude to my loving parents, Erwin and Elke, my sister Frauke and my girlfriend Katharina, for their never ending words of encouragement and
support. Additionally, I thank Sanne and Felix for substantiating my decision to pursue a doctorate, by believing where the only boundary is in our heads. Also many thanks to my long year companion and dear friend Martin for pushing me when I was getting lazy and distracting
me when I needed it the most.
Declaration in lieu of oath
I herewith declare in lieu of oath that I have composed this thesis without any inadmissible help of a third party and without the use of aids other than those listed. The data and concepts that have been taken directly or indirectly from other sources have been acknowledged and referenced.
The persons listed beneath have helped me to select and choose the following material gratu- itously/for a consideration in the manner described in each case:
1. Prof. Dr. Dr. André Gessner and staff (Collection and extraction of microbiome samples and generation of raw sequencing data for the experiments of chapters two and three) 2. Prof. Dr. Ernst Holler, Dr. Daniela Weber and staff (Collection of human stool specimens
from ASCT patients for the experiment of chapter two)
Other persons have not helped to produce this work as regards to its content or making. In particular, I have not used the services of any professional agencies in return for payment or those of other persons. Nobody has received payment in kind - neither directly nor indirectly - from me for any work that is connected with the content of this doctoral thesis.
This thesis has not been submitted, wholly or substantially, neither in this country nor abroad for another degree or diploma at any university or institute.
I declare in lieu of oath that I have said nothing but the truth to the best of my knowledge and that I have not withheld any information.
Before the above declaration in lieu of oath had been taken down, I was advised about the significance of a declaration in lieu of oath as well as the legal consequences of an incorrect or incomplete declaration.
Frank M.N. Stämmler
June 2019
Declaration of own contribution to presented academic manuscript
Chapter two of the presented thesis has been adapted by the doctoral candidate from an already published manuscript (Stämmler et al. [1]):
Stämmler F, Gläsner J, Hiergeist A, Holler E, Weber D, Oefner PJ, Gessner A, Spang R.
Adjusting microbiome profiles for differences in microbial load by spike-in bacteria. Microbiome.
2016;4:28. doi:10.1186/s40168-016-0175-0.
This manuscript has been distributed under the terms of the Creative Commons Attribution 4.0 International License (http://creativecommons.org/licenses/by/4.0/), which permits unrestricted use, distribution, and reproduction in any medium, provided you give appropriate credit to the original author(s) and the source, provide a link to the Creative Commons license, and indicate if changes were made.
I hereby declare that my contribution to this publication included the design of the validation experiment, bioinformatics analysis and preparation of figures. Additionally, I conceptualized the presentation of the results and drafted all sections of the manuscript. The sections regarding laboratory methods were outlined by me following the experimental protocols of the laboratory staff (named below). Furthermore, I filled the position of corresponding author of the publication and coordinated the authors.
All laboratory work for this publication was performed by Joachim Gläsner and Andreas Hiergeist, with support by Nadja Reul, Claudia Deinzer, Christine Irtenkauf and Holger Melzl at the Institute of Clinical Microbiology and Hygiene at the University Clinic Regensburg. This included animal housing, harvesting, sample preparation, sequencing and quantification of 16S-rDNA copies. Human stool samples for this manuscript were collected and provided by Prof. Dr. Holler and Dr. Weber and their staff at the Department of Haematology and Oncology at the University Clinic Regensburg.
Frank M.N. Stämmler
June 2019
Acknowledgements
Firstly, I wish to express my sincere gratitude to my supervisor Prof. Dr. Rainer Spang for his ambitious support and guidance throughout my doctorate, as well as his patience and motivation.
Furthermore, I am thankful for him providing me a productive and fun place to work at the Department of Statistical Bioinformatics. Besides my supervisor, I would like to give a special thanks to my further advisor Prof. Dr. Dr. André Gessner for generously providing a vast amount of data and fruitful discussion. Also for nurturing my fascination for the human microbiome and its relationships to the host, as well as introducing me to the annual conference meetings
"Microbiota and Host" at Seeon Monastery.
Also many thanks go to my thesis committee, mentors Rainer Merkl and Sven Rahmann, as well as to everyone at the Regensburg International Graduate School of Life Sciences (RIGeL).
A special thanks is directed to Joachim Gläsner and Andreas Hiergeist for all the helpful hours of discussions, explanations, encouragement, motivation and their efforts in the laboratory to create all the data which I was able to use during my thesis. In this context, I also would like to thank Nadja, Claudia, Christine and Holger for their excellent work throughout all experimental procedures of sample preparation and sequencing.
Furthermore, I would love to thank all collaboration partners during my time as PhD student and everything I have learned from them. Namely, Peter Oefner, Ernst Holler and Daniela Weber.
Above and beyond, I feel very grateful that I had the honour to work with such terrific colleagues
and discussion partners at the Department of Statistical Bioinformatics including Claudio, Anton,
Christian, Paula, Farhad, Thorsten, Julia, Nicholas, Michael G., Franziska G., Michael A., as
well as Franziska T. and Martin P..
Summary
With the emergence of high throughput next-generation sequencing the importance of the human gut microbiota as regulators, modulators and maintainers of human health and disease became more and more imminent. Advances in sequencing in the last two decades enabled the analysis of the composition and dynamics of the gut microbiome in unprecedented resolution and complexity. Investigations of this complex community by marker gene studies allowed assertions on presence, absence and ecological dynamics of gut bacteria. Several studies discovered strong relationships between the gut microbiota and human health. Some of these bacteria are shown to be essential for daily life processes like digestion, nutrition uptake, pathogen resistance and immune maturation. Likewise, disturbances of this close relationship, called dysbiosis, have been found to be associated with diseases like diabetes, obesity, colon cancer and inflammatory bowel disease. All this renders the gut microbiome as a highly relevant target of research in medical diagnostics and microbiome community analysis a valid hypothesis building tool.
Nevertheless, the vast amount of different methodologies and lack of broadly accepted standards to create and handle gut microbiome abundance data complicates reproducible or replicable findings across studies. Especially in settings, where samples diverge significantly in their total biomass or microbial load, the analysis of the microbiome is hampered. Several efforts to allow accurate inter sample comparisons have been undertaken, including the use of relative abundances or random feature sub-sampling (rarefaction). While these methodologies are the most frequently used, they are not fully capable to correct for these sample-wide differences. To increase comparability between samples the use of exogenous spike-in bacteria is proposed to correct for sample specific differences in microbial load. The methodology is tested on a dilution experiment with known differences between samples and successfully applied on a clinical microbiome data set. These experiments suggest that current analysis methods lack a pivotal angle on the data, that is comparability between samples differing in microbial load. Meanwhile, the proposed spike-in based calibration to microbial load (SCML) allows for accurate estimation of ratios of absolute endogenous bacteria abundances.
Furthermore, microbiome community analysis is heavily dependent on the resolution of the
underlying read count data. While resolutions such as operational taxonomic units (OTUs)
generally overestimate diversity and create highly redundant and sparse data sets, agglomerations to common taxonomy can obfuscate distinct read count patterns of possible sub-populations inside the given taxonomy. Even though the ladder agglomeration strategy might be valid for taxonomy with low phenotypical divergence, plenty taxonomic lineages in fact contain highly diverse sub-species. Thus, a more appropriate taxonomic unit would adapt its resolution for those densely populated branches, allowing for different count resolutions inside the same community. Here the concept of adaptive taxonomic units (ATUs) is introduced and applied on a perturbation experiment including mice receiving antibiotics. For this data set the different classical count resolutions (i.e. collapsed to order, family or genus etc.) produce highly contradictory results.
Meanwhile, adaptive taxonomic units (ATUs) derived by hierarchical affinity merging (HAM) adapt the granularity of taxonomy to the underlying sequencing data. Branches of bacterial phylogeny that are highly covered in the data set receive a higher resolution than those that were infrequently observed. The algorithm hereby merges operational taxonomic units (OTUs) guided not only by sequence dissimilarity, but also by count distribution and OTU size. Due to the agglomeration the number of features is reduced significantly, lowering the complexity of the data, while preserving distributional patterns only observable at OTU level. Consequently, the sparsity of the count data is reduced significantly such that every ATU accumulates reasonable count number and can thus be reliably analysed. The algorithm is provided in the form of the R-Package dOTUClust.
xii
Table of contents
List of Abbreviations I
List of figures III
List of tables V
1 Introduction 1
1.1 A brief history of microbiome research . . . . 1
1.2 The gut microbiome . . . . 3
1.2.1 Beneficial effects of the gut microbiome . . . . 3
1.2.2 Dysbiosis and disease association of the gut microbiome . . . . 3
1.2.3 Implications on medical treatment strategies . . . . 4
1.3 Microbiome community profiling . . . . 5
1.3.1 Multiplexed 16S rRNA targeted amplicon sequencing . . . . 6
1.3.2 From raw reads to count data - Operational taxonomic units (OTUs) . . 7
1.3.3 Normalization and analysis of OTUs . . . . 9
1.4 Motivation . . . . 12
1.5 Thesis organization . . . . 12
2 Adjusting microbiome profiles for differences in microbial load by spike-in bacte- ria 15 2.1 Abstract . . . . 16
2.2 Introduction . . . . 17
2.3 Chapter Methods . . . . 18
2.3.1 Spike-in bacteria . . . . 18
2.3.2 Sample preparation and DNA extraction . . . . 18
2.3.3 Amplification of V3-V6 16S rDNA variable region and 454 pyrose- quencing . . . . 20
2.3.4 Quantification of 16S rRNA gene copy number by qRT-PCR . . . . 21
2.3.5 Computational analysis . . . . 22
2.4 Chapter Results . . . . 24
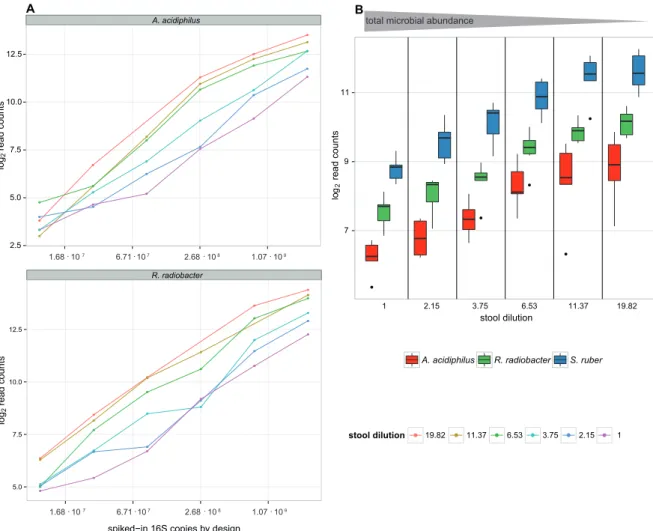
2.4.1 Spike-in bacteria yield different read turnouts but correlate well with microbial loads . . . . 24
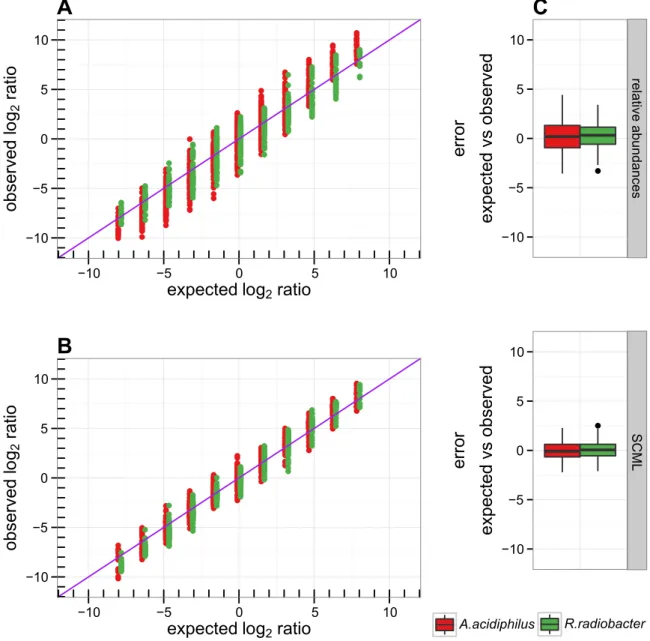
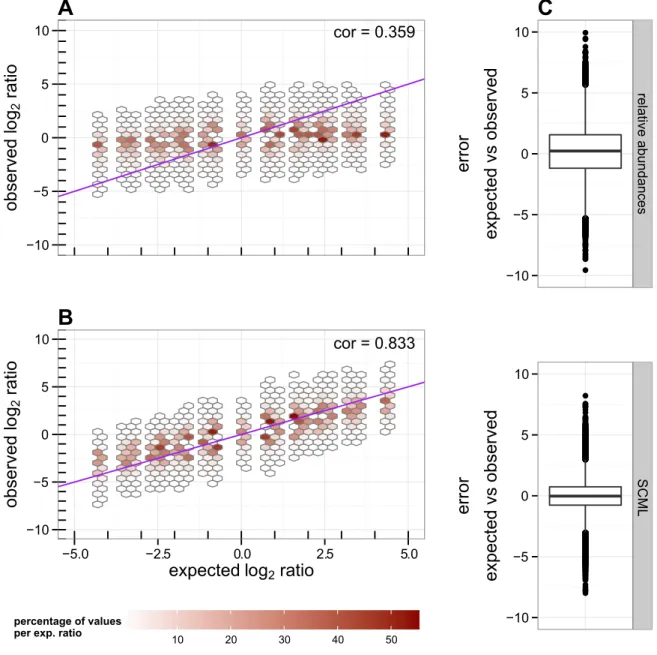
2.4.2 SCML yields almost unbiased estimates of ratios of absolute abundances within taxonomic units . . . . 24
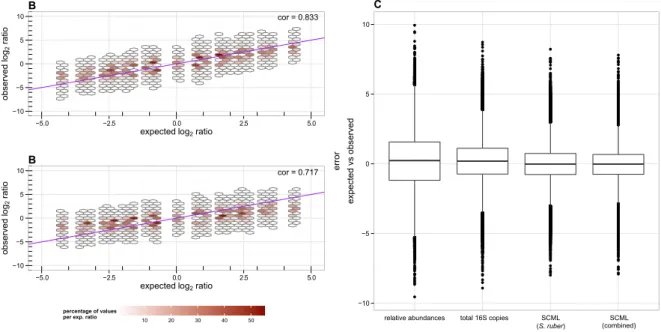
2.4.3 SCML allows more accurate estimation of ratios than calibrating for total 16S rRNA gene copies using qRT-PCR . . . . 27
2.4.4 Combining multiple spike-in bacteria reduces estimation errors . . . . 27
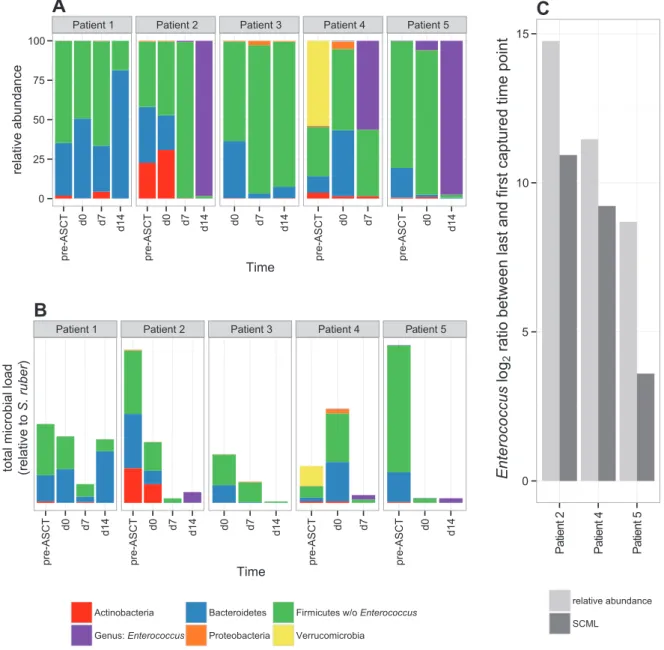
2.4.5 Calibration to microbial loads reveals absolute increase of Enterococcus in the intestine during allogeneic stem cell transplantation . . . . 30
2.5 Chapter Discussion . . . . 32
3 Dynamical refinement of operational taxonomic units with dOTUClust 35 3.1 Abstract . . . . 35
3.2 Chapter Motivation . . . . 37
3.2.1 How to count - A compromise between resolution and power . . . . 37
3.2.2 Ecological similarity as guide for species demarcation . . . . 40
3.3 Chapter Methods . . . . 42
3.3.1 Sample preparation and DNA extraction . . . . 42
3.3.2 16S rRNA gene amplicon sequencing and total 16S qPCR . . . . 42
3.3.3 Preprocessing and OTU clustering . . . . 43
3.3.4 Features to assess OTU similarity . . . . 43
3.3.4.1 Phylogenetic similarity - The Levenshtein Distance . . . . . 44
3.3.4.2 Ecological similarity - The Jensen-Shannon Distance . . . . 44
3.3.5 Dissimilarity score as merging guidance . . . . 45
3.3.6 Hierarchical Affinity Merging (HAM) . . . . 47
3.3.7 R-Packages used . . . . 49
3.4 Chapter Results . . . . 49
3.4.1 Proof of principle - mice receiving antibiotics . . . . 50
3.4.1.1 Assumptions based on read count data are biased by the level of granularity . . . . 50
3.4.1.2 OTU and taxonomy granularity are both prone to loss of information . . . . 51
3.4.1.3 HAM allows for dynamical enrichment of OTU count data by utilizing ecological and phylogenetic properties in micro- biome community analysis . . . . 53
3.4.1.4 Diversity estimates based on ATUs perform closer to ex- pectancy by experimental design . . . . 60
3.5 Chapter Discussion . . . . 64
xiv
4 Conclusion and outlook 69
Glossary 73
Appendices 75
Appendix A . . . . 75 Appendix B . . . . 83
References 101
List of Abbreviations
A. acidiphilus Alicyclobacillus acidiphilus 16, 18
ASCT allogeneic stem cell transplantation 17, Glossary: Allogeneic stem cell transplantation ATU adaptive taxonomic unit xii
GI-GvHD gastrointestinal graft-versus-host disease 17 GvHD graft-versus-host disease 4
HAM hierarchical affinity merging xii, xiv, 41 HMP Human Microbiome Project 2
JSD Jensen-Shannon distance 44
NGS next-generation-sequencing 2, 5, 40 NIH National Institutes of Health 2
OTU operational taxonomic unit xi, xii, Glossary: Operational taxonomic unit R. radiobacter Rhizobium radiobacter 16, 18
rRNA ribosomal RNA 5
S. ruber Salinibacter ruber 16, 18
SCML spike-in based calibration to microbial load xi, 17
WGSS whole-genome shotgun sequencing 2, 5
List of figures
1.1 Schematic overview hypervariable regions of 16S rRNA gene . . . . 7
2.1 Schematic depicting SCML . . . . 19
2.2 Microbial load inversely correlates with spike-bacteria counts . . . . 25
2.3 log 2 ratios of control spike-ins before and after adjustment by SCML . . . . 26
2.4 Background ratios SCML vs library size . . . . 28
2.5 SCML vs qPCR . . . . 29
2.6 Microbiome profiles of ASCT Patients . . . . 31
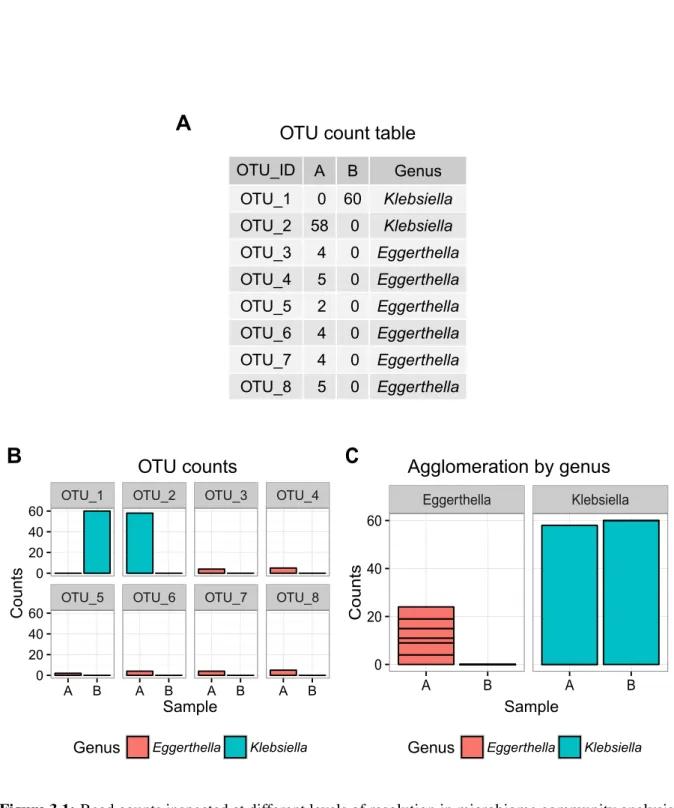
3.1 Different count granularities . . . . 38
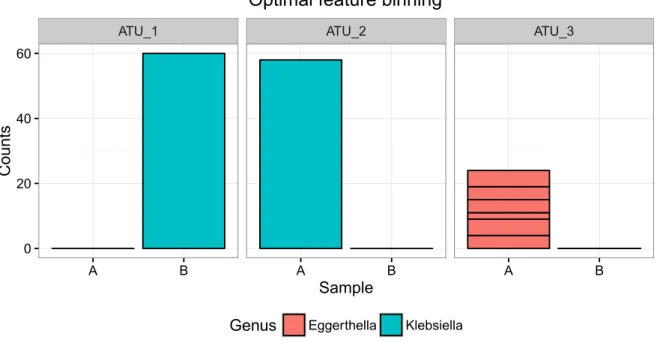
3.2 Optimal dynamic count table resolution . . . . 39
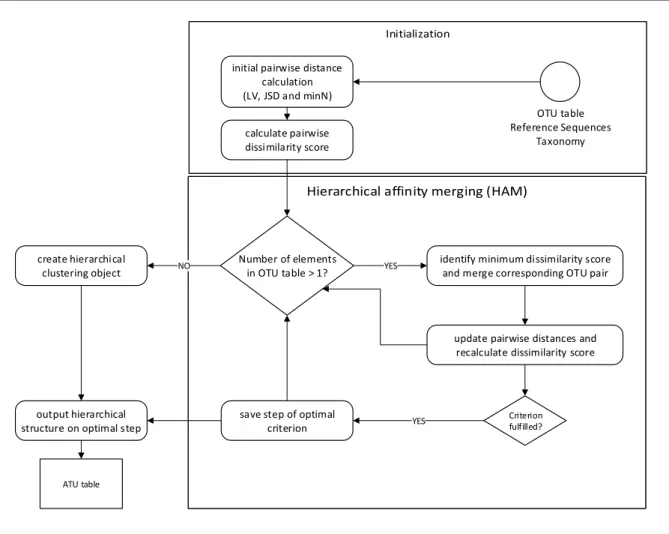
3.3 Flowchart illustrating HAM . . . . 48
3.4 OTUs in antibiotics treated mice . . . . 50
3.5 Heatmap comparing taxonomy counts versus OTU counts . . . . 52
3.6 Agglomeration of read counts by taxonomic rank . . . . 54
3.7 HAM Dendrogram on Subset . . . . 55
3.8 Read counts of OTU versus ATU versus Family . . . . 56
3.9 Contribution of OTUs to ATUs for three mayor families . . . . 58
3.10 Contribution of OTUs to ATUs for S24-7 candidate family . . . . 59
3.11 Comparison curation strategies on ABX subset . . . . 61
3.12 Comparison curation strategies on ABX full data . . . . 63
B1 Side by side comparison ATUs versus LULU . . . . 87
B2 Comparison in sample separability by bray-curtis distance . . . . 88
List of tables
3.1 Number of annotated sequences on different taxonomic ranks . . . . 53 3.2 Lost reads at different read count filtering thresholds . . . . 53 A1 qPCR measurements of species-specific and total 16S rDNA copies of Stämmler
et al. (2016) . . . . 76 A2 Design of dilution experiment of Stämmler et al. (2016) . . . . 77 A3 Six pools of bacterial mock communities used in Stämmler et al. (2016) . . . . 78 A4 Primers and hydrolysis probes used in Stämmler et al. (2016) . . . . 79 A5 Metadata mapping file for the dilution experiment of Stämmler et al. (2016) . . 80 A6 Metadata mapping file for the ASCT experiment of Stämmler et al. (2016). . . 81 A7 Spike-in concentrations by design for Stämmler et al. (2016) . . . . 82 B1 Experimental meta data of the antibiotics mice dataset . . . . 83 B2 Antibiotic compounds and their concentration in the drinking water fed to the
mice while treatment period. Concentrations are given in milligram per millilitre. 84 B3 Total 16S rRNA copies as measured by qPCR on diluted and undiluted sam-
ples. Compared to 16S rRNA amplicon sequencing, qPCR measurements were performed at an additional time point of 28 days into antibiotic treatment (ABT). 85 B4 Overview of parameter values chosen for raw sequence denoising by FlowClus.
This denoising-pipeline was used to prepare raw sequences from the antibiotics
experiment (see chapter 3). . . . 86
B5 ATU mapping of 263 OTUs of the antibiotics mice dataset . . . . 89
Chapter 1 Introduction
1.1 A brief history of microbiome research
It was when Anthonie van Leeuwenhoek observed the first unicellular microorganism in 1676 that his discovery initiated a long scientific endeavour finally leading to today’s microbiology and microbiome research. The scientific community struggled nearly a century long to recreate the precision of Leeuwenhoek’s microscopes, until with the invention of achromatic lenses the technology was advanced enough to finally enable a systematic description of the term bacterium by Christian Gottfried Ehrenberg [2]. Soon after, Louis Pasteur described the fermentation process and growth of yeast in 1860 [3]. With the classification of bacteria in four groups by Ferdinand Cohn, bacteriology and parts of today’s bacterial taxonomy were founded. While Robert Koch and Pasteur initially focused their research on the role of germs in diseases [4, 5], Pierre-Joseph van Beneden concentrated his research on their positive role. With his studies on Animal Parasites and Messmates he initiated a shift in the perception of bacteria. He was the first in coining the terms commensalism and mutualism amidst the 1870s [6]. From this moment on bacteria were no longer only considered solely interacting with the host as pathogens, but also coexist without creating harm (commensalism) or even offer benefits to their host (mutualism). Around the dawn of the 20th century Ilya Ilyich Mechnikov authored a book on the age prolonging effect of Lactobacilli, based on his observations of the prolonged life of Bulgarians as consequence of their yoghurt consume [7]. Even though his hypothesis did not hold, his writings did start an enthusiasm for beneficial pro- and microbiota, which persists until today [8, 9].
Until the late 20th century the identification and characterisation of microbiota was mainly
based on bacterial culture. Bacteria which happened to grow in culture, could be identified or
categorized by their phenotypic properties like growth medium, shape, size and biochemistry.
Understandably, this approach was not applicable for slow growing or uncultivable bacteria, which was estimated to be true for at least 80% of microbiota found in faecal specimens [10]. In particular for anaerobic bacteria this posed a problem [11]. Additionally, phenotypic methodology was not necessarily decisive for certain bacteria [12]. Especially in the context of medical diagnostics this was of major concern, where the successful identification of a pathogen might decide on the fate of a patient. This changed with the availability of DNA sequencing, when Carl Woese and his colleagues offered a phylogenetic approach to distinguish bacteria based on the genetic sequence of specific genes in the late 1970’s [13, 14]. Compared to bacterial culture, this marker gene approaches were culture-independent, allowing even the identification of uncultivable or slowly growing bacteria. On the back of this, the new approach allowed the extension of the classical eukaryote-prokaryote dichotomy, leading to today’s system of three domains of life: Archaea, Bacteria and Eukaryotes [15]. This major leaps were soon followed by the first completely sequenced genome of a bacterium, Haemophilus influenzae, by Craig J. Venter and fellow researchers [16], which also happened to be the first study to perform whole-genome shotgun sequencing.
When the first results of the Human Genome Project were published in 2001 [17, 18], it became more and more imminent, that some functions, as well as many phenomenons of disease and health, could not solely be explained based on the human genome itself. This paved the way for a paradigm considering the human as a super-organism, consisting not only of its own genome, but a collection of foreign genes and functions offered by a plethora of endogenous microbiota, viruses and fungi. Such collective of micro-organisms and their functions inside a habitat was termed a microbiome [19, 20]. By outnumbering the human in terms of genes by a factor of 100, its role on health and disease in this host-microbe relationship was investigated ever since [11, 21–24]. A new scientific field was born: microbiome research.
In 2004 Venter et al. utilized whole-genome shotgun sequencing to analyse the microbial content of seawater samples from the Sargasso sea [25]. This metagenomic study was the first of its kind to analyse a environmental microbiome as a whole. On the basis of this study, further advances in sequencing technology and the emergence of next-generation-sequencing the Human Microbiome Project (HMP) was initiated in 2007, supported by the National Institutes of Health (NIH) Common Fund [26–29]. The aim of this project was to screen and analyse the composition and characteristics of the bacterial communities in all different human body habitats and assess their effects on health and disease of their host. Various large scale studies should follow, notably, Metagenomics of the Human Intestinal Tract (MetaHIT) [30], The Earth Microbiome project (EMP) [31] or The Flemish Gut Flora Project [32]. Each of them contributed to the revelation and characterisation of the relationships between host and microbe, but also among microbes themselves.
2
1.2 The gut microbiome
In humans, microbiomes are found on the skin and in all sorts of cavities like mouth, nose, lungs, vagina and gut. The latter is called the human gut microbiome and the analysis of its composition, as well as changes within it, will be the focus of this work. Throughout this thesis the term microbiome will be used as a description for the collection and community of bacteria in the gut.
Many studies in recent years reported links between the community composition or functions of the gut microbiome and the health and disease state of the host [22, 33]. In the following two sections examples for these relationships, positive and negative alike, are briefly introduced (see 1.2.1 and 1.2.2).
1.2.1 Beneficial effects of the gut microbiome
In a healthy state, the gut microbiome beneficially impacts our daily life. As soon as neonatal colonization takes place, the gut microbiota start to help in maturation, shaping and training of their hosts adaptive immune system [34–37]. They can also act in pro- and anti-inflammatory manner and directly induce certain immune responses [38]. These relationships, combined with their aid in the defence against pathogen invasion [39–42], highlight their importance for a functioning immune system. The gut microbiome further provides enzymatic reactions which complement our digestion and degradation capabilities of carbohydrates and other compounds in the gut [43–46], while being specialized on the host’s diet and lifestyle [47–49]. Besides this, some studies suggest that gut bacteria also participate in the biosynthesis of essential amino acids and omega-6 fatty acids [50], signalling molecules like short chain fatty acids (SCFAs) [51, 52] or impact host biosynthesis [53].
1.2.2 Dysbiosis and disease association of the gut microbiome
All the aforementioned beneficial associations directly imply that a functional and healthy
gut microbiome is essential for daily functions and the health of the host. As a consequence
perturbations and dysbiosis of the gut microbiome are linked with several diseases and conditions
in humans and mice. According to its essential role in digestion and nutrition, an impaired
microbiome is highly associated with metabolic disorders like obesity, metabolic syndrome and
type 2 diabetes [54, 55]. The microbiome composition and function is shown to be affected by
the hosts diet [56], altered in obese compared to lean hosts [57, 58] and additionally contributing
to increased energy harvest [59]. Comparably associations between gut microbial composition
and type 1 diabetes, an autoimmune disorder, are recently pointed out by several studies [60, 61].
As residents of the intestine and neighbours of the intestinal barrier, gut microbiota are also found to be involved in the development and severity of inflammatory bowel disease (i.e. ulcerative colitis and Crohn’s disease) [62, 63]. Likewise, some pathobionts (i.e. non-pathological bacteria which can turn pathological) and pathogens can operate as risk factors, promoters and modulators of colorectal cancer [64–70].
Furthermore, the ability of the gut microbiota to modulate inflammation also impacts the well being of patients after undergoing allogeneic stem cell transplantation. The absence of certain residential bacteria can aggravate graft-versus-host disease (GvHD) in those patients [71]. Additionally, the use of systemic antibiotics increases the risk of GvHD by disrupting the protective microbiome [71–74].
1.2.3 Implications on medical treatment strategies
All the progress in understanding the interplay between gut microbiota and its host did not only unfold the vast diagnostic potential with regard to several diseases, but also paved the way for alternative treatment strategies targeting the microbiome. One successful example being faecal microbiota transfer (FMT) to treat patients with recurring Clostridium difficile infections [75].
This otherwise hard to fight infection is treated by transplanting gut bacteria from a healthy donor in the infected patient. After several repetitions some of the donor’s microbiota become residents to the new host. These newly resident or replenished bacteria compete or even directly fight with the pathogen. Application of the same techniques to treat more complex conditions like Crohns disease or other inflammatory bowel diseases showed less optimistic results [76], indicating that the current FMT procedures in that field need further tuning and improvement.
Beyond that, a growing field of research is personalized or precision medicine, where insights on the patients gut microbiome could guide future therapeutic decisions and infer possible therapy outcome individually [77]. Examples for guided interventions could be the administration of precision drugs, pre- or pro-biotics to modulate the susceptibility of a patient towards a specific treatment [66, 74, 78–82]. Recently, some gut bacteria were shown to reduce the effectiveness of medications by its capability in the inactivation and degradation of drugs [83, 84].
In the following, I will give an overview about the rise of community profiling and its application.
Further, I introduce state-of-the art protocols for microbiome community analysis and discuss their features and possible shortcomings.
4
1.3 Microbiome community profiling
Community profiling represents a first step in the investigation of links between the gut micro- biome and certain phenotypes, disease and health alike. It is used to assess questions on presence, absence, functions or the dynamics of the gut microbiota by investigating the microbiome com- position of a sample [85]. For this purpose for example faecal, luminal or biopsy samples can be screened by utilizing next-generation-sequencing (NGS) to perform either whole-genome shot- gun sequencing (WGSS) or targeted amplicon sequencing. The choice of methodology depends on the scientific question. To answer questions on the functional capability of a microbiome, WGSS is used to analyse the gene content of the community residing in the sample [25, 86, 87].
Generally for WGSS, isolated DNA is sheered into fragments of random length, sequenced separately and the resulting fragments are assembled into contigs. These contigs can then be mapped against gene catalogues like KEGG GENES, enabling identification of functions and metabolic pathways involving these genes via KEGG Orthology [88, 89]. Because the contigs arrising from WGSS are longer than usually used marker genes, the resolution for identification of bacteria can be higher. Despite the possibilities of WGSS, confidently mapping from genes to organisms remains a very challenging task, which complicates investigations on composition and diversity based on such data. Additionally, WGSS is the more complex, time consuming and expensive of both methods and hence not available for every research group [85, 90].
A more widely used technique, especially, if the emphasis of the study lies on the microbiomes composition and diversity, is marker gene based amplicon sequencing. Protocols for this methodology involve DNA extraction followed by targeted polymerase chain reaction (PCR) amplification and subsequent sequencing. Dependent on the chosen target marker gene, this approach produces mainly sequences of bacterial origin compared to WGSS, which contains all sorts of meta-genomic content (i.e. DNA of human, viral, fungal and bacterial origin). The most used marker gene for community profiling of the microbiome is the 16S ribosomal RNA (rRNA) gene, a part of the 30S small subunit (SSU) of the prokaryotic ribosomal RNA. This gene has been shown to reliably reconstruct phylogenies and allows to distinguish bacteria from one another [13, 85, 91–93].
Compared to WGSS, 16S rRNA sequencing shows lower computational complexity and there-
fore is applicable to studies containing more samples (e.g. many patients or longitudinal study
designs) [94]. Furthermore, because of superior curated reference databases, lower costs, as well
as better detection of rare species 16S rRNA amplicon sequencing still is considered a viable
and reasonable approach to profile a microbiome community structure up to genus level [95],
especially if the amplicon size approximates full length of the 16S rRNA [96].
Being such a straight forward, fast and established technique, 16S rRNA amplicon sequencing is often used to address initial hypotheses and guide further validation experiments down the road. For example Goodrich et al. studied the gut microbiome of twins and unrelated persons for microbial taxa which are dependent on host genetics, when they found that a certain heritable taxon was enriched in individuals with low body mass index [58]. Based on this observation, they set up an experiment where they administered microbiome communities with and without this taxon to mice. Those which carried the bacterium showed reduced weight gain during the experiment (see [58] for details).
In the remainder of this introduction I will focus on community profiling based on 16S rRNA targeted amplicon sequencing and its analysis, as the data used in this thesis is solely based on this methodology.
1.3.1 Multiplexed 16S rRNA targeted amplicon sequencing
For the successful identification of bacteria by utilizing marker genes two things are mandatory:
First, one needs to find a region in the genome (a gene or a part of a gene) which is conserved over many species. This means a gene with a conserved and important function which is mandatory for survival of the organism. Second, downstream to this target region there should be more variable regions, which are marked by evolutionary changes. The first part gives you the target position to start amplification. The second the sequence to investigate diversity. Ribosomes are an example of essential mechanisms and their rRNA shows high levels of genetic conservation while also containing some hypervariable regions.
Prokaryotic ribosomes consist of two molecular subunits: the small subunit (SSU) and the large subunit (LSU). Both subunits contain several ribosomal proteins and at least one rRNA species.
For the LSU these are the 23S and 5S species and for the SSU it is the 16S rRNA species.
The latter is generally not found in eukaryotes (except in mitochondria and chloroplasts). This specificity allows to target mainly for rRNA of bacterial and archaeal origin by targeting the 16S rRNA gene [97]. The roughly 1.540 base pair long 16S rRNA gene contains several conserved and nine hyper-variable regions (V1-V9) [98], allowing for taxonomic differentiation between bacteria [13, 91–93]. Due to its relatively short length (1.5kb) sequencing the 16S rRNA is fast and cheap compared to other marker genes. After two decades of usage as marker gene in phylogeny and microbial ecology, the 16S rRNA gene is also well characterized and many databases containing reference sequences like the Greengenes database [99, 100] or the SILVA ribosomal RNA gene database are available [101].
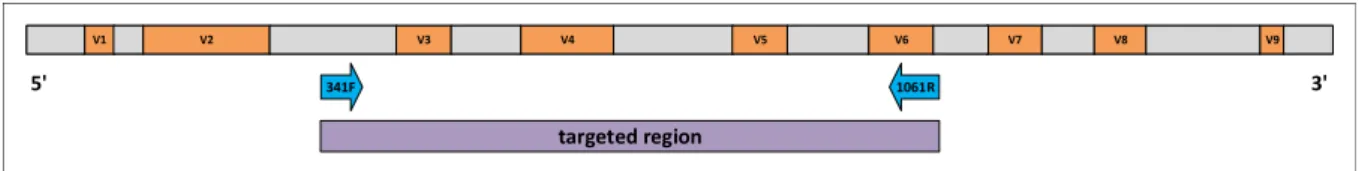
With 16S targeted amplicon sequencing the hyper-variable regions of the small subunit are selected, amplified and sequenced. Figure 1.1 illustrates the hyper-variable (red) and conserved
6
V1 V2 V3 V4 V5 V6 V7 V8 V9
V1 V2 V3 V4 V5 V6 V7 V8 V9
1061R 341F
targeted region
5' 3'
Figure 1.1: Schematic depiction of the distribution of hypervariable (red rectangles) and conserved (grey rectangles) regions on the 16S rRNA gene. Exemplary for amplicon sequencing of a targeted region (purple rectangle), forward and reverse primers are illustrated as blue arrows. This primer combination was chosen for all experiments associated with this thesis.
(grey) regions of the 16S rRNA gene schematically. Selection of specific regions can be controlled by the use of region specific primer pairs (e.g. blue arrows in Figure 1.1), which are chosen in the conserved parts upstream of the region of interest (e.g. purple rectangle in Figure 1.1) [102]. The hyper-variable regions on its own show different performance in the identification of certain bacteria [103]. If possible, read lengths spanning more than one hyper-variable region are chosen to increase the identification accuracy [104–106]. Generally, one to three consecutive variable regions can be selected per study, depending on the maximum read length determined by the sequencing technology. For each sample, a mixture of region specific primers is paired with a unique artificial sequence of length 12, the sample barcode, to be able to trace a sequences sample of origin [107, 108]. This multiplexing approach also allows to sequence multiple samples in the same sequencing run, without loosing information on the origin of a sequence.
Protocols for 16S amplicon sequencing differ depending on the used platform and technology, but follow a general procedure. First PCR amplification in combination with target-specific primers is performed to produce amplicons specific for the selected hyper-variable region (see above). Afterwards, these marker gene amplicons are purified and cleaned, before being finally sequenced. The resulting raw read sequences undergo quality control steps and are transformed to read count data, which lies the basis for studies on the microbiomes diversity and composition.
Sequencing technologies to perform 16S amplicon sequencing include platforms by Roche, Illumina, Ion-Torrent (PGM), Oxford Nanopore and Pacific Biosciences (SMRT).
1.3.2 From raw reads to count data - Operational taxonomic units (OTUs)
Many microbiotas of the gut are still unknown or uncultivable, which complicates microbe classification based on phenotypes. Targeted amplicon sequencing of the 16S rRNA gene allows high throughput identification of these bacteria. Nevertheless, sequencing errors introduce non-biologic variance in the sequence, artificially increasing sequence dissimilarity [109].
Counting unique sequences would result in a highly complex count table with a huge number
of features, many of which would have just arisen by error. Additionally, microbial ecology
is still missing a defined concept for clear demarcation of bacterial species, complicating the identification and quantification of microbiota in microbiome samples [110–112]. A pragmatic approach to address these issues is to cluster 16S rRNA sequences in groups or phylotypes based on their pairwise sequence similarity. In 2005 Blaxter et al. introduced this concept of molecular operational taxonomic units (MOTUs) [113]. These clusters should serve as a proxy for microbial "species", especially in settings where "robust taxonomic hypotheses are difficult to construct" (i.e. biosphere/microbiome) [113]. The naming of these clusters was soon simplified to OTUs.
The demarcation of OTUs generally is controlled by a threshold of percent sequence identity (usually 97%) [114], which allows sequences to cluster together which show divergence of up to 3% sequence identity. Mapping sequences against centroids of the different OTUs then creates count tables which reflect the abundance of each OTU (feature) per sample. Even though the concept of OTUs is criticized for its use of a general genetic similarity cut-off over all species [115, 116], it allows a general approximation on taxonomical composition and diversity and therefore is still the most widely used technique in the field to date. Especially, because of the variability of the 16S rRNA gene even inside the same genome, clustering of read counts seems a mandatory task before community analysis[117].
The last decade gave rise to many tools and algorithms offering clustering of 16S rRNA gene sequences into OTUs [118–120]. The most prominent workflow tools to pick OTUs and analyse the composition and diversity of microbiome samples are QIIME [119] and mothur [118].
While exhibiting smaller differences, both tools follow a general pattern of data processing:
(i) quality control and demultiplexing, (ii) OTU demarcation (creation of OTU table), (iii) taxonomic assignment and finally, (iv) compositional and diversity analysis based on resulting OTU tables.
First, all raw sequences are checked for different quality criteria. These criteria can be thresholds for sequence length (minimum and maximum), base quality, maximum number of ambiguous bases, homopolymer length and primer mismatches. With QIIME this step also contains demultiplexing of sequences, which is the grouping of sequences based on their sample of origin by assessing the sample specific barcodes at the 5’ end of each read. In the following, the filtered reads are checked for chimeric sequences. Because these hybrid sequences, which consist of two or more parent sequences, artificially skew diversity and species estimations, they are identified upfront and excluded from further analysis [121, 122]. In a next step OTUs are called (i.e.
picked) based on a user defined sequence similarity threshold on the quality filtered sequences.
There are three strategies to pick OTUs. First de novo OTU picking, which calls OTUs based on a clustering of all input sequences [123–125]. Second reference based OTU picking, guided by a reference database [104], and third a combination of both, called open-reference OTU picking.
8
While closed reference OTU picking is the fastest of all three, it is also restricted to the databases in use. This means that sequences which do not map against any reference sequence in the database are omitted from further analysis and therefore lost. De novo OTU picking on the other hand is independent of any database and therefore preserves and clusters each input sequence.
Simultaneously, it is the more computationally expensive approach and therefore not applicable for larger datasets. Open reference OTU picking uses a reference database and all sequences, which would have been discarded due to not matching a reference in the database, are clustered de novo. This hybrid approach offers a faster execution compared to pure de novo OTU picking, while also retaining all input sequences. Nevertheless, for big datasets this approach can still be slow.
After successful OTU picking, each sequence is assigned the taxonomy of its parent OTU. This step again deviates between the strategies. In de novo OTU clustering for each OTU the most abundant sequence or representative sequence determines the taxonomy of the OTU and all its containing sequences. The closed-reference approach, on the other hand, uses the taxonomy of the already pre-clustered reference OTUs. The hybrid open-reference approach utilizes the principles of both other techniques to assign taxonomy to each OTU depending on its origin (de novo or closed). Finally, OTUs are assigned a taxonomy and a count table can be produced.
At this point the user can choose at which resolution he wants to retrieve the count table. The options to choose from are either to get the OTU count table or a collapsed version of it at a user defined taxonomic rank (e.g. family). Even though the clustering into OTUs significantly reduces the number for features, OTU count tables still suffer from high sparsity, which means that many features are rarely observed throughout all samples and many zeros are present in the data. Generally, sparse read counts can occur due to insufficient sequencing depth (i.e.
under-sampling), overpopulated reference databases (i.e. multiple hits on different reference genomes), or just because the species truly shows very low abundance [126].
More recently developed approaches count occurrences of unique sequences [127, 128]. This so called exact-sequence-variants (ESV, also referred to as amplicon-sequence-variants) offer a higher resolution than OTUs, but simultaneously suffer from highly increased sparsity and feature complexity.
1.3.3 Normalization and analysis of OTUs
Normalization strategies
To use the generated count tables (OTUs or taxonomy) as basis for further analysis it is necessary
to make sure that the counts are comparable between samples. As library sizes (total read
counts per sample) vary, proper normalization is mandatory. Differences in library size can occur either due to technical or biological effects and it is hard to discern how much of the difference can be attributed to which of these sources [129]. These differences in library sizes complicate the identification of potential biomarkers by over- or underestimating effect sizes in differential abundance analysis. One often used approach to make species counts between samples comparable is to transform those into relative abundances. To do so each OTU count in a sample is divided by the total library size (i.e. total read counts) of the respective sample.
Relating the abundance of an entity or species on the sample’s library size offers a pragmatic approach to allow a certain degree of between sample comparability. However, library sizes are no fixed quantity, but rather a fraction of the originating environment. Hence, the library size of a sample is highly dependent on sequencing efficiency, as well as susceptible for under- and oversampling effects. Simultaneously, the compositional nature of relative abundances cannot capture absolute changes in microbiota abundance, if the microbial load between samples differs.
Especially in disease context, patients are often subject of major disturbances (e.g. antibiotics exposure, diet or physical damage to the intestinal barrier) of the intestinal flora, which can result in different microbial load.
An alternative approach is to correct for different read depths by randomly sub-sampling to an even depth across samples (i.e. rarefaction) [130, 131]. For this purpose the smallest library size of all samples is chosen as count boundary for the random sampling. If for example the lowest library size is 5000, then all samples are randomly sub-sampled down to this number. Even though this approach eliminates heteroscedasticity for differing library sizes, it also reduces the information by throwing away features for every sample except one, which especially affects rare species. This again hampers differential abundance analysis by omitting probably important information [132].
Diversity analysis
Following quality filtering and normalization of the count data, ecological diversity of the community is the first object of investigations. Hereto three terms for measuring biodiversity can be examined, which were first described in community ecology by Robert Harding Whittaker in 1972: α -, β - and γ -diversity [133–135].
The first component, α -diversity, informs about the within-sample diversity and is a measure for the richness and evenness of each sample on its own. Richness measures the number of species in an ecological community, whereas evenness describes how homogeneous the abundances of these species are distributed in the community [133, 136]. There are several measures and diversity indices to inspect a samples richness or evenness [134]. The most popular diversity
10
indices in microbiome ecology to measure α -diversity are the Shannon index [137] and the Simpson index (including its transformations) [138].
The β -diversity on the other hand describes differences in diversity between different habitats or samples (between-sample diversity) [139]. The most common measure for β -diversity is the Bray-Curtis dissimilarity [140], which describes the absolute species overlap between two populations. While Bray-Curtis dissimilarity utilizes overlap, there are measures like UniFrac [141–143], which additionally take sequence similarity between species into account.
In recent years, several studies have linked decreased gut microbiome diversity or dysbiosis with a multitude of diseases and disorders like colorectal cancer [68], ulcerative colitis in children [144], Crohn’s disease [145] or myalgic encephalytis/chronic fatigue syndrome [146]. However, because there is no true consensus in methodologies regarding the proper preprocessing and normalization of microbiome community data, these diversity measures can vary greatly between studies. This inter study variation can stem from the OTU-picking algorithm, the count resolution (e.g. 97%, 99% or taxonomic rank), the existence of chimeric sequences and technical noise (i.e.
sequencing errors). For example screening the same population once based on 97% sequence identity OTUs and once based on 99% OTUs will produce different estimates of diversity, with the 99% being assessed as more diverse than the 97% OTUs.
Differential abundance and taxonomic biomarker discovery
In microbiome research, investigators are especially interested in the identification of microbiota, which are strongly associated with specific conditions. These key microbiota can be identified by searching for statistically significant differences in species abundance between for example healthy and disease populations or different host phenotypes [147, 148]. Several methods and tools have been proposed to assess differential abundance in microbiome studies, ranging from sample-wise comparisons (MEGAN [149, 150] and STAMP [151]), over simple statistical tests and principal components analysis as in mothur [152], UNIFRAC [141] and MG-RAST [153], up to more sophisticated approaches as Metastats [154], linear discriminant analysis (LDA) effect size (LEfSe) [147] or metagenomeSeq [148].
In general, differential abundance analysis is highly affected by the type of normalization strategy
[129, 132].
1.4 Motivation
The ever increasing importance of the microbiome regarding the well being and health of humans makes it a popular investigation target for medical diagnostics and treatment planning. Just as knowledge about the patients microbiome can support the diagnostic process, so can it guide the decisions on possible treatment and medications. This impact makes reproducibility and comparability highly mandatory. Especially diagnostic settings demand proper standardization and normalization of the data. Absence of broadly accepted standards exacerbates this issue in microbiome studies, as highlighted by several critics [155–158]. Such normalization stan- dard would allow to control for sample specific effects like differences in total meta-genomic concentrations or counts, sample preparation, as well as differences in cell lysis or sequencing efficiency.
Furthermore, read count data for microbiome studies tend to be sparse and exhibit many low read count entities (i.e. OTUs) [126]. Additionally, only a fraction of species inside the human gut for example are known, which makes counting read counts a cumbersome task. These issues further impede proper statistical analysis and researchers often reduce these sparse datasets by omitting OTUs with low read counts, based on arbitrarily chosen thresholds. Alternatively, all OTUs are collapsed by their assigned taxonomic rank (e.g. family or genus), reducing sequencing error and complexity. However, both methods tend to discard information which might be important.
While the first does this directly, the second omits all entities missing an definite taxonomic assignment at the chosen level.
1.5 Thesis organization
Following this general introduction upcoming chapters of this thesis are organized as fol- lows.
Chapter two (see 2) covers the standardisation of microbiome profiles by the use of exogenous spike-in bacteria and its impact on the interpretation of microbiome community data. This chapter is based on our publication, Staemmler et al. (2016) [1]. First I shine a light on state-of- the art analysis in microbiome research and point out resulting problems with these approaches.
A chapter specific methods section follows. Finally, the results of this chapter are illustrated and discussed afterwards.
The optimization of microbiome community analysis with the help of feature binning is handled in chapter three (see 3). Motivation specific for that topic is given, uncertainties in current research are highlighted and concepts for tackling these are introduced. Build upon this, I exhibit
12
dOTUClust, an R package for feature binning in microbiome data. The rationale, as well as the
working scheme of the incorporated algorithm are explained. As a proof-of-principle I apply
dOTUClust on a small microbiome data set of mice under antibiotic exposure and present how
this method strengthens microbiome analysis. Finally, I give a summary of the results of chapter
three and point out implications of the findings of chapters two and three for future research in
the field of microbiome community analysis in chapter four (see 4).
Chapter 2
Adjusting microbiome profiles for
differences in microbial load by spike-in bacteria
This chapter has been adapted from Stämmler et al. [1]:
Stämmler F, Gläsner J, Hiergeist A, et al. Adjusting microbiome profiles for differences in microbial load by spike-in bacteria. Microbiome. 2016;4:28. doi:10.1186/s40168-016-0175- 0.
All laboratory work for this chapter was performed by Joachim Gläsner and Andreas Hiergeist, with support by Nadja Reul, Claudia Deinzer, Christine Irtenkauf and Holger Melzl at the Institute of Clinical Microbiology and Hygiene at the University Clinic Regensburg. This included animal housing, harvesting, sample preparation, sequencing and quantification of 16S-rDNA copies. Human stool samples for this chapter were collected and provided by Prof.
Dr. Holler and Dr. Weber and their staff at the Department of Haematology and Oncology at
the University Clinic Regensburg. All experimental procedures were approved by the Ethics
Committee of the University Medical Centre of Regensburg.
2.1 Abstract
Background Next-generation 16S ribosomal RNA gene sequencing is widely used to deter- mine the relative composition of the mammalian gut microbiomes. However, in the absence of a reference, this does not reveal alterations in absolute abundance of specific operational taxonomic units if microbial loads vary across specimens.
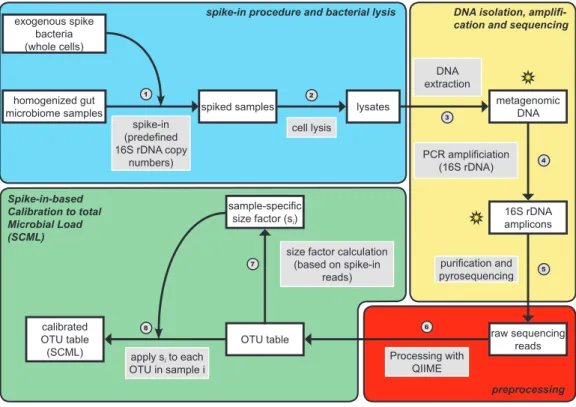
Results Here we suggest the spiking of exogenous bacteria into crude specimens to quantify ratios of absolute bacterial abundances. We use the 16S rDNA read counts of the spike-in bacteria to adjust the read counts of endogenous bacteria for changes in total microbial loads.
Using a series of dilutions of pooled faecal samples from mice containing defined amounts of the spike-in bacteria Salinibacter ruber, Rhizobium radiobacter and Alicyclobacillus acidiphilus, we demonstrate that spike-in-based calibration to microbial loads allows accurate estimation of ratios of absolute endogenous bacteria abundances. Applied to stool specimens of patients undergoing allogeneic stem cell transplantation, we were able to determine changes in both rela- tive and absolute abundances of various phyla, especially the genus Enterococcus, in response to antibiotic treatment and radio-chemotherapeutic conditioning.
Conclusion Exogenous spike-in bacteria in gut microbiome studies enable estimation of ratios of absolute OTU abundances, providing novel insights into the structure and the dynamics of intestinal microbiomes.
16
2.2 Introduction
Current studies on community composition focus on the relative abundance or proportions of OTUs [56, 159]. As an example, a specific OTU may contribute 5 % to microbiome A and 10 % to microbiome B corresponding to a ratio of 1:2. If we further assume that the total number of bacteria or microbial load of A is four times larger than in B, the 5 % in A account for twice as many bacteria as the 10 % in B, thus bringing the actual ratio to 2:1.
Antibiotic treatment, diet, and/or disease affect both microbial loads and compositions. For example, Holler et al. [72] observed that the relative abundance of the genus Enterococcus in stool specimens collected from patients undergoing allogeneic stem cell transplantation (ASCT) can increase from undetectable levels prior to ASCT to up to 94 % after ASCT. More interestingly, this relative shift to Enterococcus was associated with an increased risk of acute gastrointestinal graft-versus-host disease (GI-GvHD). Without knowledge of total microbial load, however, it is impossible to infer whether this shift was the result of either an absolute increase in the number of Enterococcus or a decrease in the number of bacteria other than Enterococcus.
Application of synthetic spike-in standards allows for changing the profiles’ reference points.
The reference point of relative abundances is a fixed aliquot of 16S rDNA. These profiles are insensitive to the microbial load of a stool specimen. Adding controlled amounts of spike-in material allows for rescaling the profiles such that the measured concentrations of the standard are constant across samples, making the spike-in standard the new reference point of the profiles and the profiles sensitive to microbial loads. Spike-in strategies featuring different GC contents and covering a wide concentration range in combination with appropriate normalization strategies have already been proposed to correct for library preparation and nuisance technical effects in the inference of gene expression levels from RNA-Seq experiments [160]. This approach, as well as similar schemes employed in proteomics [161] and metabolomics [162], adds the spike-in standards to transcriptomes, proteomes and metabolomes only after cell lysis and extraction of mRNA, proteins and metabolites, respectively, and thus do not allow correction of variation originating from these critical experimental steps. Recently Jones et al. [157] suggested using whole cell spike-in controls for monitoring this technical variability in the field of microbiome research.
Extending their results, we here suggest the addition of exogenous viable spike-in bacteria to
rescale the read counts of endogenous bacteria. We call this protocol spike-in based calibration
to microbial load (SCML), and test it in a dilution experiment with defined absolute spike-in
bacteria abundances against serially diluted background microbiomes. Moreover, we reconsider
the emergence of Enterococcus as the predominant genus in ASCT using SCML.
2.3 Chapter Methods
2.3.1 Spike-in bacteria
In this study we used Salinibacter ruber (S. ruber) DSM 13855 T , an extreme halophilic bacterium found in hypersaline environments [163], Rhizobium radiobacter (R. radiobacter) DSM 30147 T, a non-phytopathogenic member of the Biovar I group of Agrobacterium found in soil and the plant rhizosphere [164], as well as the thermo-acidophilic, endospore forming soil bacterium Alicyclobacillus acidiphilus (A. acidiphilus) DSM 14558 T [165]. All bacteria were purchased from the DSMZ (German Collection of Microorganisms and Cell Cultures GmbH, Braunschweig, Germany). These eubacteria belong to different phyla typically found in mammalian faecal microbiomes, contributing to Bacteroidetes/Chlorobi group, Proteobacteria, and Firmicutes, respectively. They do not exist in the gut microbiome under physiological conditions and are well distinguishable from bacteria commonly found in the gut using 16S rRNA gene sequencing. S. ruber and R. radiobacter are gram-negative bacteria, whereas A. acidiphilus is a spore-forming gram-positive bacterium. The difference in the chemical constitution of the cell wall accounts for a specific susceptibility to the cell lysis protocol used. Spike-in bacteria were harvested in the late logarithmic/early stationary growth phase by centrifugation and subsequently resuspended in 5 ml of sterile PBS buffer. Bacterial densities in suspensions were quantified by OD600 measurement using empirical conversion factors determined by direct microscopic cell counting. Accordingly, 1 OD600 unit corresponds to 4.6x10 9 cells/ml for S. ruber, 1.4x10 9 cells/ml for R. radiobacter, and 1.2x10 9 cells/ml for A.
acidiphilus, respectively. 16S rRNA gene copy numbers per genome for the spike-in bacteria were obtained from the rrnDB database [166]. Six pools of bacterial mock communities containing S. ruber, R. radiobacter and A. acidiphilus were generated according to the scheme provided in supplementary table A3.
2.3.2 Sample preparation and DNA extraction
Mouse specimens
For the validation experiment, cecum contents were collected from three 12-week-old male C57BL/6J mice (200 mg wet weight each), immediately suspended into 1 ml of PBS, homoge- nized by means of the TissueLyser II (QIAGEN, Hilden, Germany), pooled, adjusted with PBS to a total volume of 4 ml, and split into seven aliquots of 550 µ l each. Six of these aliquots were diluted five times according to the scheme provided in supplementary table A2. Aliquot 7 was used as a non-spike control. Sixty microliters of the corresponding spike-bacteria pool (whole
18
exogenous spike bacteria (whole cells)
homogenized gut microbiome samples
spike-in (predefined 16S rDNA copy
numbers)
spiked samples
cell lysis
lysates metagenomic
DNA extraction DNA
16S rDNA amplicons PCR amplificiation
(16S rDNA)
raw sequencing reads purification and pyrosequencing
OTU table
Processing with QIIME calibrated
OTU table (SCML)
sample-specific size factor (s
i)
apply s
ito each OTU in sample i
size factor calculation (based on spike-in
reads) Spike-in-based
Calibration to total Microbial Load (SCML)
spike-in procedure and bacterial lysis DNA isolation, amplifi- cation and sequencing
1 2
3
4
5
6 7
8