The role of reassortment in the evolution of seasonal influenza
Inaugural-Dissertation zur
Erlangung des Doktorgrades
der Mathematisch-Naturwissenschaftlichen Fakult¨ at der Universitat zu K¨ oln
vorgelegt von
Mara Villa
aus Monza, Italien
K¨ oln, 2018
Berichterstatter: Prof. Dr. Michael L¨ assig Prof. Dr. Andreas Beyer
Tag der m¨ undlichen Pr¨ ufung: 19.07.2018
Kurzzusammenfassung
Reassortment ist der Austausch von Teilen des Erbgut zwischen Viren, die gleichzeitig eine Wirtszelle befallen. Es spielt eine wichtige Rolle in der Evolution von Viren mit segmen- tiertem Genom, wie zum Beispiel dem Influenza Virus. Die umfangreiche Durchmischung des Genoms kann zu einer h¨ oheren Diversit¨ at in Viruspopulationen und zur Entwicklung von pandemischen Virenst¨ ammen f¨ uhren. F¨ ur das humane Influenza Virus tritt Reassort- ment in den meisten F¨ allen zwischen koexistierenden Virusvarianten des gleichen Subtyps auf. Dieser Prozess unterbricht die Genkopplung und die Fitnesskorrelation zwischen ver- schiedenen viralen Genomsequenzen. Der resultierende Effekt auf die virale Fitness ist jedoch unklar.
In dieser Arbeit bestimmen wir zun¨ achst die Rate und den durchschnittlichen Se- lektionseffekt von Reassortmentprozessen des humanen Influenzasubtyps A/H3N2. Die Oberfl¨ achenproteine Hemmagglutinin und Neuraminidase haben Reassortmentvarianten mit einem mittleren Abstand von mindestens drei Nukleotiden im Vergleich zu ihrem Ausgangsstamm. Sie setzen sich mit einer Rate von ungef¨ ahr 10
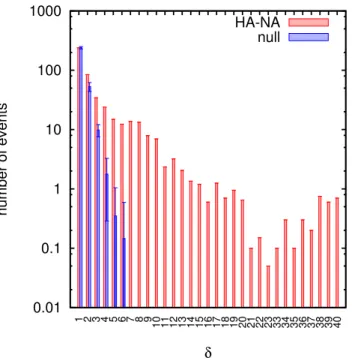
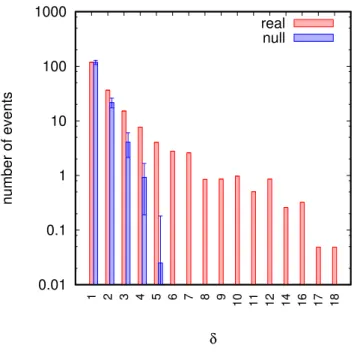
−2in Einheiten der neutralen Punktmutationsrate durch. Unsere Inferenz basiert auf einer neuen Methode, die Reassortmentereignisse aus gemeinsamen Genealogien mehrerer Genomsegmente ab- bildet und wurde durch umfangreiche Simulationen getestet. Wir zeigen, dass Reassort- ment innerhalb eines Subtyps im Durchschnitt unter betr¨ achtlicher negativer Selektion steht, deren St¨ arke mit dem genetischen Unterschied zum Ausgangsstamm zunimmt. Die nachteiligen Effekte von Reassortment zeigen sich auf zwei Arten: Erstens tritt Reassort- ment seltener auf, als man von der Nullhypothese neutralem Reassortments vorhergesagt.
Zweitens haben Reassortmentst¨ amme weniger Nachfahren als die entsprechenden St¨ amme ohne Reassortment. Unsere Ergebnisse deuten darauf hin, dass sich Influenza unter all- gegenw¨ artiger Epistase weiterentwickelt, was wiederum Fitnessbegrenzungen gegen Reas- sortment sogar innerhalb von einzelnen St¨ ammen eines Subtyps mit sich bringt.
Weiterhin untersuchen wir die Dynamik von Reassortment innerhalb eines aktuellen
iv
Influenza-Abstammungszeigs, welche wahrscheinlich die n¨ achste Epidemie dominieren wird.
Um die großen Datenmengen, die in den letzten Saisons gesammelt wurden, handhaben zu k¨ onnen, entwickeln wir eine heuristische Erkennungsmethode basierend auf Neuraminidase Alignment und Haemagglutinin Stammb¨ aumen. Dieser neue Ansatz ist schneller als fr¨ uhere Methoden und kann auf wesentliche gr¨ oßere B¨ aume angewendet werden. Wir beobachten vermehrt Reassortmentereignisse, was neben dem urspr¨ unglichen Stamm zu der Koexistenz von drei weiteren Neurminidasekladen f¨ uhrt. Die eingebauten Neuraminida- sesegmente unterscheiden sich von Varianten ohne Reassortment durch ver¨ anderte Amino- s¨ auren an epistatischen Genpositionen. Die Ergebnisse dieser Arbeit sind ein Schritt auf dem Weg, Evolution von Influenza auf Grundlage des kompletten Genoms vorherzusagen.
Die konsequente Verbesserung der Vorhersage zuk¨ unftiger Evolution ist der Schl¨ ussel zur
Entwicklung effektiver Impfstoffe.
Abstract
Reassortment, which is the exchange of genome sequence between viruses co-infecting a host cell, plays an important role in the evolution of segmented viruses, such as influenza.
The large-scale genome reshuffling promotes diversity in the viral population and can lead to the emergence of pandemic strains. In the human influenza virus, reassortment happens most frequently between co-existing variants within the same lineage. This process breaks genetic linkage and fitness correlations between viral genome segments, but the resulting net effect on viral fitness has remained unclear.
In this thesis, we first determine rate and average selective effect of reassortment pro- cesses in the human influenza lineage A/H3N2. For the surface proteins hemagglutinin and neuraminidase, reassortant variants with a mean distance of at least 3 nucleotides to their parent strains get established at a rate of about 10
−2in units of the neutral point muta- tion rate. Our inference is based on a new method to map reassortment events from joint genealogies of multiple genome segments, which is tested by extensive simulations. We show that intra-lineage reassortment processes are, on average, under substantial negative selection that increases in strength with increasing sequence distance between the parent strains. The deleterious effects of reassortment manifest themselves in two ways: there are fewer reassortment events than expected from a null model of neutral reassortment, and reassortant strains have fewer descendants than their non-reassortant counterparts. Our results suggest that influenza evolves under ubiquitous epistasis across proteins, which produces fitness barriers against reassortment even between co-circulating strains within one lineage.
Second, we study the dynamics of reassortment occurring within a recent influenza
clade which is likely to dominate the next epidemics. In order to handle the large amount
of data collected in the last seasons, we develop a new heuristic detection method based on
neuraminidase alignments and haemagglutinin phylogenies; this novel approach is faster
than the joint-segment tree based algorithm and can be applied to much larger trees. We
vi
find an increase in the frequency of reassorment events, which lead to the coexistence
in the viral population of three new neuraminidase clades, in addition to the ancestral
variant. These imported neuraminidase segments differ from the non-reassorted version
by aminoacid changes at epistatic sites. The results reported in this work are a step forward
towards predicting the evolution of influenza based on the entire genome. The consequent
improvement of accuracy in anticipating future evolution is the key for designing more
effective vaccines.
Acknowledgements
I would like to acknowledge Prof. Michael L¨ assig, for introducing me to the interesting
problem of influenza evolution and for spending some of his time supervising and guiding
my work over these years. Furthermore, I thank Simone Pompei, for his continuous support
and valuable comments on this project, and Marta Luksza, for sharing data and ideas,
which has opened a way to fruitful collaboration. I also want to thank all the people I have
met on my way to graduation, fellow PhD students, post-docs, professors and friends, who
made this journey more enjoyable. Last but not least, I owe many thanks to my family,
for supporting me throughout the last 30 years.
viii
Contents
1 Introduction 1
1.1 Thesis outline . . . . 1
1.2 Molecular evolution as a stochastic process . . . . 3
1.2.1 Diffusion evolutionary equations: a simple model . . . . 3
1.2.2 Clonal interference and recombination . . . . 5
1.3 Influenza virus: a model of adaptive evolution . . . . 7
1.3.1 Evolution by antigenic changes . . . . 7
1.3.2 The process of reassortment . . . . 9
1.4 From data analysis to forecasting evolution . . . . 10
1.4.1 Inference of phylogenetic trees . . . . 11
1.4.2 Predictive models for influenza evolution . . . . 12
2 Detection of reassortment: a novel genealogical method 17 2.1 Inference of reassortment: distance-based and phylogenetic methods . . . . 18
2.2 Inference of reassortment on two-segment trees . . . . 18
2.2.1 Alignments and genealogical trees . . . . 19
2.2.2 Primary inference of reassortment events . . . . 20
2.2.3 Pruning steps: uniqueness and false positives . . . . 23
2.3 Testing the inference method by simulations . . . . 24
2.4 Remarks . . . . 26
3 Reassortment in A/H3N2 human influenza 29 3.1 Rate and genealogy of reassortment for influenza A/H3N2 . . . . 29
3.2 Reassortment is under broad negative selection . . . . 34
3.2.1 Suppression of large distance reassortment . . . . 34
3.2.2 Fitness cost of reassortment and reduced tree growth . . . . 38
x CONTENTS
3.2.3 Epistasis across proteins . . . . 40
3.3 Discussion and remarks . . . . 41
4 Local heterogeneity in human influenza trees 43 4.1 Tree based measures of population dynamics and evolution . . . . 43
4.2 Cluster index and inference of reassortment . . . . 45
4.2.1 Algorithm in steps . . . . 45
4.2.2 Input parameters and preparatory steps . . . . 51
4.3 Preliminary results for a large set of A/H3N2 strains . . . . 59
4.3.1 Reassortment in recent A/H3N2 viruses . . . . 59
4.3.2 Discussion and remarks . . . . 60
Summary and conclusions 65
A Comprehensive list of reassortment events in influenza A/H3N2 67
Bibliography 75
List of Figures 87
1. Introduction
1.1 Thesis outline
The study of evolutionary processes is a classic topic in biology. Huge effort has been made to investigate and describe the mechanisms responsible for the diversity of life, setting the stage for an exciting change of point of view: can the goal of evolutionary biology in turn evolve from drawing a picture of the past into predicting future evolutionary patterns?
Although evolution is shaped by multiple stochastic forces, the growing amount of collected data and the continuous progresses in modeling complex dynamical systems have revealed that, for specific modes of evolution, the transition from description to prediction is no more an unattainable hope. In this context, fast evolving organisms as viruses and bacteria are of particular interest, as their evolution shows repeatable features.
Classical genetics has historically been focused on studying changes at the level of
point mutations. Nevertheless a comprehensive understanding of the evolutionary dy-
namics cannot overlook the emergence of events occurring at larger scales. Exchange and
variation of large portions of genetic material have been shown to be extremely relevant in
determining the evolutionary outcomes for several biological systems. For example copy-
number variation, namely duplication or deletion events affecting thousands of base pairs
at once, have been recognized as having an important role on cancer predisposition, can-
cer gene expression and tumor genome profiling [1]. Horizontal gene transfer in bacteria
and gene reassortment in viruses (see below) are further significant examples of processes
involving thousands of loci altogether. Taking into account the effects of these kind of
events can substantially improve our ability of forecasting evolution. The first stimulating
challenge for such purposes is the mapping of the dynamics of these processes, which was
found to be highly nontrivial. In this thesis we focus on evolution of the seasonal influenza
virus, a common pathogen that unceasingly evolves to adapt against host immunity. In
2 Introduction
particular we study how reassortment, namely the mixing of genes from different parent strains, affects and shapes the structure of the population of co-circulating viruses.
In this chapter we first briefly recall some fundamental concepts of population genet- ics, drawing the attention to the stochastic forces which drive genotype evolution. We highlight the complexity that arises when time-dependent selection is taken into account and we describe the emergence of competition between clones in the high mutational regime, typical of influenza, elucidating how evolutionary dynamics change as an effect of occasional gene reshuffling. We then introduce the biological system object of this study, seasonal influenza virus, and explain the important role of intra-subtype reassortment (es- pecially between the two surface glycoproteins haemagglutinin (HA) and neuraminidase (NA), main targets of antibodies recognition) in shaping viral evolution. We underline that a deeper understanding of the dynamics of this process has the potential to enhance the predictive power of methods currently used to forecast influenza evolution and select candidate vaccine strains.
In chapter 2 we present a novel, robust, method to infer intra-lineage reassortment based on the genealogy of the virus. We analyze the joint evolution of haemagglutinin and neuraminidase by reconstructing the respective two-segment genealogy and spot specific mutational patterns along tree branches, which signal disjoint evolution of the two proteins.
We interpret these “anomalies” on the tree as a result of gene reassortment and validate this assumption by comparison with a null case of non-reassorting segments, as well as by tests on simulated data. We show that a large fraction of the simulated reassortment events are recovered by our algorithm, and these events outweigh the rate of false positives.
In chapter 3 we apply our new detection method to a large dataset of seasonal influenza sequences and we obtain a list of reassortment events (Appendix A) that have produced new combinations of HA and NA genes, finding that the overall number of reassortments reported by our algorithm is in broad agreement with the results of previous studies [2–4].
We finally apply two independent and complementary selection inference methods to the list of detected events, identifying a consistent signal of broad negative selection on intra- lineage reassortment. We interpret this signal in terms of ubiquitous cross-protein epistasis and discuss evolutionary consequences.
In chapter 4 we propose our second method to infer reassortment, as an alternative
approach to the method described in chapter 2. Instead of analyzing the genealogy built
with paired HA-NA sequences in order to find inconsistencies in the pattern of mutations
on the tree branches, we use phylogenetic information from one segment only, together
1.2 Molecular evolution as a stochastic process 3
with the aligned sequences of the other segment. With heuristic approach, we spot on the one-segment tree the clades which are coupled with more than one variant in the other segment. We present some interesting preliminary results obtained by applying this new fast method to data collected in recent seasons, discussing how the dynamics of reassortment may have changed in the last few epidemics.
In the closing chapter we finally summarize and interpret our results. Parts of chapters 1, 2 and 3 and Appendix A have been published in reference [5].
1.2 Molecular evolution as a stochastic process
The change in the genomic content of populations is a stochastic process driven by time- dependent evolutionary forces: random mutations, selection, genetic drift and recombina- tion act on the individuals and determine the genetic composition of a population over time. Mutations arise randomly at the level of individuals and promote variation within a population by creating differences in the genotype alleles at rates µ. Natural selec- tion pushes the variants with high reproductive success towards achieving larger fractions in the population, while genetic drift models the stochastic effect of fluctuations in the reproduction process.
1.2.1 Diffusion evolutionary equations: a simple model
It is a helpful exercise to break down the evolutionary dynamics by considering separately the contribution that each of the above mentioned mechanisms gives on shaping the struc- ture of a population. We model a large set of N individuals, grouped, for the sake of notational simplicity, into two sub-populations with genotypes a and b. In absence of mutations and recombination, each genotype evolves with the simple growth law [6]
d
dt N
a\b(t) = F
a\b(t)N
a\b(t) , (1.1) with F
a\b(t) defined as the Malthusian fitness of the genotype a or b, respectively, and N (t) = N
a(t) + N
b(t). Rewriting equation (1.1) for frequencies x(t) = N
b(t)/N (t) one obtains
d
dt x(t) = ∆F
ab(t)x(t)[1 − x(t)] , (1.2)
with ∆F
ab(t) = F
b(t) − F
a(t). Assuming a constant fitness difference, the system evolves
in a deterministic way towards the fixed points x = 0 or x = 1, which represent fixation
of one genotype and loss of the other.
4 Introduction
Random sampling of individuals (genetic drift ) can be considered in the dynamics of the population by adding a Gaussian random variable X
a\b(t) to equation (1.1), with X
a\b(t) = 0 and X
a(t)X
b(t
0) = N
a(t)δ(t − t
0)δ
a,b. The projection of the stochastic growth law onto the population fraction x can be written ([6, 7]) in terms of a Kimura diffusion equation for the probability distribution P (x, t):
∂
∂t P(x, t) = 1 2N
∂
2∂x
2x(1 − x)P (x, t) − ∆F
ab∂
∂x x(1 − x)P(x, t) . (1.3) Although the monomorphic states x = 0 and x = 1 are still fixed points as in the purely deterministic case, fluctuations make the fixation probability of a genotype dependent not only on fitness differences, but also on the size and initial state of the population.
If transitions between genotypes are allowed through the introduction of mutations at rates µ
a→band µ
b→a, the correspondent Fokker-Planck equation reads [6]
∂
∂t P(x, t) = 1 2N
∂
2∂x
2x(1 − x)P (x, t) − ∆F
ab∂
∂x x(1 − x)P (x, t)
− µ
a→b∂
∂x (1 − x)P (x, t) + µ
b→a∂
∂x xP (x, t) .
(1.4)
Equation (1.4) is written under the assumption that only the systematic effects of random mutations are relevant for the evolution of the population probability, as their stochastic contribution is negligible if compared with the sampling noise X . In the low mutational regime (N µ << 1) and for constant fitness difference between genotypes the dynamics of the process described by equation (1.4) can be depicted as a series of switches (so called substitutions) between the unstable states x = 0 and x = 1. The substitution rates u
a→band u
b→athat define the time scale for a new genotype to establish in the population depend on mutation rates, fitness differences in the genotypes and (effective) population size. Equivalent equations can be written for allele frequencies, without loss of information, under the hypothesis of linkage equilibrium, namely if the alleles at different loci are inherited independently at each generation.
The evolutionary equilibrium reached in the approximation of constant selection (time-
and frequency-independent fitness differences) does not capture the ability of a popula-
tion to adapt within a changing environment. The emergence of phenotypic adaptation
is a general result of selection variation in space and time and it reflects a more realis-
tic representation of actual populations evolving in a changing background. There are
evidences from genomic data that selection itself can act as a random force, driving to
macro-evolutionary changes on large time scales, comparable with mutations time scales
1.2 Molecular evolution as a stochastic process 5
[8]. The development of simple models which include time-dependent selection with con- stant magnitude and random direction [9] has revealed that a surplus of advantageous over deleterious substitutions emerge as a consequence of long term fluctuations, in a regime where the latter are described as a quenched random process. Even though these studies are aimed to model and explain evolution at low mutation rate, the concept of parameteriz- ing selection as a fluctuating random force at individual sites has a general validity and has been successfully applied to reproduce adaptation of organisms in the regime µN >> 1, such as influenza virus [10]. Below (see chapter 2) we include random switches in selection coefficients as a fundamental element to simulate the evolution of human influenza. More general forms of Kimura-Otha evolution equation [11] valid for finite size populations with k possible genotypes are discussed in reference [12]. It can be shown that the existence of evolutionary equilibrium under selection and mutations is conditioned to the possibility of writing the total rates of frequency change given by selection and mutations in a gradient form. While equilibrium Boltzmann-like distributions can be calculated in the case of low mutation - or high recombination (see below) rate, genomic equilibria do not exist if the evolution of the genomic sites is generically coupled by fitness interactions (epistasis) and genetic linkage.
1.2.2 Clonal interference and recombination
Most biological systems evolve approximately in the low mutational regime, however the
evolution of some notable exceptions as mutator bacteria and viruses is fueled by high
mutation rates. In this regime, the picture of adaptation by “periodic selection” [13],
which implies beneficial mutations arising and fixing one by one, is replaced by a different
dynamics: simultaneous beneficial mutations may appear in the population and survive
against genetic drift. Without recombination, clones carrying alternative beneficial muta-
tions first outcompete the wild-type separately, then engage a head to head race to take
over and finally get fixed in the population. This scenario is known as clonal interference
(CI) [14] and it has been identified as a preponderant mechanism shaping adaptation under
genetic linkage in the evolution of a number of micro-organisms, including E. coli [15–18],
bacteriophages [19] and the influenza virus [10]. Beside inducing competition between
disjoint clones, which is associated to a slower rate of adaptation compared to periodic
selection, the high mutation rate maintains fitness variation within the population and
continuously produces new sequences. Beneficial mutations originating in nested clones
may then get to fixation at the same time, generating “positive” interference interactions
6 Introduction
[20–25].
The effects of clonal interference become less relevant in sexual reproduction, when the process of recombination reshuffles the genomes and promotes variability by creating novel genotypes at each generation as a mixture of parental alleles. Mathematically, recombination can be explicitly taken into account in the description of the evolution of time-dependent frequency distributions as an additive source to the deterministic changes occurring at time scales larger than a generation [12, 26]. If the rate of recombination is high and its effects turn out to be detectable on shorter time scales than selection, the evolution of different loci is no longer correlated and the genotype fitness can be described as an additive function of the single locus fitness. It has been shown [26, 27]
that the competition between selection and recombination on short time scales, when the contribution of mutations to diversification is negligible, produces different phases:
the quasi-linkage equilibrium (QLE) regime [28], corresponding to frequent recombination [29] and absence of coexisting clones, is disrupted by the buildup of sequence correlations (epistasis) with decreasing recombination rate. In this phase of “clonal condensation” [26]
some genotypes grow to significant frequencies despite recombination. The transition from allele selection to genotype selection as a result of the race between these two evolutionary forces is analogous to the freezing transition in the Random Energy Model of spin glasses [30, 31].
Sexual reproduction is not the only mechanism which feeds variability via reshuffling of alleles. Horizontal gene transfer (HGT), namely the exchange of genetic material between organisms as opposed to parental inheritance (also referred to as vertical gene transfer), plays an important role in bacterial adaptation, often conferring and spreading antibiotic resistance [32–34]. Also viruses with segmented genomes, such as influenza, can be subject to the mixing of genes from different strains during replication. The dynamics and effects of the so called process of reassortment in the evolution of human seasonal influenza is the main subject of this thesis.
In the next sections we briefly introduce the biology of influenza virus, describing the
structure of the pathogen and relating it to the mechanisms that drive its evolution, with
a particular stress on the process of reassortment. Influenza is a notable example of a fast-
evolving pathogen adapting in a time-dependent environment; the abundance of available
sequence-data makes it a significant model for studying evolution of organisms out of equi-
librium. A more comprehensive understanding of influenza evolution and the subsequent
step of quantitative modeling represent a potential breakthrough in the ultimate challenge
1.3 Influenza virus: a model of adaptive evolution 7
of making predictions.
1.3 Influenza virus: a model of adaptive evolution
Influenza virus is a negative-sense single strand RNA virus. The pathogen is spread and common in every continent and still has a remarkable impact on public health, considering that seasonal influenza causes about half a million deaths per year in humans [35]. In- fections are induced by three phylogenetically and antigenically distinct influenza lineages - A, B and C - that co-circulate globally. Among these lineages, influenza A shows the fastest rate of evolution [36–39], while type C viruses tend to cause less severe disease [40].
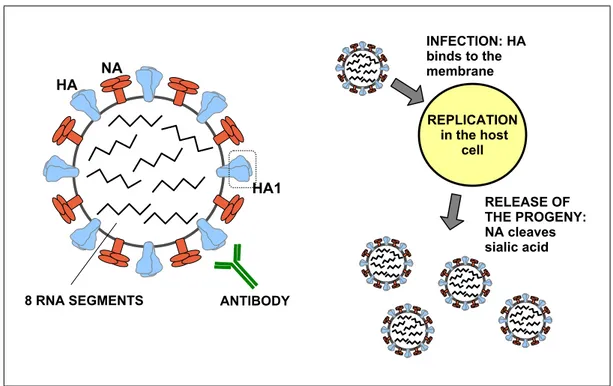
The genome of the virus is segmented into 8 RNA filaments that, by taking advantage of the replication/translation machinery of the host cell, encode 11 different proteins (Fig.
1.1). The filaments PB1, PB2 and PA encode the viral RNA polymerase (RdRP) and various polypeptides, likely responsible for inducing cell death [41] and for modulating viral pathogenicity [42]; NP encode the viral nucleoprotein, while M the matrix protein (M1) and a surface protein (M2); NS encodes both the nonstructural 1 (NS1) protein, involved in immune evasion, and the nuclear export protein (NS2), which mediates the nuclear export of viral ribonucleoprotein (complexes of RNA and RNA-binding proteins);
last, HA and NA encode the dominant surface glycoproteins, haemagglutinin and neu- raminidase, respectively. Antigenic epitopes, namely the primary loci of interaction with the human immune system, are mainly located in the globular head of HA (HA1 domain) [43]. Within the A lineage, the combination of these two proteins on the surface deter- mines a further classification of the virus into subtypes; most of the 18 HA and 11 NA subtypes affect avian species, while the predominant variants circulating among humans are A/H3N2, A/H2N2, A/H1N1, A/H1N2 [44, 45]. A/H1N1 and A/H3N2, in particular, cause seasonal influenza virus epidemics; the latter subtype is the focus of the analysis presented in this thesis.
1.3.1 Evolution by antigenic changes
Within each segment, genomic evolution is a purely asexual process carried by point
mutations, which are subject to genetic drift and natural selection. By the analysis of HA
sequences from viral isolates, it has been shown that the high mutation rate of influenza
is the fodder for the emergence of clonal interference [10]. A set of competing clones,
broadly defined as a group of genetically similar (often not identical) strains, appears in the
8 Introduction
ANTIBODY 8 RNA SEGMENTS
HA NA
HA1
REPLICATION in the host
cell INFECTION: HA binds to the membrane
RELEASE OF THE PROGENY:
NA cleaves sialic acid
Figure 1.1: The influenza virion. The viral particles (left panel) of influenza A, B and C share similar structures; the capsid is wrapped into the viral envelope, which packages and protects the central core containing the viral RNA genome. The influenza A and B virus genome is composed by 8 gene segments, encoding for 11 proteins (see main text). Haemagglutinin (HA) protein has a trimeric structure, each monomer being composed of two domains: HA1 and HA2. HA1 contains the receptor binding site (RBS) for cell attachment and is the primary target of anti-influenza antibodies. HA is responsible for cell attachment and entry (binding of sialic acid and membrane fusion), while neuraminidase (NA) cleaves the bonds between HA and sialic acid and facilitates viral movement through the mucus [46], enabling the release of new virions from the host cell after replication (right panel).
population; some clones survive, some get eventually extinct. The rapid fixation of strongly beneficial mutations (selective sweeps, typical sweep time
1being 3 - 4 years) responsible for the expansion of the successful clones has two “collateral” effects. Within sweeps, while neutral and moderately deleterious mutations often fix in the population by hitchhiking as a result of linkage, moderately beneficial changes originated in outcompeted clones are lost in the process. In this picture the viral population always remains multiclonal, as selective sweeps do reduce but not eliminate diversity. The deleterious mutation load emerging with clonal interference limits both the speed (measured by the mean fitness flux, see [12]) and the degree of adaptation [10], the latter characterizing the functionality of a gene segment. Furthermore, it has been shown that accumulation of deleterious
1
Typical coalescent time.
1.3 Influenza virus: a model of adaptive evolution 9
mutations can explain the pattern of rising and spreading of new antigenic clusters
2[48].
Positive selective pressure by host immunity plays an important role, in particular, in the evolution of haemagglutinin (HA), which governs viral binding and entry into host cells, and neuraminidase (NA), which drives the release and escape of new virions from the cell [49, 50], thus promoting the infection of other cells. The gradual accumulation of adaptive mutations in these two proteins maintains the ability of the virus to continually evade host immunity [39, 51]; this phenotypic process has been called antigenic drift
3[47, 52].
1.3.2 The process of reassortment
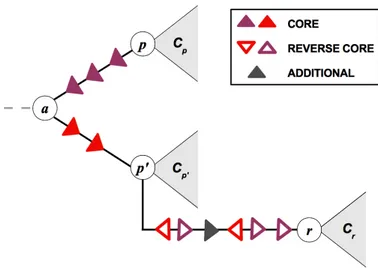
In parallel to point mutations within single proteins, the genome of the influenza virus changes by so-called reassortment processes. If the same host cell is co-infected by two or more viruses carrying distinct genomes, mixing of genomic segments within that cell may produce a hybrid genotype carrying segments from different parental strains. Fig.
1.2 shows a schematic representation of the mechanism. The evolutionary implications of
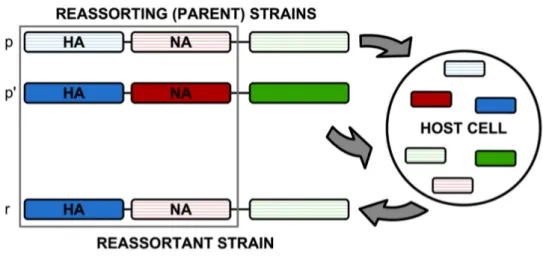
Figure 1.2: Schematic of a reassortment process. Two parent strains, p and p
0, co-infect a host cell and produce a reassortant strain r. Here we focus on reassortment of the two surface proteins HA (blue segments) and NA (red segments); the reassortant strain r inherits one of these segments from each parent.
these dynamics are quite complex. On the one hand, in rare cases, reassortment can lead to antigenic shifts, which are new combinations of haemagglutinin and neuraminidase that strongly enhance fitness [53] by escape from host immunity [54, 55]. Cross-species
2
Sets of viral strains antigenically similar one to another [47].
3
Not to be mistaken with genetic drift.
10 Introduction
infections are possible and new lineages deriving from the mixing of strains infecting different classes of living beings are often the main cause of so called pandemics, worldwide spread epidemics with high mortality rates among the infected population. The acquisition of new HA and NA variants by human influenza A through reassortment with avian strains, for example, has been shown to cause global pandemics in 1957 and 1968, known as the
“asian” and the “Hong Kong” flu, respectively [56, 57]. Many reassortments, however, have negligible antigenic effects but may have other fitness effects. Specifically, fitness interactions between segments across lineages are observed as biases in observed pairings [58–64]. By partly randomizing such pairings, reassortment generates a fitness cost and a resulting increase of subsequent compensatory mutations [65]. In terms of statistical physics language, co-evolution results in a strongly correlated many-particle process driven by epistatic effects between proteins, while reassortment, on the other hand, acts as a randomizing factor that breaks down the correlation pattern. Broad negative selection has been postulated for reassortment between well distinct influenza B lineages [66], but the overall selective effects of intra-subtype ressortment have not been systematically analyzed so far. In this thesis we give our contribution to a better understanding of these dynamics by showing that reassortment within a given influenza lineage induces a fitness cost that increases in strength with increasing genetic distance of the parent viruses. Our finding suggests that evolution continuously produces viral proteins whose fitness depends on each other; reassortment reduces fitness by breaking up successful combinations of proteins.
Thus, selection across proteins constrains viral evolution within a given lineage, and it may be an important factor in defining a viral species.
1.4 From data analysis to forecasting evolution
The continuous alteration of the antigenic phenotype of influenza virus allows reinfection
of previously exposed individuals and makes frequent update of vaccines a necessary pro-
cedure. Decisions on the composition of these vaccines need to be taken nearly one year
in advance and rely on early identification of novel emergent variants [67, 68]. As a first
step towards an efficient surveillance and vaccine strains selection process, huge efforts are
being made to collect high-quality worldwide data. As a result, large datasets of complete
genome sequences of viral strains are available, making influenza one of the best docu-
mented systems of molecular evolution. The HA gene sequence, in particular, is available
for several thousands strains isolated over the last 40 years [69] and has therefore been
1.4 From data analysis to forecasting evolution 11
the main target of a remarkable number of studies to investigate its primary role in the interaction with the host antibodies. Bioinformatic tools for processing raw data, such as multiple sequence alignment methods (see for example MUSCLE [70] or BLAST [71] for popular implementations of such methods), are normally used to prepare alignments
4of RNA sequences and infer their evolutionary relationships through the reconstruction of phylogenies.
1.4.1 Inference of phylogenetic trees
It is beyond the scope of this thesis to present a detailed review on the methods currently used to build phylogenetic trees (see reference [72] for such a purpose), however we briefly mention the most common ones, since the inference of genealogies will be a relevant step in our analysis (chapter 2).
Distance based methods start from the reconstruction of the distance matrix of ob- served (pairwise) distances between the sequences in the alignment. Sequences close in the distance space are placed in the same “neighborhood” of the tree, as descending from a recent internal common ancestor. Algorithms based on this approach have the advan- tage of being extremely fast, thus become relevant in the analysis of very large datasets.
Despite that, trees built with such methods may not be the “best” trees to describe the actual evolution of the data. The step of summarizing a set of sequences with a distance matrix implies loss of information and only gives an overall estimate of the relationship between trees and data.
Maximum Parsimony (MP) methods are based explicitly on the sequences, in contrast to pairwise distances, and aim at reconstructing the tree that explains the evolution of each site under the constraint of minimizing the number of evolutionary changes. Although parsimony relies on few reasonable and simple evolutionary assumptions, namely that evolutionary changes are rare, they tend to lose accuracy in the reconstruction of portions of trees in proximity of long branches [73]. Moreover, the search for the most parsimonious tree in the space of all possible trees generated by the data is generally a time-costly computational procedure.
4
Aligning gene sequences is in general a complex problem. Lots of methods have been developed to
efficiently establish homology among nucleotide positions and the choice of one approach over the other
depends on the specific set of data. Producing reliable alignments of RNA sequences of influenza A single
segments is however a relative simple operation, thanks both to the high quality of data and general
absence of gaps eventually due to insertion and deletion events.
12 Introduction
The latter disadvantage affects also Maximum Likelihood (ML) algorithms. Instead of preferring the tree with the fewest possible evolutionary changes, ML searches for the phylogeny that maximizes the likelihood of getting the aligned sequences under a model of sequence evolution, which evaluates the probability of particular mutations. In broad terms, low probability is assigned to trees that require more mutations at internal nodes to explain the observed phylogeny. The most parsimonious tree is also the maximum likelihood tree when the expected amount of evolutionary change is very small, which is not the case of influenza evolution. For our analysis we build the genealogies of single and paired gene sequences (chapter 2) using a ML method under a General Time Reversible (GTR) model of nucleotide substitution that incorporates rate heterogeneity among sites.
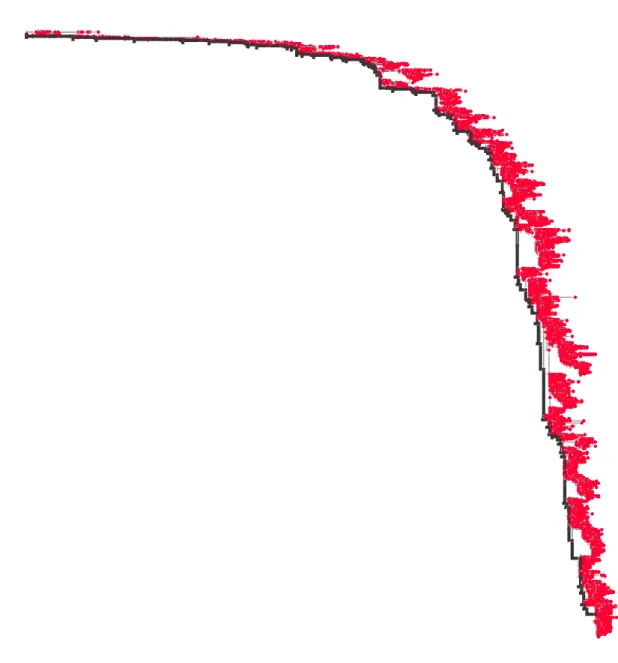
5To obtain the larger trees analyzed in chapter 4, the ML inference is preceded by an additional step: in order to reduce the total inference time, a preliminary topology is reconstructed with a fast distance-based method (implemented in FastTree software [75]) and used to restrict the tree space for the following ML runs. Fig. 1.3 shows the ML phylogeny of A/H3N2 haemagglutinin (data from 1968 to 2015, as in chapter 2). The shape of the tree reflects the modes of evolution of the influenza virus. High supply of beneficial mutations creates competition between clones; fixation events occur on the trunk (black thick line in the figure), while the outcompeted clades - defined as sets of strains descending from recent last common ancestors - get extinct, resulting in a strongly unbalanced monophyletic tree (see Fig. 2.2 for a comparison with a ML tree built with paired HA-NA sequences and reference [10] for HA trees reconstructed with maximum parsimony principle).
1.4.2 Predictive models for influenza evolution
The genomic information coded into dense sequence alignments and respective phyloge- netic trees is the base for the development of predictive models. Despite the complex and stochastic nature of the evolutionary processes at molecular scales, the specific mode of asexual evolution driven by large supply of mutations and strong selection leads to the emergence of repeatable features. Adaptation to host immunity is carried on by strongly beneficial mutations occurring in a limited amount of epitope sites; selection shrinks the space of evolutionary possibilities, thus opening the way to predictability [25]. In this pic- ture, the massive increase of available sequence data, paired with phenotypic (antigenic)
5
GTRCAT model implemented in RAxML software [74].
1.4 From data analysis to forecasting evolution 13
10.0
Figure 1.3: Phylogenetic tree of A/H3N2 human influenza. The evolutionary tree of the seasonal influenza virus built with haemagglutinin gene is highly asymmetric. Nodes in the tree (red dots) represent distinct HA sequences; terminal nodes, in particular, are observed strains. Distances in the horizontal axes should be read in terms of number of mutations between sequences, which represent an indirect measure of time. Selective sweeps occurring every few years drive fixation of successful clones, originating on the trunk (black thick line), and extinction of outcompeted variants. These evolutionary dynamics shape the growth of the phylogeny along one main lineage, thus determining the monophyletic aspect of the tree.
characterization of the isolates (typically obtained by haemagglutinin inhibition assays
6)
6
Haemagglutinin inhibition assays (HI) measure the maximum dilution at which antibody-containing
serum prevents a particular influenza virus from agglutinating red blood cells [76].
14 Introduction
are the ground on which predictive models are built (see reference [68] for a recent review).
The genetic history of viral clades can be tracked on the inferred trees and their frequency changes modeled by assessing fitness differences between sub-populations.
The prediction of clade success requires the establishment of a link between fitness distances and genetic data. Fitness landscapes (or time-dependent seascapes [12]) can be modeled explicitly, as in [77], however some predictive models adopt different approaches [78, 79]. The analysis of phylogenetic trees has been used, for example, as a base to develop a method for inferring directional selection on specific alleles (only nonsynonymous mutations in the epitope sites in haemagglutinin) [79, 80] and extrapolate recent growth of relevant HA clades. The mapping of HI data on the phylogeny identifies high-growth clades with relevant antigenic impact, setting a criterion for the proposal of new vaccine strains components. Although incorporating both genetic and antigenic data is potentially a successful strategy, predictions based on this method do not take into account fitness effects outside epitope mutations.
The idea that phylogenetic trees on their own contain enough information to infer
fitness has brought to the development of a more general model, that does not require
detailed molecular information [78]. With the assumption that the population is under
persistent directional selection, fitness changes along the lineages occur gradually as a
result of the continuous accumulation of small effect mutations. The fitness of most
clades, then, decreases over time under the effect of weakly deleterious mutations, while
few lineages adapt and remain among the fittest in the population. The fitness distribution
along the tree is obtained by the observations that rapid branching is expected under fit
internal nodes, and children with high fitness are likely to be recent descendants of high
fitness parents. Furthermore, the ranking of nodes by fitness is only mildly dependent on
the parameters required to model the posterior fitness distribution, indicating that the
latter can be related to more universal quantities. In detail, high fitness internal nodes
are associated to high downstream total branch length, namely, for a given number of
descendants, these nodes originate star-like subtrees. At the same time, a lineage with
low downstream branching is likely to have low fitness. It is therefore possible to define
a heuristic measure that estimates clades growth rates relying exclusively on the local
shape of the phylogeny. The so called “local branching index” λ
i(τ ) (LBI) is defined as
the total length of the tree surrounding node i, averaged with an exponential decreasing
weight τ , and ranks the nodes with an accuracy comparable to ranking by calculating
fitness distributions. In chapter 4 we adopt the idea of ranking nodes on the phylogeny
1.4 From data analysis to forecasting evolution 15
by heuristic algorithms and apply it for a different purpose. Instead of inferring fitness, we define a parameter to spot subtrees where reassortment is likely to be occurred.
A parallel approach to the ones described above is the explicit modeling of fitness functions, which serves to predict the evolution of genetic clades from one year to the other [77]. At a given point in time (season) t, the frequency X
α(t) of clade α is defined as the sum of the frequencies x
iof all the strains i part of that clade: X
α(t) = P
i:α,t
x
i. The expected frequency in the next season is given by ˆ X
α(t + 1) = P
i:α,t
x
iexp(f
i). The (Malthusian) fitness f
iof each strain i is modeled as a sum of contributions from mutations in epitope and non-epitope sites. Non-epitope mutations, often causing protein destabi- lization, are assigned a fitness cost L to model predominant negative selection.
7Epitope mutations are predominantly under positive selection and are included with a term that describes cross-immunity C across multiple strains. The fitness of each strain depends on gene sequences a and takes the form
f
i= f
0− L(a
i) − X
j:tj<ti
x
jC(a
i, a
j) , (1.5)
with constant f
0ensuring normalization of strain frequencies. Here, the non-epitope load and the cross-immunity terms are approximated using Hamming distances between genetic sequences. This minimal genetic fitness model can predict the expected cross-immunity between a given strain and the circulating strains in a certain season, thus predicting the optimal vaccine strain as the one maximizing cross-immunity. Antigenic data can be included explicitly in the fitness functions and used to predict more accurately the dominating clades of the upcoming season.
Each of the predictive models described so far relies on different assumptions and explore biological details at different levels. However, they are all based on information codified in haemagglutinin protein alone. This first order approximation is justified by the primary role that HA has in the interaction with the host immune system, which made this protein the target of a remarkable number of studies. It is reasonable to assume that models built on HA alone cannot be exhaustive, since adaptive sites are actually present in other proteins [81], especially in the already cited neuraminidase. Including NA sequences into the analysis is then a crucial step in order to achieve the final goal of building a thorough fitness model for influenza that can really be predictive. Taking into
7
Non-epitope changes that are approximately neutral, have compensatory fitness effects or contribute
to the adaptive process are neglected.
16 Introduction
account both HA and NA entails the knowledge of how the two proteins co-evolve; it is
of particular interest quantifying inter-proteins linkage effects, direct result of functional
coupling of antigenic changes in HA and NA [82], and quantitatively elucidating the fitness
effect of reassortment (section 3.2.3). How frequent is reassortment involving these two
glycoproteins among seasonal A/H3N2 influenza? Are reassortant variants fitter than non-
reassortant counterparts? Can we learn from the statistics of reassortment whether the
virus evolves under the constraints of fitness interactions across proteins? Giving an answer
to these interesting questions means being able to draw the sketch of the implications of
including reassortment dynamics in the construction of multi-protein fitness models and
constitutes the main goal of this thesis.
2. Detection of reassortment: a novel genealogical method
In the previous chapter we have highlighted the importance of reassortment in shaping the evolutionary dynamics of influenza, emphasizing the existence of crucial open questions regarding selection effects. A necessary methodological basis for answering these ques- tions is the faithful inference of intra-subtype reassortment events from sequence data.
Although these dynamics have long been recognized as a potentially important mecha- nism for evolution [83, 84], the detection of events within the same subtype is notoriously difficult due to their weak phylogenetic signal. There is a number of current methods to infer reassortment events from a data set of viral sequences. These methods can be roughly divided into two groups: distance-based methods [85, 86] and methods based on the phylogeny [55,83,87–93]. As recently pointed out [94], these approaches coherently re- port some fraction of the reassortment events but show a substantial degree of discrepancy between their results, which can be traced to method-specific differences in sensitivity.
In this chapter, we first comment upon the methods commonly used to detect reas-
sortment and draw the attention to the need of developing a new approach which fits the
purpose of intra-subtype reassortment inference. We therefore present our novel detection
method, designed and optimized for this scope, and describe the algorithm in detail. Par-
ticular care will be devoted to the validation of the approach through comparison with a
non-reassortant case and tests on simulated data.
18 Detection of reassortment: a novel genealogical method
2.1 Inference of reassortment: distance-based and phyloge- netic methods
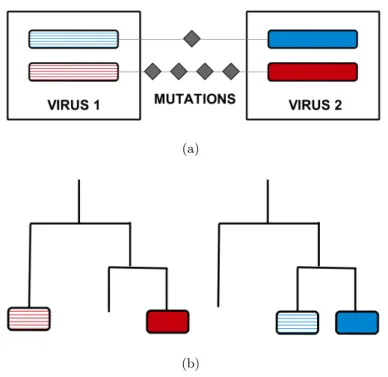
Distance-based methods rely on the assumption that, for reassortant strains, high simi- larity between the sequences of one segment goes along with large differences in the other segment (Fig. 2.1(a)). These methods do not pass through the step of inferring the phy- logeny of the virus. They are fast, can be efficiently applied to large alignments, and are insensitive to errors in tree reconstruction. Without a viral phylogeny, however, it can be hard to determine if two or more inferred events are independent. Hence, distance-based methods can generate multiple representations of the same original event between unob- served ancestral strains. Resolving false positives constitutes a major issue for this kind of algorithms.
Phylogenetic methods, on the other hand, are based on the observation that reassortant strains are located in different clades of the coalescent trees built for different segments (Fig. 2.1(b)). These approaches are usually successful in detecting reassortment across different lineages of the virus, i.e. between strains with substantial genetic differences.
The incompatibility between tree topologies, however, can also be a result of phylogenetic errors, so that inconsistencies in the evolutionary histories of different segments are a necessary but not sufficient condition for reassortment. Successful attempts to overcome this issue [91] have produced algorithms which are applicable only to small datasets. Since the scaling of the number of inferred events with sample sizes has not been investigated, it is not clear if the rate of reassortment is independent on the size of the trees. Hence, even if the gain in information coming from the phylogenetic trees constitutes an advantage over the distance-based algorithms, the limited resolution constrains these methods in the detection of intra-lineage events [51].
2.2 Inference of reassortment on two-segment trees
In order to fill this methodological gap, in the following sections we propose a new ge-
nealogical inference method for reassortment in fast-evolving populations with segmented
genomes, such as influenza virus. We analyze the mutations arising in joint genealogies
built from pairs of segments and set a simple criterion to identify reassortment events.
2.2 Inference of reassortment on two-segment trees 19
(a)
(b)
Figure 2.1: Current methods for inferring reassortment. (a) Distance based methods detect inconsistencies in distances between segments. Small deviations in one segment (blue) correspond to large deviations in the other one (red): the two proteins have different evolutionary history and their mixing is a product of reassortment. (b) Phylogenetic methods spot alignment mismatches between trees of different segments. The two subtrees refer to evolution in distinct segments (red, blue). Two viruses in the same clade relatively to the blue segment fall into separate subtrees in the red segment, indicating that reassortment brought a new variant which differs from the background.
2.2.1 Alignments and genealogical trees
In this study, we focus on reassortment between the haemagglutinin and neuraminidase influenza genes, because the evolution of both proteins has been linked to immune escape and functional epistasis between them affects vaccine efficacy [95–97]. Hence, we restrict the genomic analysis to the two segments carrying the HA and NA genes; each parent strain contributes exactly one of these segments to the reassortant strain (see Fig. 1.2). For our purpose, a sample of HA and NA sequences is obtained by downloading all the available A/H3N2 human strains in the EpiFlu DATABASE (http://www.gisaid.org), regardless the geographical region, which were collected between January 1968 and October 2015.
Only the strains with complete HA and NA sequences are taken into consideration. From
this sample, alignments of single segments are created year by year using BLAST [71].
20 Detection of reassortment: a novel genealogical method
After discarding the segments with more than three gaps,
1a first run of RAxML [74] is performed to reconstruct the genealogy for each segment and detect clear outliers sequences (i.e. sequences that are found clearly isolated from the rest of the tree and which were likely misreported) to be excluded from the subsequent analysis. We then obtain alignments of linked HA-NA segment pairs and construct maximum-likelihood two-segment genealogies by RAxML, choosing the best-scoring ML tree out of 10 RAxML runs. Fig. 2.2 shows one HA-NA joint tree obtained by applying this routine. The Potential ambiguities in the definition of the nucleotide at a certain site in a strain are resolved by assigning the orthologous nucleotide of the closest ancestral node with an unambiguous sequence.
The subsequent reassortment inference is performed on trees of subsampled data with a maximum of 600 sequences per year. This step reduces computational time and avoids over-representation of recent viruses, which are the most abundant in the database. We note that these joint genealogies differ from single-segment phylogenetic trees, because the underlying process of reassortment violates the tree topology.
Some of the isolates we use in this study were subject to passaging in cell culture before sequencing. This preliminary step amplifies the viral copy number, helping to test the features of the pathogen into a living system. It has been shown that through passaging influenza sequences can accumulate adaptive mutations [98], which constitutes a possible confounding factor in the evolutionary analysis of the virus. To exclude this eventuality, we repeat our inference of reassortment on 20 trees built from a restricted alignment of 1053 unpassaged sequences.
2.2.2 Primary inference of reassortment events
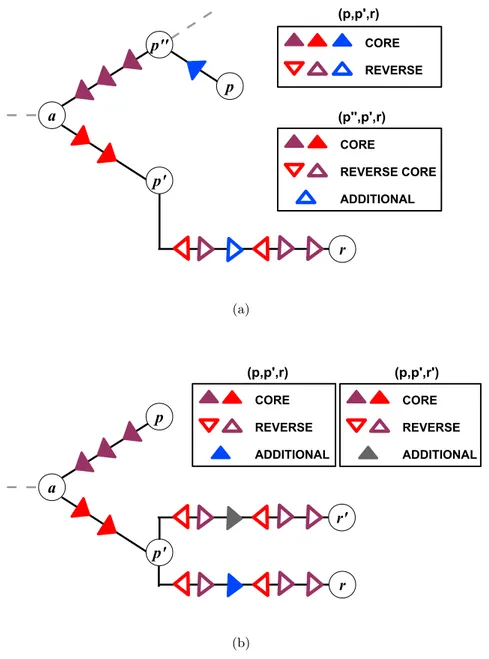
A tree representation of a joint genealogy with a reassortment process is shown in Fig. 2.3.
The two parental strains p and p
0appear in different sublineages, and the reassortant strain r is shown as a descendant of one of these parents (here p
0). These strains define three distinct clades of descendant strains, C
p, C
p0, and C
r(grey areas in Fig. 2.3); the numbers of strains in these clades are denoted by n
p, n
p0, and n
r, respectively. We note that the
“direction” of the reassortment event (here from p to p
0) is merely a property of the tree representation, and there is an equivalent tree with the roles of p and p
0exchanged. This reassortment pattern can be readily identified in two-segment trees. Fig. 3.4 shows an
1
This choice may appear restrictive, however it is necessary in order to guarantee the reliability of
the detected events, which constitutes an essential condition to avoid uncontrollably confounding factors
possibly altering the following analysis concerning selection (see chapter 3).
2.2 Inference of reassortment on two-segment trees 21
0.01