Research Collection
Other Conference Item
A novel quality indicator for displaying and comparing the missingness of the PPG derived respiratory rate
Author(s):
Zhang, Jia; Karlen, Walter Publication Date:
2021-01
Permanent Link:
https://doi.org/10.3929/ethz-b-000458643
Rights / License:
In Copyright - Non-Commercial Use Permitted
This page was generated automatically upon download from the ETH Zurich Research Collection. For more information please consult the Terms of use.
ETH Library
A NOVEL QUALITY INDICATOR FOR DISPLAYING AND COMPARING THE MISSINGNESS OF THE PPG DERIVED RESPIRATORY RATE
J. Zhang, MSc and W. Karlen, PhD, Mobile Health Systems Lab, Institute of Robotics and Intelligent Systems, Department of Health Sciences and Technology, ETH Zurich, Switzerland Introduction: Respiratory rate (RR) is an important vital sign to assess the medical condition of a patient. RR can be estimated from the photoplethysmogram (PPG), which is increasingly available on wearable devices. Abnormal event detection relies on continuous RR measurements that are robust, i.e.
of high accuracy and with low missing data points. Data gaps might lead to missed signs of abnormal events and cause failure in recognizing patient deterioration (1) . Therefore, it is crucial to retain as much continuous information as possible. When RR is assessed in real-time, it is important to, in addition to the estimated RR value, capture the robustness information. We present a novel method to provide the information of missingness (missingness index) as a quality indicator of the obtained RR extracted from PPG signal. We tested our approach on the benchmark CapnoBase dataset (2) and compared the result between fusing using different RR induced variations (3,4).
Methods: We adopted the pre-processing steps from (3) that included filtering, pulse segmentation and artifact detection. Respiratory induced multiple modulations on PPG waveform, such as the respiratory- induced intensity, amplitude, frequency, width (5) and slope transit time variation (6), were extracted.
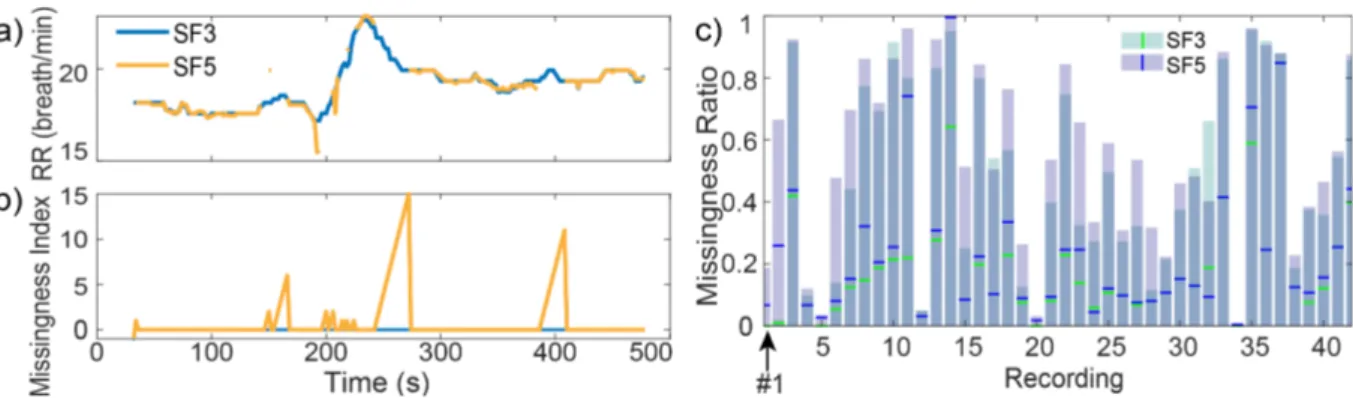
Each RR estimate was computed using FFT to find the maximum frequency component within the RR band. We computed the RR from the three original benchmark estimates (SF3), and all 5 of the above mentioned five estimates (SF5). The particularity of this fusion is that RR estimations with high disagreement are excluded from the result which could lead to severe missingness. Therefore, we calculated the number of previous cumulated consecutive missing RR estimation windows for each time window and defined it as the missingness index. At the beginning of each recording it is initialized with a -1 value. We compared the fusion algorithms with the CapnoBase TBME RR benchmark dataset, which contained 42 8-minute PPG recordings from 29 pediatric and 13 adult subjects undergoing elective surgery with either spontaneous or controlled ventilation. We evaluated the absolute missingness index for the recording, the overall missingness by computing the ratio of the number of RR windows that were not available to the total possible number of RR windows, and the missingness ratio for the longest missing for each recording.
Results: The missingness of the obtained RR (Fig. 1a) was adequately represented by the missingness index (Fig. 1b). The overall missing ratio in SF5 was higher except in 3 recordings (Fig. 1c).
Conclusion: We obtained a novel method to display the missingness of RR estimated from the PPG that adequately quantified the data gaps and enabled the objective comparison between RR estimation methods.
References: 1. Mok WQ, et al. Int J Nurs Pract. 2015;21(S2):91–8. 2. Karlen W, et al. in Annu Meet STA. 2010;48:25. 3. Karlen W, et al. IEEE Trans Biomed Eng. 2013;60(7):1946–53. 4. Zhang J, et al.
Annu Meet EMBC. 2020;5939-42. 5. Lázaro J, et al. Med Biol Eng Comput. 2013;51(1–2):233–42. 6.
Addison PS. IEEE Trans Biomed Eng. 2016;63(11):2441–4.
Figure 1: a) RR for the SF3 and SF5 for recording #1, and b) the corresponding missingness index. c) The missingness ratio per recording for SF3 and SF5 on the entire CapnoBase. The horizontal bar indicates the missingness ratio of the longest missing segment within each recording.