Institut f¨ur Experimentelle Kernphysik (EKP) Prof. Dr. M. Feindt, Dr. M. Kreps, Dr. T. Kuhr C. Hackstein, D. Zander, Dr. A. Zupanc
19. November 2009
Computerpraktikum zur Vorlesung Teilchenphysik f¨ ur Fortgeschrittene MadGraph / MadEvent
MadEvent is a program suit to calculate cross sections and generate parton level events in high energy physics. It has evolved a lot over the past years and includes a lot of additional features, way beyond this lecture, but it is all centered around one core, the MadGraph package.
MadGraph is a tool that starts with a set of particles and their interactions and finds all the Feynman graphs contributing to a given initial and final state configuration. The contributing particles and their interactions are given by the Lagrangian of the theory and are used in MadGraph as a ”model”. A model is just a special way of writing up the various possible particles and their couplings. From this, MadGraph starts for a given initial state configuration (e.g. incoming electrons, quarks, gluons, photons, protons) and adds possible couplings and particles until the desired final state is reached. In this way, all possible Feynman graphs are constructed and stored.
From the generated graphs MadGraph now produces a fortran code that can actually be used to calculate the corresponding cross sections. This is done in a rather clever way, by means of helicity amplitudes, the HELAS formalism. Here all the lines in the Feynman dia- grams are identified with either helicity amplitudes or currents and plugged together. That way, the spin of the particles is already taken care of in the calculation. These amplitudes are the matrix elements for the process considered, so MadGraph does the complete quan- tum field theoretical calculation for you. Note however, this works only for leading order, so-called tree level diagrams, loops are not possible (yet - this is a topic of active research and is expected to be possible in the next one or two years).
MadEvent now takes these matrix elements and calculates the cross section. For this, the vegas package, a phase space generator, is used, which does, as the name suggests, the phase space integral calculation. This is done using Monte Carlo integration, since this integration is not solvable analytically for almost all the processes considered. Hence all of these programs have to rely on Monte Carlo integration, thus they are called Monte Carlo event generators.
Now this output from MadEvent can be used to get the cross section for the process of interest, you can apply different cuts, that is restrictions on the kinematics of the outgoing particles, or energies of the incoming particles and see how the cross section changes and so on. Additionally, you can write out a bunch of events, that is a list of the incoming and outgoing particles for different phase space configurations. These you can analyze further by looking at special observables or even put into a full event generator likePythia, Herwig++
orSherpa, where the rest of a high energy reaction is simulated.
Now lets put that all in practice!
1 Generation
To get anything done, we first have to run MadGraph and get the Feynman graphs and amplitude for our process. There are in principle two possible ways to use MadGraph for this. The classical way is to use it on your local computer1. In MadEvent, everything is already prepared as a template. Copy it to your home directory
cp -r /opt/MG_ME_V4.4.26/Template/ myprocess/
wheremyprocess/ is located in your home directory and should be named after the process you want to generate to avoid confusion. It is recommended that you start with a fresh folder for every different process you want to generate. In this folder, you will now find a bunch of folders.
• bin: here the scripts used to run the programs can be found.
• Cards: here the input files are stored which can be used to change the run parameters
• Events: when you create events, they will be stored here
• HTML: a HTML file is created with the info about your process and status of your running calculation
• lib: Libraries which are linked
• Source: the fortran code for the different programs
• SubProcesses: the code for the generated helicity amplitudes
1For this excercise, we installed MadGraph already centrally so the setup is slightly different from the normal usecase.
You only should change anything in these folders if you know what you do (i.e. if instructed to do so).
To set up a new process, edit the process card, Cards/proc card.dat and run the script bin/newprocess. This will set the amplitudes and phase space integration up, so afterwards you have a program for your process.
In addition to the local generation, you can run MadGraph on a cluster provided by the MadGraph authors. The web interface can be found at
http://madgraph.hep.uiuc.edu/
In order to do calculations there, you must register. If you click on ”Generate Process”, you find the link with the registration code. Register and log in to use the web interface.
This interface generates you a ready tarball that looks exactly like themyprocess/directory including the code for the helicity amplitudes. The syntax to specify the desired process is the same for the web interface.
The web interface is the recommended way to set up a new process, for this exercise you can use either.
Note: on the virtual machine, the setup of a new process seems to require a lot of ram, at least around 1 GB. This could be a problem, since you should not use more than 50% and must not use more than 75% of the ram on your host system. In that case the web interface should be preferred.
2 Setting up a new process
To start, we want to calculate some easy processes. To set up the desired process, edit the corresponding card. In the proc card.dat you find a box with a header containing instructions. Below that between thePROCESS tags the actual process is defined.
Quarks are denoted by their first letter: u, d, c, s, t, b , charged leptons by their first two (if any) and sign: e-, mu-, ta-, the corresponding neutrinos by ve, vm, vt.
Bosons go by their first letterg, z, w-, hexcept for the photon, which has a. If a particle carries a full elementary charge, it has a minus sign, the corresponding antiparticle carries a plus sign. All other antiparticles just get a tilde∼ after their name.
A process is specified by entering the initial state particles (this should be two, since we are doing collider physics) and the final state particles, separated by a>.
So for Bhabha scattering, you would enter e+ e- > e+ e-
QED=2 end_coup
The lines after a declaration are used to specify the couplings to be used for process gen- eration, i.e. how many vertices of which kind you want. It can help to set this to a low value since then MadGraph will not try so many processes. It is important to always end the process declaration with the tagend coup.
In case you generate an internal resonance, you can specify its decay in the same way, in the case of several resonances you can specify separate decays by using brackets.
e+ e- > Z > mu+ mu-
pp > (w+ > jj) (w- > l- vl)
In the second line we used the three templates available in MadGraph. If you want to collide protons, these of course do not enter in the Feynman diagrams, only their constituent partons do. So you can specify what partons you want to include into the proton and MadGraph will create all the possible contributions automatically. The same holds for jets, due to confinement in QCD you cannot observe a free quark or gluon, only a bunch of hadrons, stemming from the outgoing parton. So you can specify a jet composition and MadGraph will do the same as in the proton case. In addition you can specify a lepton and lepton- neutrino if you want to sum over all (or only a selection of) leptons. These specifications can be found at the bottom of the card, between the MULTIPARTICLES tags.
The momentum of the incoming partons depends on the momentum of the colliding protons. It can be obtained from so-called parton density functions, p.d.f.s, which are con- voluted with the cross section. This is already done in MadGraph with a default p.d.f. set (CTEQ 6.11). In principle it is possible (and advisable for an analysis) to use different sets.
For this, there is the possibility to use the LHAPDF library which contains most of the available p.d.f. sets.
Note that in the process card that comes with the Template directory, there are already three processes included. If you want, you can specify several processes at once to be created.
If you want to compare them however, this is not always advisable, since you will always get only one event file so it is hard to test possible cuts to separate a signal from backgrounds.
3 Calculate a standard model process
• Create pp→ e−ν¯e. Have a look at the output in HTML/info.html (use a browser for that). Editing theproc card.datand generate the process by runnigbin/newprocess.
• Calculate the cross section at a center-of-mass energy of 14 TeV. The settings for the run can be done in Cards/run card.dat, the cross section can be obtained by the script bin/survey. Choose ”serial run”. (To avoid the prompt, you can execute the script with a 0 as argument). Look at the output inSubProcesses/results.html for the cross sections.
• Produce an event file by using bin/generate events with the option ”serial run”.
Have a look at the event file inEvents (for example using the programless) and the updatedHTML/info.html.
• Calculate the cross section in dependance of the for center-of-mass energy (1 TeV - 14 TeV) and compare with the cross section at the Tevatron (p¯p collider, c.o.m. energy 1.96 TeV - edit the beam parameters in the proc card.dat).
• Calculate the cross section in dependance of the cut on the transverse momentum (pT) of the electron at 14 TeV. Have a look at thepT distribution.
• Plot the invariant mass of the (e−,ν¯e) pair and their angular dependence.
• Display the branching ratios of theW boson two-body decays (Specify all the possible decay channels and calculate the ratios of their cross sections).
• (optional) Compare the cross section for pp → e−ν¯e with the one for pp → e+νe. Is there a difference? Why?
To plot a distribution, we use MadAnalysis. It is already installed, to use it, there is the script bin/plot. It is steered by the values in Cards/plot card.dat. MadAnalysis is a little bit hard to understand at first, because of the very compact way it works. In principle it is quite straightforward: There are predefined kinematical quantities which can be calculated from one or more fourvectors, like the rapidity or the transverse momentum as well as invariant mass of a dijet pair and so on2.
MadAnalysis will analyze your event file. The event file is a so called ”Les Houches Event file” (.lhe) and stored by default in Events/. Take a look at it, using less. The file is roughly organized with XML tags, first all the Cards used in generation are pasted in the comment part of the header, then there is some run information (colliding particles, energies, p.d.f. set used) between the<init>tags and finally for each event information about scales, weights and couplings and a list of the involved particles, their mother-daughter relations, color flow and five-momentum, each separated by an<event> tag.
Try to understand the various possibilities to draw different observables by playing around with the possible settings. All the predefined observables are listed with their names and possible applications in Cards/plot card.dat, however, most of them are commented out.
You can define your own particle classes, that is sets of particles you want to treat the same and examine their distributions. This is done at the beginning, after the introduction between the Classes tags.
plot events then will look for an input file called events.list in which the path of your event sample is stored. So you basically just create a new text file with this name and write the (relative) path to your event file. The path to this file needs to be written inevents.list. This will be read in and analyzed. The result is a topdrawer file (*.top) which is converted into a plot by topdrawer, an ancient plotting program similar to gnuplot.
So after the successful execution of plot events you will have a lot of pictures with your distributions.
(Note: normally MadEvent will automatically compress the eventfiles, MadAnalysis can- not read the compressed files. Use gunzip myevents.lhe.gzto uncompress the files).
There is an additional script, bin/combine-pl, that lets you plot several distributions into one. For this, you specify the different topdrawer files to be combined and the script will
2If you think this is old fashioned, since root can do this in a fast and easy way you are right, but in fortran things are not that easy and nobody yet was willing to port the complete HELAS part to c++
make one topdrawer file with superimposed plots. This does not always work as it should, unfortunately.
For plotting the combined plots, you have to invoke topdrawer manually, it is located in /opt/MG_ME_V4.4.26/topdrawer/bin/td
If you plan to use it more often with one combination, you can create a link to it so you do not have to type the whole path every time.
4 Calculate pp → Z/γ
∗→ µ
+µ
−production
• Generate the processes pp→µ+µ−.
• Apply cuts on the transverse momentum of both muons: pT,µ± >10 GeV (this corre- sponds to a typical trigger cut of an LHC detector) and calculate the cross section at 14 TeV. Compare the contributions of the various subprocesses.
• Plot the muon transverse momentum and the dimuon invariant mass distributions, explain the features observed and the difference with respect to the W− production studied in the previous example.
• Plot the muon pseudorapidity; apply an additional cut of |ηµ±| < 2.5 (typical accep- tance of an LHC muon detector) and study the effect on the ”visible” cross section.
• Apply an additional cut of 80 GeV < M(µ+, µ−) < 100 GeV, calculate the corre- sponding cross section and estimate the number of events expected for an integrated luminosity ofL= 1fb−1, given a trigger and reconstruction efficiency of 80% per muon.
• (Optional) Compare the contributions from the photon andZ boson by excluding one of them. Exclusion of a particle/resonance can be done by writing/ name at the end of the line with the process definition (not commented out, however)
• (Optional) Calculate all the possible Z boson decays in the mass window 80 GeV <
M(µ+, µ−)<100 GeV. If you add each possible decay channel as an extra subprocess, you can get theZbranching ratio from the ratio of the different cross sections. Compare your result with the literature.
5 Calculate pp → t¯ t production
• Generate the processpp→t¯t.
• Calculate the totalt¯tproduction cross section at the LHC; Estimate the fraction of the cross section which is gluon-induced, compared with the one which is quark induced.
• Do the same calculation for the Tevatron; (set the colliding particles to p¯p and the c.o.m. energy to 1.96 TeV - edit the beam parameters in theproc card.dat). Compare the total cross section with the one at the LHC. Also compare the gluon-induced and quark-induced fractions.
• Use the branching ratios of the W boson calculated previously or taken from the literature in order to work out the branching ratios fort¯t decaying into the following final states:
– ”all hadronic”: both W bosons decay into a quark and antiquark;
– ”semileptonic”: one W boson decays into q+ ¯q, the other one into a lepton and neutrino;
– ”dileptonic”: both W bosons decay into lepton and neutrino.
6 Higgs search
One of the most important objects for the upcoming LHC is the search for the Higgs boson.
Since this particle couples to all massive particles, there are many possible ways to detect the Higgs through its decay products. The branching ratios of the Higgs depend however strongly on the Higgs mass. For a light Higgs (mHiggs ≈ 130 GeV) an important decay channel ish→τ+τ−.
H g1
g2
(a) Gluon fusion
q1 q1
q2 q2
H V
V
(b) VBF
g1 t
¯t g2
H
(c) Assoc. production
¯q q H
V
(d) Higgs strahlung
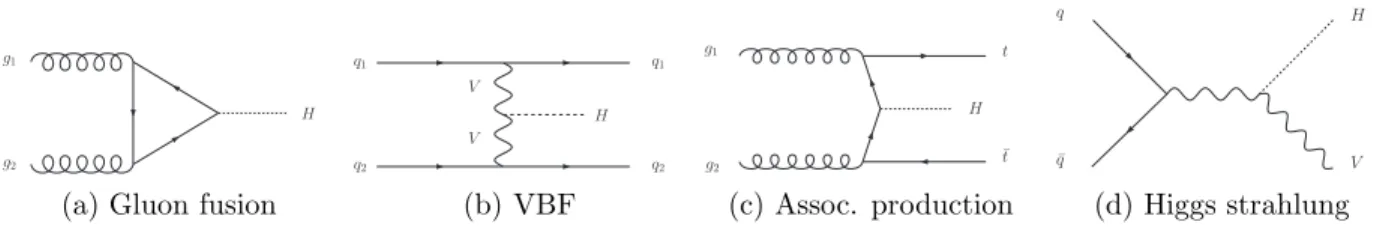
Figure 1: Higgs production processes
At the LHC, there are four possible channels to discover the Higgs boson, gluon fusion, vector boson fusion, associated production witht¯t and Higgs strahlung. Gluon fusion is the most dominant process with the largest cross section, however here we run into a problem using MadEvent since this process is loop induced. That means to calculate this process, we need to calculate a diagram with a loop. Which MadGraph cannot do. There is a loophole, however. Since the Higgs couples stronger to the massive particles, the dominant contribution in the loop will be from top quarks. These are rather heavy objects and it can be shown that the loop integral can be decomposed like M1+ 1/m2top· M2+O(1/m3top). So we can make the approximation mtop → ∞ and get an effective field theory which we can use to generate tree level Feynman diagrams with an effective gluon gluon higgs coupling (symbolically the triangle loop becomes one dot).
This is already implemented as a model. The model is called heft for Higgs effective field theory. You have to load this model in order to use this new coupling and of course specify that you want to use it at least once in the process calculation. To load a model, you have to specify it in your proc card.dat. Have a look at the details of the model in /opt/MG ME V4.4.26/models/heft. The available particles are defined in particles.dat, the interactions ininteractions.dat.
Since we do not know the correct Higgs mass yet, we have to compare different scenarios.
• Generate the processpp→h→τ+τ− using the model heft.
• We want to compare different light Higgs masses,mhiggs= 120,130,140 GeV. Since the Higgs couplings depend strongly on its mass, we have to adjust them. This is a rather cumbersome calculation involving the whole electroweak sector of the standard model, but luckily MadEvent provides a simple program to set up a new Higgs mass scenario.
It can be found on the web page, under ”Tools”, here click on ”Standard Model” and enter the Higgs mass you want. Do not change the other parameters unless you know what you are doing. This script generates a file called param card (number).dat.
Move this file into the Cards directory. Note that MadEvent will use the file called param card.dat, so you can keep the ones you do not need at the moment under a different name as well. Calculate the cross sections and create samples for the different Higgs masses at 14 TeV. Keep the different samples so we can compare them.
• A very important background is Z boson production with the decay Z → τ+τ−. Generate this process as well and compare the invariant mass plots for the various samples.
6.1 Cross sections (optional)
Calculate the cross sections for the four possible Higgs production processes for 10 TeV and 14 TeV. Compare different Higgs masses and decay products.
7 Supersymmetry
Another important aspect of the LHC physics program will be the search for new physics.
Among the most prominent candidates for new physics is supersymmetry. Here every particle has asuperpartner, which is a boson if the particle is a fermion and vice versa.
Create some typical processes in the MSSM, the minimal supersymmetric model.
• To use the MSSM, you have to load the model. Have a look at the various particles in the particles.dat of the model.
• Calculate the cross section for the processpp→Z →χ˜±1χ˜±1 at a center-of-mass energy of 14 TeV.
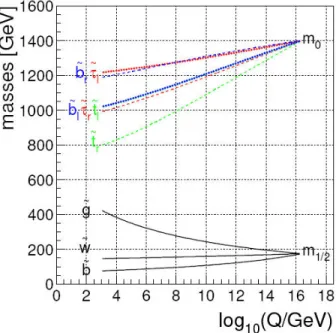
Figure 2: The evolution of the particle spectrum. The squarks and sleptons have masses in the TeV range, while the gluinos and charginos are relatively light.
• Calculate the cross section for the process pp → W± → χ˜±1χ˜02 at a center-of-mass energy of 14 TeV.
• Calculate the cross section for the process gg → ˜g˜g at a center-of-mass energy of 14 TeV. (Note: for some reason, this does not work on the virtual machine, no matter how much RAM it is assigned. Use the web interface for this)
7.1 Cross sections for dedicated final states (optional)
An important aspect of most SUSY models isR-parity conservation, that is the conservation of superparticle number. Superparticles have positiveR-parity, their antiparticles a negative
Figure 3: Feynman diagrams for the processes pp→Z →χ˜±1χ˜±1 and pp→W±→χ˜±1χ˜02.
Figure 4: Feynman diagrams for the process gg→˜gg.˜
one. That means that there is no possible decay of a superparticle into standard model particles only, at least one of the decay products has to be a superparticle. This means that when a heavy superparticle has been created, there are whole decay chains including lighter superparticles until a non-decaying superparticle is reached. This is often called the LSP, the lightest supersymmetric particle and since it cannot decay it is a possible candidate for dark matter.
For an analysis, you are interested in the final state of a process, so you would like to calculate the various decay chains to get the cross section for the actual final state. Generate the processes in the table and calculate the cross sections for the given processes. (To specify a specific decay for a particle, use brackets: pp > (t > b (w+ > l+ vl)) t∼ specifies the creation of a top-antitop pair where the top decays leptonic whereas no decay is specified for the anti-top.
process final states
2 2ν ET
σ ≈0.2pb
1 2j ν ET
σ ≈0.3pb
3 ν ET
σ ≈0.1pb
2 6j ET
σ ≈0.09pb