Kathrin Lesser (Germany), Felix Rößle (Germany), Christian Walkshäusl (Germany)
International socially responsible funds: financial performance and managerial skills during crisis and non-crisis markets
Abstract
Nofsinger and Varma (2014) provide evidence that U.S. socially responsible funds outperform conventional funds during periods of market turmoil and, therefore, grant some crisis insurance. To investigate whether the U.S.-based evidence can be transferred to international markets, the authors analyze a comprehensive sample of internationally-investing socially responsible equity funds in a period from 2000 to 2012. As abnormal returns are model-specific, the authors apply standard and q-theory based performance measurement models. At first glance, the authors observe no crisis protection for internationally-investing socially responsible funds. However, splitting their sample in funds domiciled in North America, Europe, and Asia-Pacific to account for biases due to the origin of a fund, the authors find that socially responsible funds from North America outperform their peers in crisis periods irrespective of the applied performance evaluation model. The authors suggest that the U.S.-based evidence is restricted to internationally-investing funds domiciled in North America, and discover that this outperformance seems to be owed to the stock-picking abilities of North American fund managers and their advantage due to the nature of the North American market.
Keywords: socially responsible investments, mutual funds, international markets, performance evaluation, managerial abilities.
JEL Classification: G11, G12, G15, G23, M14.
Introduction
Sustainability becomes more and more important around the world. One of the key drivers behind sustainability practices is the increasing investor demand for socially responsible investing strategies which includes ethical and green investments (Nofsinger and Varma, 2014).
Socially responsible investing strategies already have a significant scale in the global financial market. The Global Sustainable Investment Alliance (2012) states that professionally managed assets amount to at least USD 13.6 trillion around the world, and represent 21.8 percent of the total assets managed professionally.
Therefore, it is no wonder that scholars around the world intensively investigated the financial performance of socially responsible funds in the past years. The majority of these studies finds that socially responsible funds perform similar to the market and their conventional peers (see Renneboog et al. (2008a) for an overview).
However, most recently, Nofsinger and Varma (2014) examined non-crisis and crisis markets separately, and discovered that U.S. socially responsible funds underperform in normal periods, but outperform during periods of market turmoil. Thus, socially responsible investments seem to provide some crisis insurance.
Kathrin Lesser, Felix Rößle, Christian Walkshäusl, 2016.
Kathrin Lesser, University of Regensburg, Center of Finance, Regensburg, Germany.
Felix Rößle, University of Regensburg, Center of Finance, Regensburg, Germany.
Christian Walkshäusl, University of Regensburg, Center of Finance, Regensburg, Germany.
Motivated by Nofsinger and Varma (2014), we intend to investigate whether the U.S.-based evidence can be transferred to international markets.
To do so, we analyze the financial performance of a comprehensive sample of internationally-investing socially responsible equity funds from North America, Europe, and Asia-Pacific. As abnormal returns are model-specific, we apply standard and novel multi-factor performance measurement models. Apart from the empirically-motivated Fama and French (1993) and Carhart (1997) four-factor model applied by Nofsinger and Varma (2014), we employ the novel q-theory factor model of Chen et al. (2010) that is based on the fundamentals of the firm. In this way, we contribute to the literature by providing new evidence relevant to the understanding of the return behavior of internationally-investing socially responsible funds and their differences to matched conventional counterparts during different market regimes.
Previous literature shows that mutual funds tend to perform better during crisis periods than during expansion periods, suggesting that the abilities of a fund manager may be state-dependent (e.g., Moskowitz, 2000; Wang, 2010; Glode, 2011;
Kosowski, 2011). In particular, fund managers might increase their effort during poor economic times due to strong investor demand. Though Nofsinger and Varma (2014) provide interesting empirical evidence on the financial performance of socially responsible funds in crisis and non-crisis periods, they did not take into consideration the abilities of a fund manager. Nofsinger and Varma (2014) suppose that the nature of socially
responsible investments dampens downside risk.
They argue that socially responsible firms are more likely to successfully navigate the dynamic challenges of crisis periods, as positive socially responsible attributes of firms, e.g., strong environmental, social, governance, and ethical responsibility, make them less risky. However, we shed light on the question whether socially responsible fund managers follow more successful stock-picking, market, and style timing strategies in crisis than in non-crisis periods.
Despite the growing interest in socially responsible investing, evidence on its financial performance and managerial abilities in crisis and non-crisis markets is scarce. Apart from Nofsinger and Varma (2014), we are only aware of few studies analyzing the financial performance of socially responsible funds during different market regimes. Noting that the number of U.S. socially responsible funds that exhibit positive and statistically significant alphas increases during high-volatility regimes, Areal et al.
(2013) encourage the findings of Nofsinger and Varma (2014). Moreover, Becchetti et al. (2015) find that socially responsible funds from different markets played an insurance role outperforming conventional funds during the 2007 global financial crisis. However, Muñoz et al. (2014) observe that U.S. and European funds obtain statistically insignificant performance in crisis periods, and Lesser et al. (2016) find the same for global funds.
In addition, Leite and Cortez (2015) argue that French socially responsible funds perform similar to characteristics-matched conventional funds during market downturns, and underperform their peers in non-crisis periods. Therefore, existing evidence does not allow us to draw conclusions on whether the findings of Nofsinger and Varma (2014) can be transferred to international markets.
There are several studies examining stock-picking and market timing abilities of socially responsible fund managers. The majority of these studies suggests that socially responsible fund managers are not able to follow successful stock-picking strategies (e.g., Girard et al., 2007; Ferruz et al., 2012a, 2012b;
Muñoz et al., 2014, 2015; Leite and Cortez, 2015).
Additionally, most of the previous literature provides evidence that socially responsible fund managers show no market timing abilities (e.g., Renneboog et al., 2008b). While Kreander et al. (2005) observe that socially responsible fund managers from several European markets are unable to time the market, Schröder (2004) and Ferruz et al. (2012a, 2012b) find the same for funds from the U.S. market. However, evidence on style timing skills of socially responsible fund managers is scarce and inconclusive, and merely
based on the Fama and French (1993) and Carhart (1997) styles. Gregory and Whittaker (2007) are the first to detect a positive ability for socially responsible fund managers from the U.K. to time the book-to-market style, and Muñoz et al. (2014) additionally observe size timing skills for European fund managers. Moreover, Muñoz et al. (2014) find book-to-market timing skills for U.S. fund managers, while Ferruz et al. (2012a) argue that they show a lack of ability to time the size, book-to-market, and momentum styles.
Evidence on the managerial abilities of socially responsible fund managers in non-crisis and crisis markets is still limited to two studies. Leite and Cortez (2015) conclude that French socially responsible fund managers achieve better managerial abilities in crisis than in non-crisis periods. They observe that socially responsible funds exhibit significantly lower stock-picking abilities than conventional funds during non-crisis periods, but no significant differences in terms of selectivity in crisis periods. Moreover, French socially responsible fund managers are able to successfully time the book-to-market style, and show better momentum timing skills than conventional fund managers during market downturns. Muñoz et al. (2014) find no successful stock-picking strategies for funds from the U.S. and European markets during both market regimes.
However, they provide evidence that U.S. fund managers are better timers in crisis markets, while the opposite occurs for fund managers from the European market. In particular, U.S. fund managers show a tendency towards successfully timing the size and the book-to-market styles during market downturns, while European fund managers are able to time the book-to-market style in normal periods.
Though Muñoz et al. (2014) study the specific case of green, matched ESG and matched conventional funds in a period from 1994 to 2013, and solely base their results on the Fama and French (1993) and Carhart (1997) model, their finding of differences between U.S. and European funds in terms of managerial abilities is of particular interest for our broad international study.
To the best of our knowledge, we investigate the most comprehensive sample of actively-managed, internationally-investing socially responsible equity funds at this point in time. Moreover, we take into consideration recent developments in asset pricing, and are the first to apply q-theory-based models to measure the financial performance of socially responsible funds and the differences to their conventional peers in non-crisis and crisis markets.
In a period similar to that of Nofsinger and Varma
(2014), we find no crisis protection for internationally-investing socially responsible funds.
At first glance, the U.S.-based findings of Nofsinger and Varma (2014) seem not to be transferrable to international markets. However, motivated by Muñoz et al. (2014), we split our sample into funds domiciled in North America, Europe, and Asia- Pacific to account for biases due to the origin of a fund. This procedure enables us to provide evidence that socially responsible funds from North America outperform the market and conventional funds in crisis periods irrespective of the applied performance evaluation model. We suggest that the U.S.-based evidence of Nofsinger and Varma (2014) is restricted to internationally-investing funds domiciled in North America, and provide some evidence that this outperformance seems to be predominantly owed to the stock-picking abilities of North American fund managers during market turmoil and their advantage due to the nature of the North American market.
1. Data and methodology
1.1. Data and summary statistics. To investigate the financial performance and managerial abilities of socially responsible investment vehicles, we analyze an internationally-diversified portfolio of 210 actively managed equity funds from January 2000 through December 20121. We solely consider equity funds, as the corresponding data allow us to give insights on the style timing abilities of socially responsible fund managers. To put together the most comprehensive set of actively managed socially responsible equity funds at this point of time, we extensively search through various databases and the internet. First, we scanned the Morningstar and Thomson Reuters databases to identify globally- investing funds with socially responsible investment objectives. To identify further missing funds, we looked through publicly available lists on the internet (e.g., www.socialfunds.com), and did an intensive research using common search engines.
Thereby, we explicitly searched for dead socially responsible funds to avoid a survivorship bias2. All performance-based data are taken from Datastream, holding data are obtained from the fund’s annual reports and Morningstar, respectively. Testing for a regional bias, Gregory and Whittaker (2007) find that funds, which claim to be international in nature, may exhibit a home bias in their portfolio allocations. Therefore, we finally investigate the country-weightings within our international funds.
On average, the weighting of North American
1 We analyze a period starting in January 2000, as this allows us to compare our results with that of Nofsinger and Varma (2014).
2 The number of dead funds amounts to 35 funds, or 16.7% of the entire sample.
stocks in funds emitted in North America amounts to 56%, while that of European (Asian-Pacific) stocks in funds emitted in Europe (Asia-Pacific) amounts to 40% (13%). This allocation is similar to that of the MSCI World Index.
In this study, we compare the financial performance and managerial abilities of socially responsible equity funds to a sample of matched conventional equity funds. The matching procedure is highly restrictive and helps to eliminate the effect of specific fund characteristics. As reference group, we select all global equity mutual funds from the Morningstar database that do not explicitly claim to use socially responsible screening procedures. To avoid a survivorship-bias, we include dead series. Applying the matching fund approach suggested by Nofsinger and Varma (2014), we identify three peer conventional funds with similar Morningstar fund objectives, years in existence, and total net assets for each socially responsible fund.
We, first identify conventional funds with the same Morningstar objectives and inception dates within a year of the socially responsible fund’s inception date.
In a second step, we identify three conventional funds closest in total net assets3. These three matched funds come from different fund families to ensure that the matched conventional fund performance is not dominated by a few fund families. Finally, we construct an equal-weighted aggregated portfolio of our socially responsible portfolio and its matched conventional counterparts.
During the period from January 2000 to December 2012, we identify two crisis periods in the international stock market based on the peak and trough of the MSCI World Index. The first crisis period covers a period from March 2000 to October 2002, and is characterized by the technology bubble burst. The second crisis period is from October 2007 to March 2009, and represents the global financial crisis. These international periods are identical to the market periods identified by Nofsinger and Varma (2014) for the U.S. market.
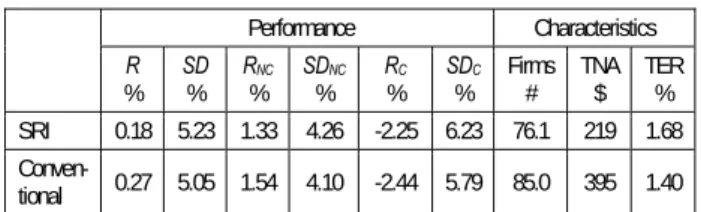
Table 1 presents summary statistics for our socially responsible funds and their matched conventional peers, including monthly performance data over the full period, non-crisis markets, and crisis markets. Moreover, it reports several fund characteristics that include the average number of constituents, the average total net assets in million U.S. dollars, and the average total expense ratio.
3 For very few funds in our sample, three matches were not found due to the one year age criteria being too restrictive. Similar to Nofsinger and Varma (2014), in such cases, we relax the fund inception date by two years and if we still do not achieve three matched funds, we drop the age criteria completely. We followed the same procedure if fund holding data were not available.
Table 1. Summary statistics
Performance Characteristics R
% SD
% RNC
% SDNC
% RC
% SDC
% Firms
# TNA
$ TER
% SRI 0.18 5.23 1.33 4.26 -2.25 6.23 76.1 219 1.68 Conven-
tional 0.27 5.05 1.54 4.10 -2.44 5.79 85.0 395 1.40
This table presents summary statistics for the socially responsible funds and their matched conventional peers. The table reports the average return (R) and volatility (SD) of our portfolios over the full period from 2000 to 2012, in non- crisis markets (NC), and crisis markets (C).
Moreover, it summarizes the average number of constituents (Firms), the average total net assets (TNA) in million USD, and the average total expense ratio of the funds (TER). All performance-based data are taken from Datastream, holding data are obtained from the fund’s annual reports and Morningstar, respectively.
The information in Table 1 highlights several differences between the two portfolios. Socially responsible funds exhibit lower returns, but higher volatility than their matched conventional counterparts in the period from January 2000 through December 2012 and during non-crisis markets. However, though showing higher volatility, socially responsible funds achieve on average less negative returns than their conventional peers during market downturns.
Therefore, the two investment approaches may be different from each other in terms of financial performance during different market regimes.
Moreover, we identify considerable differences with respect to fund-specific characteristics. In particular, we observe that socially responsible funds include fewer holdings and comprise a smaller amount of total net assets than their conventional counterparts, which may be owed to the nature of their narrower investment objective.
In addition, we suggest that intensive screening procedures may explain that socially responsible funds charge higher fees than their matched conventional peers.
1.2. Time series factor regression tests. As abnormal returns are supposed to be model- specific, we employ standard and innovative multi-factor time series regression models to examine the financial performance of socially responsible investments. Our first model is the Fama and French (1993) and Carhart (1997) four- factor model. The four-factor model is widely used in the previous literature, and allows us to compare our internationally-diversified results with prior evidence. However, considering recent
developments in asset pricing and performance evaluation, we enrich our measurement framework by taking advantage of a novel multi- factor performance measurement model. Our second model is the q-theory factor model of Chen et al. (2010) who propose an alternative three-factor model consisting of the market factor, an investment factor and a profitability factor. In contrast to the empirically-motivated three-factor model of Fama and French (1993), their model is derived from the q-theory of investment and builds upon the economic intuition that the firm’s investment behavior and profitability are the two fundamental drivers of expected returns. Chen et al. (2010) present ample evidence that the q- theory factor model is a worthwhile alternative for measuring performance (among other applications) relative to the standard three-factor model. Ammann et al. (2012) confirm the U.S.
findings in international markets.
Our outlined measurement framework translates into the following two monthly time-series factor regression equations:
-
,
i f NC NC C C i i
i i i
R R D a D a b MKT s SMB h HML wWML e
(1)-
.
i f NC NC C C i i
i i
R R D a D a b MKT d DMI p PMU e
(2)Regressions (1) and (2) describe the four-factor model and q-theory factor model, respectively. In these regressions, Ri – Rf is the monthly excess return of portfolio i and MKT is the monthly excess return of the MSCI World Index. Rf corresponds to the monthly U.S. T-Bill rate4. aNC and aC are the alpha estimates measuring out- and underperformance in non-crisis and crisis periods, respectively. DNC (DC) is a dummy variable that takes the value of one during non-crisis (crisis) months and zero otherwise. ei is the regression residual. SMB, HML, WML, DMI, and PMU are, respectively, the returns on the explanatory factors related to size, value, momentum, investment, and profitability. The construction of SMB, HML, and WML for our international sample follows Fama and French (1993) and Carhart (1997). SMB (small minus big) is the return difference between portfolios of small and big stocks in terms of market capitalization. HML (high minus low) is the return difference between portfolios of high and low book-to-market stocks.
WML (winners minus losers) is the return
4The monthly U.S. T-Bill is taken from Kenneth French’s data library. It is accessible through http://mba.tuck.dartmouth.edu/pages/faculty/ken.french/.
difference between portfolios of stocks with high and low prior twelve-month returns. Following Chen et al. (2010), DMI (disinvest minus invest) is the return difference between portfolios of low and high investment-to-assets stocks, whereas PMU (profitable minus unprofitable) is the return difference between portfolios of high and low return-on-assets stocks.
1.3. Managerial abilities models. Managerial abilities are able to specify the success of a fund manager. While stock-picking talent is determined by the ability to select stocks that outperform other stocks with a similar level of non- diversifiable risk, market timing is based on a fund manager’s ability to anticipate major turns in the stock market and adjust the composition of the fund accordingly. If a fund manager supposes the market is going to fall, he shifts the composition of the fund from more to less volatile stocks. In the previous literature, the Treynor and Mazuy
(1966) model is one of the most widely accepted approaches to check the presence of stock-picking and market timing abilities (e.g., Ferson and Schadt, 1996; Bollen and Busse, 2001). However, a fund manager can also seek to predict the direction of different investment styles, and improve the financial performance of a fund by increasing its exposure towards the styles that are supposed to generate a good performance, and by reducing the sensitivity towards the styles with an inferior predicted behavior. Recent literature shows how the Treynor and Mazuy (1966) model can be combined with multi-factor performance evaluation models to additionally account for style timing abilities (e.g., Lu, 2005; Ferruz et al., 2012a; Yu, 2012; Muñoz et al., 2014; Leite and Cortez, 2015). Similar to Leite and Cortez, (2015), we incorporate two dummy variables that allow us to separately consider managerial abilities in non- crisis (DNC) and crisis (DC) periods. This framework leads to the following two equations:
2 2 2
,
2 2 2 2 2
, , , , ,
-
,
i f NC NC C C NC NC C C NC NC C C NC NC
C C NC NC C C NC NC C C NC SMB NC
C SMB C NC HML NC C HML C NC WML NC C WML C i
R R D a D a D b MKT D b MKT D s SMB D s SMB D h HML D h HML D w WML D w WML D MKT D MKT D SMB
D SMB D HML D HML D WML D WML e
(3)
2 2 2 2 2
, , ,
2 ,
-
.
i f NC NC C C NC NC C C NC NC C C NC NC
C C NC NC C C NC DMI NC C DMI C NC PMU NC
C PMU C i
R R D a D a D b MKT D b MKT D d DMI D d DMI D p PMU D p PMU D MKT D MKT D DMI D DMI D PMU
D PMU e
(4)
Regressions (3) and (4) describe the managerial abilities models based on the four-factor model and the q-theory factor model, respectively.
aNC and aC represent the portfolio alphas in non- crisis and crisis periods, respectively, measuring stock-picking abilities of socially responsible fund managers. If alpha is positive and significant, a fund manager has the skill to follow successful stock-picking strategies. However, if it is negative or insignificant, he does not have this talent. The market portfolio gamma (γ) informs us of market timing. If the gamma coefficient is significant and positive, the fund manager possesses successful market timing skills; otherwise, he times the market incorrectly.
γSMB, γHML, γWML, γDMI,and γPMU measure the ability of a fund manager to time the styles associated with size, book-to-market, momentum, investment, and profitability, respectively.
While a significant and positive coefficient indicates that the fund manager has successful timing abilities, he times the styles incorrectly in any other case.
2. Results
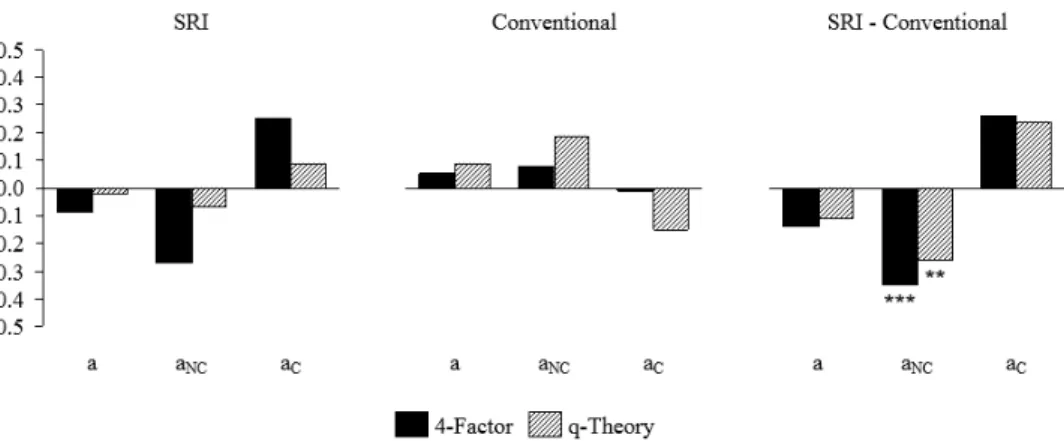
2.1. Financial performance. Figure 1 presents alpha estimates for the socially responsible, matched conventional, and difference portfolios using the two outlined performance measurement models over the full sample period, non-crisis markets, and crisis markets. The difference portfolio is constructed by subtracting the conventional portfolio returns from the returns of the socially responsible portfolio. The construction of the difference portfolio is in line with existing literature on performance differentials (e.g., Nofsinger and Varma, 2014). It enables us to test whether the financial performance is significantly different between the two investment approaches.
Figure 1 illustrates that the socially responsible portfolio performs similar to the market and matched conventional funds in the full period, as we find no alpha estimates that are significantly different from zero after various risk adjustments. However, moving towards the different market regimes reveals a different picture. We observe no performance differentials between socially responsible funds and their matched conventional peers during market turmoil, whereas they considerably underperform in non-crisis periods.
Fig. 1. Financial performance: alpha estimates in percent per month
This figure presents monthly alpha estimates for the socially responsible, conventional, and difference portfolios using the four-factor and the q-theory factor model over the full sample period, non-crisis markets, and crisis markets. The difference portfolio is constructed by subtracting the conventional portfolio returns from the returns of the socially responsible portfolio. The asterisks give the statistical significance of the alpha estimates at the 5% (**) and 1% (***) level. All performance-based data are taken from Datastream.
Similar to Nofsinger and Varma (2014), we find that socially responsible funds underperform their peers in non-crisis periods. However, they detect an outperformance of U.S. socially responsible funds during crisis periods that we do not observe. Though analyzing a similar period, our results imply that internationally-diversified funds do not exhibit some sort of crisis protection. At first glance, the U.S.- based evidence of Nofsinger and Varma (2014) seems not be transferrable to international markets.
2.2. Country-specific biases. In this subsection, we intend to discover why our results differ from the U.S.-based findings of Nofsinger and Varma (2014).
Obviously, the most important difference between our sample and that of Nofsinger and Varma (2014) is our international investment focus. Previous
literature suggests that screening practices may vary from one region to another (e.g., Renneboog et al., 2008b, 2011; Muñoz et al., 2014). For example, Renneboog et al. (2008b, 2011) point out that socially responsible funds in Europe use different screening foci than U.S. funds. As this issue is of particular interest for our international study, we intend to examine whether our sample exhibits any biases due to the origin of a fund.
We divide our sample in funds domiciled in North America, Europe, and Asia-Pacific. To do so, we check the international securities identification number of each fund. While European funds amount to 74.3%
percent of the overall sample, North American funds represent 18.6%, and Asian-Pacific funds correspond to 7.1%. Our allocation is similar to that of the Global Sustainable Investment Alliance (2012) stating that the global market for socially responsible investments is driven by Europe that presents 64.5% of the total socially responsible assets.
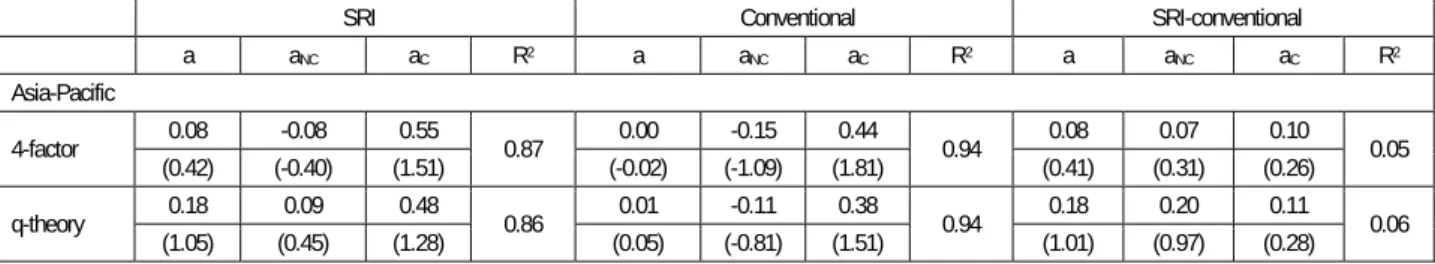
Table 2 illustrates the alpha estimates for the North American, European, and Asian-Pacific socially responsible portfolios, their matched conventional counterparts, and the difference portfolios using the four-factor model and the q-theory factor model over the full sample period, non-crisis markets, and crisis markets.
Table 2. Financial performance: alpha estimates of the North American, European, and Asian-Pacific sub- portfolios in percent per month
SRI Conventional SRI-Conventional
a aNC aC R2 a aNC aC R2 a aNC aC R2
North America
4-factor 0.10 -0.12 0.55**
0.92 -0.03 -0.02 -0.06
0.95 0.13 -0.11 0.60***
0.19 (0.81) (-0.82) (2.54) (-0.31) (-0.14) (-0.32) (1.37) (-0.92) (3.66) q-theory 0.14 -0.01 0.46**
0.92 -0.04 0.07 -0.27
0.93 0.17 -0.09 0.73***
0.13 (1.16) (-0.09) (2.16) (-0.31) (0.52) (-1.31) (1.78) (-0.77) (4.36) Europe
4-factor -0.19 -0.32** 0.08
0.92 0.03 0.05 -0.01
0.97 -0.22 -0.37*** 0.10
0.05 (-1.42) (-1.98) (0.35) (0.41) (0.57) (-0.11) (-1.85) (-2.59) (0.47) q-theory -0.10 -0.10 -0.10
0.90 0.07 0.17 -0.15
0.96 -0.17 -0.27** 0.05
0.03 (-0.72) (-0.59) (-0.38) (0.86) (1.72) (-0.99) (-1.52) (-2.00) (0.26)
Table 3 (cont.). Financial performance: alpha estimates of the North American, European, and Asian-Pacific sub-portfolios in percent per month
SRI Conventional SRI-conventional
a aNC aC R2 a aNC aC R2 a aNC aC R2
Asia-Pacific
4-factor 0.08 -0.08 0.55
0.87 0.00 -0.15 0.44
0.94 0.08 0.07 0.10
0.05 (0.42) (-0.40) (1.51) (-0.02) (-1.09) (1.81) (0.41) (0.31) (0.26) q-theory 0.18 0.09 0.48
0.86 0.01 -0.11 0.38
0.94 0.18 0.20 0.11
0.06 (1.05) (0.45) (1.28) (0.05) (-0.81) (1.51) (1.01) (0.97) (0.28)
This table investigates North American, European, and Asian-Pacific socially responsible sub- portfolios. The table presents monthly alpha estimates for the socially responsible, conventional, and difference portfolios in the full period, non- crisis markets, and crisis markets. The alpha estimates are obtained from regressing the monthly excess returns of the portfolios on the explanatory factors of the four-factor model and the q-theory factor model. The difference portfolios are constructed by subtracting the conventional portfolio returns from the returns of the socially responsible portfolio. In addition, we present the adjusted R2. The asterisks give the statistical significance of the alpha estimates at the 5% (**) and 1% (***) level, t-statistics are moreover reported in parentheses. All performance-based data are taken from Datastream.
At first, regarding the full period and non-crisis period results, we do not find alpha estimates on the North American portfolios that are significantly different from zero. Thus, North American socially responsible funds perform similar to the market and matched conventional funds after controlling for a large set of established and novel return predictors. However, we find striking results with respect to market downturns. North American funds outperform the market and matched conventional funds in crisis periods regardless of the applied performance measurement model. The extent of the outperformance is exceptionally large with monthly alpha estimates of up to 0.73%. The European and Asian-Pacific portfolios, however, show different results. In particular, we discover no performance differentials for Asian-Pacific funds, while European funds perform similar to the market and matched conventional funds in crisis periods, but underperform in normal periods.
Interestingly, the underperformance of European socially responsible funds is more pronounced in the four-factor model than in the q-theory factor model results. We will explain this issue in more detail in the next subsection. Generally, our results indicate that the underperformance of socially responsible funds in Figure 1 seems to be driven by European funds.
With respect to internationally-investing socially responsible funds domiciled in North America, our results considerably encourage the U.S.-based findings of Nofsinger and Varma (2014) who conclude that socially responsible funds are associated with positive alphas during periods of market turmoil. However, European and Asian- Pacific socially responsible funds show a different behavior than North American funds. Therefore, we suggest that the evidence provided by Nofsinger and Varma (2014) is restricted to internationally-investing funds from North America5. At the same time, our international findings do not support their assumption that socially responsible firms are more likely to successfully navigate the dynamic challenges of crisis periods, as their nature dampens downside risk (Nofsinger and Varma, 2014). With the exception of North American funds, we find poor evidence that firms exhibiting environmental, social, governance, and ethical responsibility are supposed to less likely suffer from negative events.
2.3. Managerial abilities. In this subsection, we intend to figure out why socially responsible funds domiciled in North America provide some crisis insurance relative to European and Asian- Pacific funds. As managerial abilities are able to explain the success of a fund, we are wondering whether North American fund managers show better managerial skills in crisis than in non-crisis markets, and additionally follow better stock- picking, market, and style timing strategies than European and Asian-Pacific fund managers.
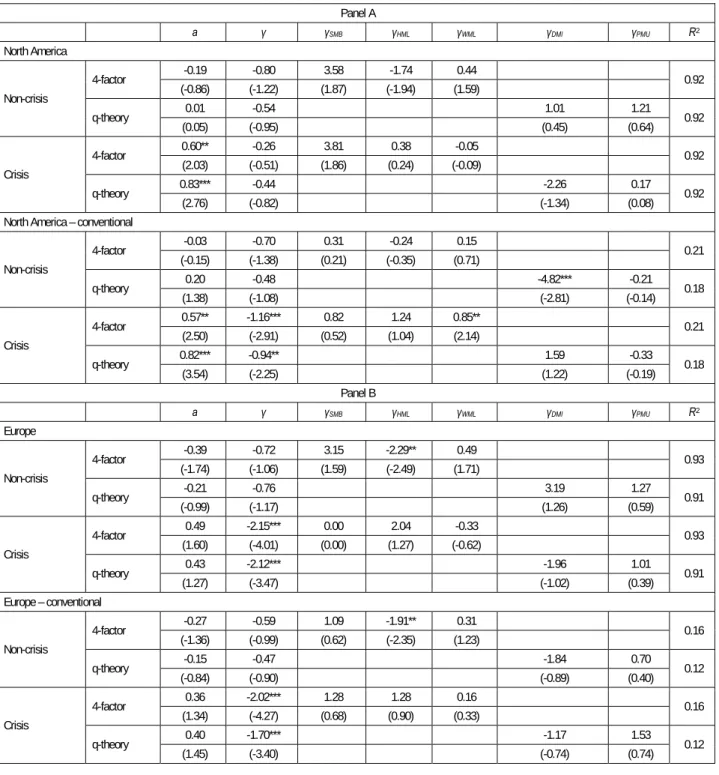
Based on the previously outlined managerial abilities models, Table 3 reports the skills of North American, European, and Asian-Pacific socially responsible fund managers and the differences to their conventional peers during normal markets and market turmoil.
Panel A summarizes the stock-picking, market, and style timing skills of North American socially responsible fund managers. We observe that
5 We find similar results when applying the quality factor model of Asness et al. (2013).
North American fund managers show no stock- picking skills in non-crisis markets, and are not doing any better than their conventional peers.
However, we find striking results during market turmoil. We detect significantly positive portfolio alphas regardless of the applied managerial abilities model, indicating that North American fund managers follow excellent stock-picking strategies. Therefore, North American fund managers are able to select stocks that outperform conventional stocks with a similar level of non- diversifiable risk. Moreover, socially responsible fund managers exhibit better stock-picking talent than their conventional peers, as the four-factor
model and the q-theory factor model both generate positive alpha estimates that are significantly different from zero during market downturns. Market and style timing abilities, however, seem to be of minor importance in both, crisis and non-crisis markets. Though finding only little evidence of successful timing strategies, North American fund managers are better timers in crisis than in non-crisis periods. They achieve more successful momentum timing abilities than their peers and reduce the exposure towards the market which is reasonable as fund managers should move their portfolio from more to less volatile stocks during market turmoil.
Table 4. Managerial abilities of North American, European, and Asian-Pacific funds
Panel A
a γ γSMB γHML γWML γDMI γPMU R2
North America
Non-crisis
4-factor -0.19 -0.80 3.58 -1.74 0.44
0.92 (-0.86) (-1.22) (1.87) (-1.94) (1.59)
q-theory 0.01 -0.54 1.01 1.21
0.92
(0.05) (-0.95) (0.45) (0.64)
Crisis
4-factor 0.60** -0.26 3.81 0.38 -0.05
0.92 (2.03) (-0.51) (1.86) (0.24) (-0.09)
q-theory 0.83*** -0.44 -2.26 0.17
0.92
(2.76) (-0.82) (-1.34) (0.08)
North America – conventional
Non-crisis
4-factor -0.03 -0.70 0.31 -0.24 0.15
0.21 (-0.15) (-1.38) (0.21) (-0.35) (0.71)
q-theory 0.20 -0.48 -4.82*** -0.21
0.18
(1.38) (-1.08) (-2.81) (-0.14)
Crisis
4-factor 0.57** -1.16*** 0.82 1.24 0.85**
0.21 (2.50) (-2.91) (0.52) (1.04) (2.14)
q-theory 0.82*** -0.94** 1.59 -0.33
0.18
(3.54) (-2.25) (1.22) (-0.19)
Panel B
a γ γSMB γHML γWML γDMI γPMU R2
Europe
Non-crisis
4-factor -0.39 -0.72 3.15 -2.29** 0.49
0.93 (-1.74) (-1.06) (1.59) (-2.49) (1.71)
q-theory -0.21 -0.76 3.19 1.27
0.91
(-0.99) (-1.17) (1.26) (0.59)
Crisis
4-factor 0.49 -2.15*** 0.00 2.04 -0.33
0.93 (1.60) (-4.01) (0.00) (1.27) (-0.62)
q-theory 0.43 -2.12*** -1.96 1.01
0.91
(1.27) (-3.47) (-1.02) (0.39)
Europe – conventional
Non-crisis
4-factor -0.27 -0.59 1.09 -1.91** 0.31
0.16 (-1.36) (-0.99) (0.62) (-2.35) (1.23)
q-theory -0.15 -0.47 -1.84 0.70
0.12
(-0.84) (-0.90) (-0.89) (0.40)
Crisis
4-factor 0.36 -2.02*** 1.28 1.28 0.16
0.16 (1.34) (-4.27) (0.68) (0.90) (0.33)
q-theory 0.40 -1.70*** -1.17 1.53
0.12
(1.45) (-3.40) (-0.74) (0.74)
Table 5 (cont.). Managerial abilities of North American, European, and Asian-Pacific funds
Panel C
a γ γSMB γHML γWML γDMI γPMU R2
Asia-Pacific
Non-crisis
4-factor -0.01 -1.03 -1.38 3.83 0.37
0.87 (-0.02) (-1.15) (-0.4) (0.76) (1.03)
q-theory 0.02 -1.43 -0.02 4.47
0.87
(0.07) (-1.88) (-0.01) (1.58)
Crisis
4-factor 0.36 -2.44** -5.67 5.63 2.42
0.87 (0.60) (-2.32) (-0.74) (0.82) (1.85)
q-theory 0.10 -2.38*** 2.66 19.32***
0.87
(0.20) (-2.96) (0.73) (2.80)
Asia-Pacific – conventional
Non-crisis
4-factor 0.17 -1.07 -2.64 6.51 0.17
0.14 (0.55) (-1.15) (-0.74) (1.23) (0.45)
q-theory 0.00 -1.42 -0.14 7.85***
0.20
(0.01) (-1.89) (-0.04) (2.83)
Crisis
4-factor -0.32 -3.26*** -3.58 6.79 3.38**
0.14 (-0.53) (-2.98) (-0.45) (0.95) (2.48)
q-theory -0.60 -2.50*** 6.03 21.06***
0.20
(-1.27) (-3.16) (1.69) (3.10)
This table presents managerial abilities of North American, European, and Asian-Pacific socially responsible fund managers and the differences to their conventional peers in non-crisis markets and crisis markets. The difference portfolios are constructed by subtracting the conventional portfolio returns from the returns of the socially responsible portfolios. While Panel A reports the results for North American fund managers, Panel B covers the European market, and Panel C summarizes the Asian-Pacific market and represents the stock-picking ability; γ, γSMB, γHML, γMOM, γDMI
and γPMU represent the timing abilities with regard to the market return, size, book-to-market, momentum, investment, and profitability styles, respectively.
The asterisks give the statistical significance of the alpha estimates at the 5% (**) and 1% (***) level, t-statistics are moreover reported in parentheses. In addition, we present the adjusted R2. All performance-based data are taken from Datastream.
Moving towards the managerial abilities of European and Asian-Pacific fund managers in Panels B and C reveals a different picture. We find several positive alpha estimates for European and Asian-Pacific funds, albeit not statistically distinguishable from zero. Thus, European and Asian-Pacific fund managers show no stock-picking talent, and do not follow better stock-picking strategies than their conventional peers irrespective of the considered managerial abilities model and the market regime. However, similar to North American fund managers, European and Asian-Pacific fund managers achieve better managerial abilities during market turmoil. In particular, Asian-Pacific and
European fund managers are able to anticipate crisis periods and adjust the composition of their funds accordingly which indicates that they possess successful market timing abilities during market downturns. In addition, Asian-Pacific fund managers show momentum and profitability timing skills that are predominantly pronounced to crisis periods. As European and Asian-Pacific fund managers possess timing abilities that are similar to that of North American fund managers, we propose that the stock-picking talent of North American fund managers is the reason for the outperformance of North American socially responsible funds during market turmoil. Moreover, we suggest that the underperformance of European funds in normal periods based on the four-factor model is supposed to be driven by a lack of stock-picking and market timing abilities, but particularly by poor skills in terms of book-to-market timing.
4. Discussion
In light of our findings, we conclude that the fund management is of considerable importance. North American fund managers seem to possess better managerial abilities than European and Asian- Pacific fund managers. They are able to create some kind of crisis protection for their investors that seems to be owed to their stock-picking abilities.
However, North American fund managers solely show stock-picking talent during market turmoil.
Previous literature argues that mutual fund performance varies over the business cycle (e.g., Lynch and Wachter, 2007). In particular, existing studies show that mutual funds tend to perform
better during crisis periods than during expansion periods, suggesting that the abilities of a fund manager may be state-dependent (e.g., Moskowitz, 2000; Wang, 2010; Glode, 2011; Kosowski, 2011;
Kacperczyk et al., 2013). Fund managers might increase their efforts to deliver higher performances, as investors have heightened concerns about downside risk during bad states of the economy.
Moreover, Glode (2011) states that facing rational investors, the fund manager will optimally focus his work toward realizing good performance in bad states of the economy, when investors’ marginal utility of consumption is high and the investors are willing to pay more for these returns.
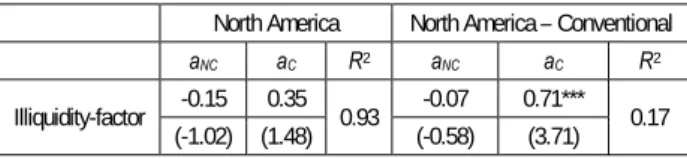
However, we are wondering why solely North American funds outperform their peers during market turmoil. Maybe, the nature of the North American market drives the financial performance of North American funds. That’s why we additionally incorporate an illiquidity factor IML (illiquid minus liquid) in our model to measure whether liquidity has an impact on financial performance of North American funds. To do so, we constructed a regional illiquidity factor in line with Amihud (2002). Table 4 shows the results.
Table 4. Financial performance and illiquidity
North America North America – Conventional
aNC aC R2 aNC aC R2
Illiquidity-factor -0.15 0.35
0.93 -0.07 0.71***
0.17 (-1.02) (1.48) (-0.58) (3.71)
This table presents the financial performance of North American funds relative to the market and their conventional peers in non-crisis and crisis markets. The difference portfolio is constructed by subtracting the conventional peers’ returns from the returns of the socially responsible funds. The alpha estimates are obtained from regressing the monthly excess returns of the portfolios on the North American explanatory factors (SMB, HML, WML, IML) of the illiquidity-factor model. In addition, we present the adjusted R2. The asterisks give the statistical significance of the alpha estimates at the 5% (**) and 1% (***) level, t-statistics are moreover reported in parentheses. All performance- based data are taken from Datastream.
We still observe positive alpha estimates during crisis periods and negative alpha estimates during normal periods. North American funds outperform their conventional peers after controlling for size, value, momentum, and illiquidity. However, we find no significant outperformance of North American funds relative to the market in market downturns.
All in all, these results suggest that the nature of the North American market might drive the financial
performance of the funds to a certain extent.
Therefore, we propose that the North American market conditions might be advantageous for fund managers to generate positive returns6.
Conclusion
In this study, we investigate a large sample of internationally-investing socially responsible funds in a period from 2000 to 2012. Motivated by Nofsinger and Varma (2014), we intend to examine whether internationally-investing funds outperform the market and matched conventional funds during market turmoil and, therefore, exhibit some crisis insurance. As abnormal returns are model-specific, we apply standard and q-theory based performance measurement models. Our results reveal no outperformance for internationally-investing socially responsible funds. Thus, the U.S.-based findings provided by Nofsinger and Varma (2014) seem not to be transferrable to international markets. However, our internationally-investing funds come from different regions which might explain the deviation from the U.S.-based evidence. To account for biases due to the origin of a fund, we split our sample in funds domiciled in North America, Europe, and Asia-Pacific.
This procedure enables us to provide evidence that solely internationally-investing socially responsible funds domiciled in North America outperform the market and conventional peers in crisis periods, irrespective of the applied performance evaluation model. We suggest that previous U.S.-based evidence is restricted to international funds domiciled in North America. Therefore, our international findings do not support the assumption that firms exhibiting environmental, social, governance, and ethical responsibility are generally more likely to successfully navigate the dynamic challenges of crisis periods (e.g., Nofsinger and Varma, 2014). We discover that this outperformance seems to be owed to the stock-picking abilities of North American fund managers during market turmoil, and therefore encourage the value of active fund management (e.g., Wermers, 2000). In addition, we provide some evidence that North American fund managers might be advantaged by the North American market conditions.
Obviously, our findings have practical impact. We find that the financial performance of internationally-investing socially responsible funds varies around the world which is owed to the quality and abilities of the fund management during different market regimes. Therefore, investors wanting to allocate money in socially responsible funds should consider the current market regime and carefully study the underlying fund management.
6 The results for the European funds remain unchanged. We still find an underperformance of European funds relative to their peers.
References
1. Ammann, M., Odoni, S. and Oesch, D. (2012). An alternative three-factor model for international markets:
Evidence from the European Monetary Union, Journal of Banking & Finance, 36 (7), pp. 1857-1864.
2. Amihud, Y. (2002). Illiquidity and stock returns: cross-section and time-series effects, Journal of Financial Markets, 5 (1), pp. 31-56.
3. Areal, N., Cortez, M.C. and Silva, F. (2013). The conditional performance of US mutual funds over different market regimes: do different types of ethical screens matter? Financial Markets and Portfolio Management, 27 (4), pp. 397-429.
4. Asness, C., Frazzini, A. and Pedersen, L.H. (2013). Quality minus junk. New York University and AQR Capital Management.
5. Becchetti, L., Ciciretti, R., Dalò, A. and Herzel, S. (2015). Socially responsible and conventional investment funds: performance comparison and the global financial crisis, Applied Economics, 47 (25), pp. 2541-2562.
6. Bollen, N.P.B. and Busse, J.A. (2001). On the Timing Ability of Mutual Fund Managers, The Journal of Finance, 56 (3), pp. 1075-1094.
7. Carhart, M.M. (1997). On persistence in mutual fund performance, The Journal of Finance, 52 (1), pp. 57-82.
8. Chen, L., Novy-Marx, R. and Zhang, L. (2010). An alternative three-factor model. Washington University in St.
Louis, University of Chicago and University of Michigan.
9. Fama, E.F. and French, K.R. (1993). Common risk factors in the returns on stocks and bonds, Journal of Financial Economics, 33 (1), pp. 3-56.
10. Ferruz, L., Muñoz, F. and Vargas, M. (2012a). Managerial Abilities: Evidence from Religious Mutual Fund Managers, Journal of Business Ethics, 105 (4), pp. 503-517.
11. Ferruz, L., Muñoz, F. and Vicente, R. (2012b). Effect of Positive Screens on Financial Performance: Evidence from Ethical Mutual Fund Industry. University of Zaragoza.
12. Ferson, W.E. and Schadt, R.W. (1996). Measuring fund strategy and performance in changing economic conditions, The Journal of Finance, 51 (2), pp. 425-461.
13. Girard, E., Rahman, H. and Stone, B. (2007). Socially responsible investments: Goody-two-shoes or bad to the bone? The Journal of Investing, 16 (1), pp. 96-110.
14. Global Sustainable Investment Alliance. (2012). Global Sustainable Investment Review.
15. Glode, V. (2011). Why mutual funds “underperform”, Journal of Financial Economics, 99 (3), pp. 546-559.
16. Gregory, A. and Whittaker, J.M. (2007). Performance and performance persistence of ‘ethical’ unit trusts in the UK, Journal of Business Finance & Accounting, 34 (7‐8), pp. 1327-1344.
17. Kacperczyk, M., van Nieuwerburgh, S. and Veldkamp, L. (2013). Rational attention allocation over the business cycle. DOI: 10.3386/w15450.
18. Kosowski, R. (2011). Do mutual funds perform when it matters most to investors? US mutual fund performance and risk in recessions and expansions, The Quarterly Journal of Finance, 1 (3), pp. 607-664.
19. Kreander, N., Gray, R.H., Power, D.M. and Sinclair, C.D. (2005). Evaluating the performance of ethical and non‐ethical funds: a matched pair analysis, Journal of Business Finance & Accounting, 32 (7‐8), pp. 1465-1493.
20. Leite, P. and Cortez, M.C. (2015). Performance of European socially responsible funds during market crises:
Evidence from France, International Review of Financial Analysis, 40, pp. 132-141.
21. Lesser, K., Rößle, F. and Walkshäusl, C. (2016). Socially responsible, green, and faith-based investment strategies:
Screening activity matters! Finance Research Letters, 16, pp. 171-178.
22. Lu, J. (2005). What is the Wind Behind this Sail? Can Fund Managers Successfully Time Their Investment Styles?
Doctoral dissertation, Cranfield School of Management. The Centre for Financial Research.
23. Lynch, A.W. and Wachter, J. (2007). Does mutual fund performance vary over the business cycle? Working Paper, New York University.
24. Moskowitz, T.J. (2000). Mutual fund performance: An empirical decomposition into stock picking talent, style, transaction costs, and expenses: Discussion, The Journal of Finance, 55 (4), pp. 1695-1703.
25. Muñoz, F., Vargas, M. and Marco, I. (2014). Environmental Mutual Funds: Financial Performance and Managerial Abilities, Journal of Business Ethics, 124 (4), pp. 551-569.
26. Muñoz, F., Vicente, R. and Ferruz, L. (2015). Stock-picking and style-timing abilities: a comparative analysis of conventional and socially responsible mutual funds in the US market, Quantitative Finance, 15 (2), pp. 345-358.
27. Nofsinger, J. and Varma, A. (2014). Socially responsible funds and market crises, Journal of Banking & Finance, 48, pp. 180-193.
28. Renneboog, L., Ter Horst, J. and Zhang, C. (2008a). Socially responsible investments: Institutional aspects, performance, and investor behavior, Journal of Banking & Finance, 32 (9), pp. 1723-1742.
29. Renneboog, L., Ter Horst, J. and Zhang, C. (2008b). The price of ethics and stakeholder governance: The performance of socially responsible mutual funds, Journal of Corporate Finance, 14 (3), pp. 302-322.
30. Renneboog, L., Ter Horst, J. and Zhang, C. (2011). Is ethical money financially smart? Nonfinancial attributes and money flows of socially responsible investment funds, Journal of Financial Intermediation, 20 (4), pp. 562-588.
31. Schröder, M. (2004). The performance of socially responsible investments: investment funds and indices, Financial Markets and Portfolio Management, 18 (2), pp. 122-142.
32. Treynor, J.L. and Mazuy, K.K. (1966). Can mutual funds outguess the market? Harvard Business Review, 44 (4), pp. 131-136.
33. Wang, X. (2010). On time varying mutual fund performance. University of Toronto.
34. Wermers, R. (2000). Mutual fund performance: An empirical decomposition into stock‐picking talent, style, transactions costs, and expenses, The Journal of Finance, 55 (4), pp. 1655-1695.
35. Yu, H.-Y. (2012). Where are the smart investors? New evidence of the smart money effect, Journal of Empirical Finance, 19 (1), pp. 51-64.