Research Collection
Journal Article
Identification of LC-HRMS nontarget signals in groundwater after source related prioritization
Author(s):
Kiefer, Karin; Du, Letian; Singer, Heinz; Hollender, Juliane Publication Date:
2021-05-15 Permanent Link:
https://doi.org/10.3929/ethz-b-000477346
Originally published in:
Water Research 196, http://doi.org/10.1016/j.watres.2021.116994
Rights / License:
Creative Commons Attribution-NonCommercial-NoDerivatives 4.0 International
This page was generated automatically upon download from the ETH Zurich Research Collection. For more information please consult the Terms of use.
ETH Library
ContentslistsavailableatScienceDirect
Water Research
journalhomepage:www.elsevier.com/locate/watres
Identification of LC-HRMS nontarget signals in groundwater after source related prioritization
Karin Kiefer
a,b, Letian Du
a,b, Heinz Singer
a, Juliane Hollender
a,b,∗aEawag, Swiss Federal Institute of Aquatic Science and Technology, 8600 Dübendorf, Switzerland
bInstitute of Biogeochemistry and Pollutant Dynamics, ETH Zurich, 8092 Zurich, Switzerland
a rt i c l e i nf o
Article history:
Received 25 November 2020 Revised 26 February 2021 Accepted 28 February 2021 Available online 2 March 2021 Keywords:
Target screening Nontarget screening Micropollutant
Persistent and mobile compounds PMOC
AcquireX
a b s t r a c t
Groundwaterisamajordrinkingwater resourcebutitsqualitywithregardtoorganicmicropollutants (MPs) isinsufficiently assessed.Therefore, we aimedto investigateSwiss groundwater morecompre- hensivelyusingliquidchromatographyhigh-resolutiontandemmassspectrometry(LC-HRMS/MS).First, samples from60 sites wereclassifiedashaving highorlow urban oragriculturalinfluence basedon 498 targetcompounds associated witheither urban oragricultural sources.Second, all LC-HRMSsig- nalswererelatedtotheirpotentialorigin(urban,urbanandagricultural,agricultural,ornotclassifiable) basedontheiroccurrenceandintensityintheclassifiedsamples.Aconsiderablefractionofestimated concentrationsassociatedwithurbanand/oragriculturalsourcescouldnotbeexplainedbythe139de- tectedtargets.Themostintensenontargetsignalswereautomaticallyannotatedwithstructureproposals usingMetFragandSIRIUS4/CSI:FingerIDwithalistof>988,000compounds.Additionally,suspectscreen- ingwasperformedfor1162compoundswithpredictedhighgroundwatermobilityfromprimarilyurban sources.Finally,12nontargetsand11suspectswereidentifiedunequivocally(Level1),while17further compoundsweretentativelyidentified(Level2a/3). amongstthesewere13pollutantsthusfarnot re- portedingroundwater,suchas:theindustrialchemicals2,5-dichlorobenzenesulfonicacid(19detections, upto100 ng L−1), phenylphosponicacid (10detections,upto50 ng L−1), triisopropanolamine borate (2detections,upto40ngL−1),O-des[2-aminoethyl]-O-carboxymethyldehydroamlodipine,atransforma- tionproduct(TP)ofthebloodpressureregulatoramlodipine(17detections),andtheTPSYN542490of theherbicidemetolachlor(Level3,33detections,estimatedconcentrationsupto100–500ngL−1).One monitoringsitewasfarmorecontaminatedthanothersitesbasedonestimatedtotalconcentrationsof potentialMPs,whichwassupportedbytheelucidationofsite-specificnontargetsignalssuchasthecar- cinogenchlorendicacid,andvariousnaphthalenedisulfonicacids.Manycompoundsremainedunknown, butoverall,sourcerelatedprioritisationprovedaneffectiveapproachtosupportidentificationofcom- poundsingroundwater.
© 2021TheAuthor(s).PublishedbyElsevierLtd.
ThisisanopenaccessarticleundertheCCBY-NC-NDlicense (http://creativecommons.org/licenses/by-nc-nd/4.0/)
1. Introduction
Groundwater is a major drinking water resource and there- fore its quality is of high interest. Various micropollutants (MPs) fromagriculture, households,orindustry,entering aquifers via different pathways, affect groundwater quality (Loos et al., 2010). Whereas pesticides are applied in high amounts to agri- cultural soils (Pimentel 2009) and then enter aquifers mainly via seepage, pharmaceuticals, household and industrial chem- icals may contaminate aquifers predominantly via leaky sew-
∗Corresponding author.
E-mail address: juliane.hollender@eawag.ch (J. Hollender).
ers (Wolf et al., 2012) or via bank filtration from wastewater impacted surface waters (Heberer et al., 2004). Consequently, the land use in the catchment and/or hydrogeological setting (e.g. bank filtration, characteristics of top layers) influence the MP pattern at the groundwater monitoring site (Stuart et al., 2014; Ter Laak et al., 2012). Given that (i) >350,000 chemi- cals, and mixtures thereof, are registered in national and re- gional inventories (Wang et al., 2020), (ii) compounds undergo transformations in the environment and engineered systems (Kolpin et al., 2009), and (iii) “new” MPs are regularly reported to be in the water cycle, e.g. Weber et al. (2007), Schmidt and Brauch (2008), Reemtsma et al. (2013), Schlüsener et al. (2015), Zahnetal.(2016),Gago-Ferreroetal.(2018),Schulzeetal.(2019),
https://doi.org/10.1016/j.watres.2021.116994
0043-1354/© 2021 The Author(s). Published by Elsevier Ltd. This is an open access article under the CC BY-NC-ND license ( http://creativecommons.org/licenses/by-nc-nd/4.0/ )
orZahnetal.(2019),itseemsinsufficienttoevaluatewaterquality onlyonthebasisofselectedanalytes.
Liquidchromatographyhigh-resolutiontandemmassspectrom- etry(LC-HRMS/MS)enablesthedetectionofpossiblythousandsof smallmoleculesinawatersample,bothfromnaturalandanthro- pogenic sources. Some of thesecompounds can be elucidatedby broad-scopetarget screeningwherereferencestandardsareavail- able in the laboratory, while others are detected as part of sus- pectscreening,i.e.searchingforspecificstructureswithouthaving referencematerial athand (Krauss etal., 2010). However, usually mostLC-HRMS/MSsignalsremainunknown(so-callednontargets), and should therefore be further investigated. Spectral libraries such asthe EuropeanMassBank (Horai etal., 2010), MassBank of NorthAmerica(MoNA;http://mona.fiehnlab.ucdavis.edu/),andmz- Cloud (www.mzcloud.org) allow structural annotation of nontar- get signalswithhighconfidence level(Schymanski etal., 2014b), though theiruseislimitedtocompoundsforwhichMS/MSspec- traweremadeaccessiblebyotherlaboratories.Forcompoundsnot presentinspectrallibraries,insilicofragmentationtools,e.g.Met- Frag (Ruttkies et al., 2016), SIRIUS4/CSI:FingerID (Dührkop et al., 2015; Dührkop et al., 2019), and CFM-ID (Allen et al., 2014), in combination with large chemical compound databases such as PubChem (Kim et al., 2019), CompTox Chemistry Dashboard (Williams et al., 2017), or the NORMAN Suspect List Exchange (www.norman-network.com/nds/SLE) are promising alternatives for structuralannotation.These toolsenablethe high-throughput annotation of thousandsof nontargets,however, withoften hun- dreds oreven thousandsof candidates.Thus, the final identifica- tionwithreferencematerialremainsamajorbottlenecksothatso faronlyfewnontargetshavebeenelucidatedwithhighconfidence inwatersamples(Albergamoetal.,2019;Gago-Ferreroetal.,2015; Schymanskietal.,2014a;Tianetal.,2020).
As a consequence, nontargets of interest need to be priori- tized before investing time and resources into structure elucida- tion or even purchasing referencematerial, using one or a com- bination of several approaches depending on the study context.
Moststudiesapplyfiltersforanalyticalqualitycontrol,e.g.exclud- ing compounds detected in proceduralblanks andincludingonly compoundswithhighreproducibilityinreplicateandpooledsam- ples (Broadhurst et al., 2018; Sangster et al., 2006). The use of pooled samples (i.e. samples comprising aliquots of all samples) is morecommoninmetabolomicsthan inenvironmentalstudies.
Intensityis acrucialparameter inmoststudies (Hugetal., 2014; Schymanski et al., 2014a), asintense signals mayprovidehigher- quality MS/MS datasupporting elucidation.Additionally,intensity correlates tosome extent withconcentration,though itis impor- tanttohighlightthathighintensityorconcentrationdoesnotnec- essarily meanhightoxicological risk. Furthermore,Cl andBr iso- tope patterns may point to compounds from anthropogenic ori- gins (Chiaia-Hernandez etal., 2014; Huget al., 2014) and homo- loguesto larger groupsofrelatedcompounds such assurfactants (Schymanskietal.,2014a).Comparingrelatedsamplessuchasraw water andfinal drinking water (Müller etal., 2011) or road dust andsurfacewater (Seiwertetal., 2020) facilitateprioritization of persistentsignalsoriginatingfromaspecificsource.Inthisregard, multivariate statisticaltoolssuch asprincipal componentanalysis andhierarchicalclusteringcanbeapplied,forexampletosamples collectedalongawastewatertreatmentplant(Scholléeetal.,2015; Schollée et al., 2018) or a riverbank transect (Albergamo et al., 2019),todeterminenontargetswithspecifictrends.
The goal of this study was to comprehensively evaluate the quality ofwaterderived from60groundwater monitoringsitesin Switzerland.Todoso,alldetectedLC-HRMSsignalsweretobere- lated to their potential sources (urban, agricultural), followed by structuralelucidationofthemostprominentones,focusinginpar- ticular onpotential MPs fromurban sources. Ourhypothesis was
thatbycombininganappropriatenontargetprioritizationstrategy withahighlyautomatedstructureelucidationworkflow,wewould find previously unreported compounds in groundwater. First, we performed an extensive target screening for 498 MPs to classify thesamplesaccordingto theirdominatingurban andagricultural pollutants.Next,allLC-HRMSsignalswereclassifiedbasedontheir pre-dominatingoccurrenceinurbanoragriculturalsources,which was assessed by comparing samples with highvs. low urban or highvs.lowagriculturalinfluence.Structureelucidationfocusedon nontargetsfrompotentiallyurbansourcesbecauseweinvestigated already in detail major agricultural MPs, i.e. pesticides andtheir transformationproducts(TPs),inasimilarsampleset(Kieferetal., 2019).Accordingly,mostintensenontargetsfrompotentiallyurban sources and, in addition widespread nontargets, were annotated withcandidate proposalsusing MetFragand SIRIUS4/CSI:FingerID and finally elucidated with reference standards, if commercially available.Tonot overlookimportanturban MPswithlowersignal intensity,weappliedadditionallyasuspectscreeningfor1162po- lar,andthereforemobile,compoundsfrommainlyurbansources.
2. Methods
2.1. Groundwatersamples
The applied nontarget screening approach aimed to classify nontargetswithregardstotheirorigin(urban,agricultural),based on their occurrence at monitoring sites that are i) urban im- pacted, ii) agriculturally impacted, or iii) show only low an- thropogenic impact. Therefore, 60 monitoring sites (44 abstrac- tion wells, 16 springs) were selected out of >500 sites from the Swiss National Groundwater Monitoring NAQUA (www.bafu.
admin.ch/naqua) based on long-term monitoring data collected within NAQUA.Twenty sites containedMPs frompre-dominantly urban sources(pharmaceuticals,sweeteners), while20other sites showedhighfrequencyorconcentrationsofMPsfromagricultural sources (pesticides and their TPs). A further 20 sites exhibited comparably low anthropogenic contamination. Severalsites were notclearlyclassifiableasurban-oragriculturally–impacteddueto theoccurrenceofpollutantsfrombothsourcetypes.
The60groundwatersampleswerecollectedinlaboratoryglass bottles(previously annealed at500 °C; 1 L bottles, SIMAX Kava- lier, Czech Republic) in Mayand August2018 within the routine sampling of NAQUA. Samples were stored cooled for up to four weeksandthen frozenat−20°Cuntil measurement.For quality control, pooledsamples were prepared,i.e.samples consistingof anequalamountofeachsample.Forthis,aliquots(5or10mL)of eachgroundwatersampleweretransferredtolaboratoryglassbot- tles(0.5 L or1L) using a 5mL brownglass vialbefore samples were frozen. To determine contaminations from sampling, sam- ple storage or handling, ultrapure water (>18 Mcm, Barnstead NanopureDiamondsystem)wasfilledintolaboratoryglassbottles, transferredduringsamplingintoanotherbottle(atfivemonitoring sites), andthenstored andprocessedanalogouslyto theground- watersamplesasblanksamples.
2.2. Samplepreparationviavacuum-assistedevaporation
Toavoidlossesofpolarcompoundsduringsampleenrichment, sampleswereconcentratedviavacuum-assistedevaporation,anal- ogouslytoMechelkeetal.(2019)thoughwithslightmodifications.
Samples were transferred to BÜCHI glass vials (1 mL appendix, previouslyannealedat450°C)ata volumeof120mLandspiked with35isotope-labelledinternalstandardsat100ngL−1.Samples were evaporated on a Syncore® Analyst(BÜCHI,Switzerland) for 7–8 h to approximately 1 mL at 20 mbar and 45 °C (appendix
cooled at7–10°C)usingtheback-flushunit. Theconcentratevol- umewasadjustedto 1.6mLbyaddingultrapure waterusingan- nealedglassPasteurpipettes(747715,BrandGmbH,Germany).The BÜCHI vials were rinsed thoroughly with the concentrate to re- duce analyte losses dueto sorption. Finally, the concentrate was centrifugedat3720g(HeraeusMegafuge1.0R,ThermoFisherSci- entific,U.S.)inannealedvialsandtransferredto1.5mLvials(pre- viouslyannealedat500°C;vials:080400-XL;screwcaps:090301;
BGBAnalytik, Switzerland).Analogouslytothesamples,fourcali- brationstandards(1,10,100,1000ngL−1 inultrapurewater),four spiked samples (1, 10, 100, 250 ngL−1), sixpooled samples (i.e.
replicates)andsevenfieldandlaboratoryblanksamples(ultrapure water spiked with internal standards) were prepared for quality controlandtargetquantification.Fordetailsonspikesolutions,see SI-A1.
2.3. LC-HRMS/MSanalysis
Samplesweremeasuredintriplicateinarandomizedorder.Af- ter ninesampleinjections(threetriplicates),ablankwasinjected, followedbyapooledsampleforqualitycontrol.Theconcentrated samples(140μL,i.e.10.5mLoftheoriginalsample)wereinjected to aLC systemconsistingofa PALRTC autosampler(CTC Analyt- ics, Switzerland),areversed phaseC18column(AtlantisT3,3μm, 3 × 150 mm; Waters, Ireland), and a Dionex UltiMate 3000 RS pump (Thermo Fisher Scientific RS). The gradient elution started with 100%water (containing 0.1% formicacid) to achieve an op- timal retention of polar compounds. Then, methanol (containing 0.1% formic acid) was added and increased to 95% from 1.5 to 18.5min,andfinally keptconstantfor10 min.The flowratewas 0.3mLmin−1.Fordetails,seeTableSI-A1.
Analytes were ionized in electrospray (3.5/−2.5 kV) and de- tected on an Orbitrap mass spectrometer (Fusion Lumos,Thermo Fisher Scientific,U.S.) witharesolutionR of240,000(atm/z 200, fullwidthathalfmaximum(FWHM))inMS1full-scanmode(m/z 100–1000), followedbythreetofourdata-dependantMS/MSfull- scans(high-resolutionproductscans;R30,000FWHMatm/z200;
cycletime1s;isolationwindowofprecursor1m/z).Internalcali- bration(EASY-ICTM)ensuredamassaccuracyof<±2ppminMS1 scans for 99.8% of detected target compound peaks and internal standard peaks(<±1ppm for98.4%ofpeaks).AcquireX software (Deep Scan; Thermo Fisher Scientific, U.S.) was used to increase MS/MS coverage. In the first triplicate injection, data-dependant MS/MS full-scans were triggered based on a mass list contain- ingtargetcompounds.Then,AcquireXperformedpeakpickingand added detectedfeatures (m/z andretentiontime)tothemass list so that inthe second triplicateinjection, data-dependant MS/MS full-scans were triggered based onthe masslist modifiedby Ac- quireX. Before the third injection, AcquireX shifted features, for which MS/MSscans were alreadyacquiredduringthe second in- jection,fromthemassto theexclusionlistso thatthesefeatures were not triggered again. Ifno features fromthe mass list were detected, the MS/MS scansforthe mostintense signals were ac- quired.Triggered features were excluded dynamically for3s. For details,seeSI-A2.
2.4. Targetscreening
Foreach target compound, extractedionchromatogramswere plottedwiththe MSnbase R package(GattoandLilley,2012) and visuallyinspected.Ifthetargetcompoundwasdetectedinground- water samples, the concentration was determined using Trace Finder 4.1(Thermo Fisher Scientific,U.S.) basedon thepeak area ratio of the target compound to that of corresponding internal standard.Ifnostructurallyidenticalisotope-labelledinternalstan- dardwasavailable,aninternalstandardwasselectedwithsimilar
retentiontime asthe analyte andresultingin a relativerecovery close to 100% in the spiked samples using an in-house R script (Schollée, 2018).Fordetails ontarget quantificationincluding de- terminationoflimitofquantification(LOQ),seeSI-A3.
2.5. Suspectandnontargetscreening
Measurement files were converted to mzXML format using MSConvert3.0,ProteoWizard(Chambersetal.,2012)andthenpro- cessed in the enviMass workflow (envibee GmbH, Switzerland).
Datapost-processingwasconductedintheRenvironment,version 3.6.3(RCoreTeam,2020).
2.5.1. Datapre-processing
Data pre-processingwas performedusingthe enviMass work- flow (version 4.2633) including peak picking, mass recalibration, retention time alignment, intensity normalization based on me- dian intensityof internal standards, replicate filtering,andtarget and suspect annotation. Features, i.e.chromatographic peaks de- fined by their m/z and retention time, that likely resulted from thesamecompound(adducts,isotopologues)weregroupedintoso calledcomponentsbasedonintensitycorrelationandm/zdistance.
Themostintensefeaturewithinacomponentwasusedforfurther dataanalysis.Settings(e.g.m/zandretentiontimetolerances)were optimized until 87% of target peaks (detected with Trace Finder 4.1,Section2.4)werefound.62%oftargetpeaksthatwerenotde- tectedwere<10ngL−1 orexceeded theLOQ(Section2.4) byless than factor5; other non-detectswere mostlyrelatedto large re- tentiontimeshifts(i.e.exceeding theretentiontimetolerancefor targets)orpoorpeakshape.Forfinalsettings,seeSI-A4.
Finally,a tablecontainingthe peakheight intensitypatternof each component across the samples (so-called profiles) was ex- ported.Profileswereprioritizedforfurtherinspectionbyexcluding thosewitha retentiontime <3min,average sample/blankinten- sityratio<5,andmaximumpeakintensity<106.Forcomparison, apeak heightintensityof106correspondedtoa concentrationof
≥10 ngL−1 for approximately90% of targets ionizing in positive ionizationmodeand35%oftargetsionizing innegativeionization mode.
It should be noted that forsome compounds severalcompo- nentsmightexist (e.g.positive andnegativeionization, in-source fragments). Moreover, for some target compounds, two or three profiles were observed, often related to shifting retention times or peak picking artefacts. Therefore, profiles differing in m/z by
<2ppmandretentiontime<30sweregroupedusinganin-house R function (Schollée etal., in preparation). Peak intensities were averagedacrossreplicates.
2.5.2. Prioritizationofprofilesusingsampleclassification
To classify nontarget compounds according to their potential origin (urban,agricultural), groundwater sampleswere first clas- sified based on the sum concentration of 269 targets from pre- dominantlyurban origin(pharmaceuticalsandtheir TPs,sweeten- ers,industrialchemicals,biocides,illicitdrugs,personalcareprod- ucts,andothers,SI-B1) and229targetsfrompredominantlyagri- culturalorigin(pesticides andtheir TPs,SI-B1).Sampleswere de- fined ashavinghigh urban influenceifthe sumconcentration of urban targetswas>100 ngL−1; otherwise,they were definedas samples with low urban influence. Likewise, samples for which thesumconcentrationofagriculturaltargetsexceeded100ngL−1 weredefinedashavinghighagriculturalinfluence,andotherwise ashavinglowagriculturalinfluence.Thecut-off of100ngL−1was guidedbytheEuropeanUnion’sdrinkingwaterstandardforsingle pesticidesandrelevantpesticideTPs(EuropeanCommission,1998).
The sum concentration (instead of concentrations of singlecom-
pounds) wasusedsothattheclassificationdependednotonlyon singletargetswithhighconcentrations.
Next, the ratio of a compound’s average intensityin samples withhighurban/agriculturalinfluencetothat ofitsaverageinten- sity in samples with low urban/agricultural influence was calcu- latedasameasureforthelikelihoodthatthecompoundoriginated fromurbansourcesoragriculturalsources,respectively:
Measurefor
urban origin=averageintensityinsampleswithhighurbaninfluence
averageintensityin sampleswithlowurbaninfluence (1)
Measurefor
agriculturalorigin= averageintensityinsampleswithhighagriculturalinfluence
averageintensityin sampleswithlowagriculturalinfluence (2)
Ifthecompoundwasnotdetectedinoneofthesamplegroups, it was assumed that the compound was detected in one sam- plewiththeminimumintensityobservedinthewhole datasetto avoiddividingby0.
Profileswereclassifiedasfollows:
• potentialurbanMP:measureforurban origin>5andmeasure foragriculturalorigin≤5,
• potential agricultural MP: measure for urban origin ≤5 and measureforagriculturalorigin>5,
• potential urbanandagriculturalMP: measureforurban origin
>5andmeasureforagriculturalorigin>5,
• notclassifiable:remainingprofiles.
Here, the decision to use a factor of five as threshold was guided by profiles annotated as target compounds, i.e. >80% of profiles of urban targets and>90% of profiles ofagricultural tar- gets,respectively,showedonaveragemorethanfivetimeshigher intensities in samples with high urban/agricultural influence vs.
sampleswithlowurban/agricultural influence.However,itshould bepointedoutthatsometargetcompounds,whichwouldbeclas- sifiedas“potentialurbanandagriculturalMP”,likelyoriginateonly fromurbansources(e.g.x-raycontrastagentdiatrizoicacid).
Togather moreinformationonpotential sources, themostin- tense profiles in each group (urban, urban/agricultural, agricul- tural profiles withmaximum intensity>5× 10⁶; not classifiable profiles withmaximum intensity>107 and≥30detections) were retrospectively screened for in the effluent of two Swiss munic- ipal wastewater treatment plants (24 h composite samples, dry- weather conditions). Forthis, extractedionchromatograms(EICs) were generated forblank andeffluentsamples, measured witha comparable method (without enrichment), using the R package MSnbase (Gatto andLilley,2012).TheEICswere thencheckedfor peakswithintensity>105anddeviating<1minfromtheaverage retentiontimeofthecorrespondingprofiles(SI-C2).
Total concentrationsin each samplewere estimated assuming thatthecompoundsionizeeitherlessefficientlythan,asefficiently as,ormoreefficientlythanthe113targetscompounds(92inpos- itiveionizationmode,21innegativeionizationmode)spikedinto groundwatersamples(1,10,100,250ngL−1).Here“lessefficiently than”,”asefficientlyas”,and”moreefficientlythan” correspondto the25th,50thand75thpercentileoftargetcompoundpeakinten- sities.Fordetails,seeSI-A5.
2.5.3. Elucidationofsuspectsandnontargets
Nontargets: Structural elucidation of nontargets focused on profiles that were classified aspotentially ofurban or urban and agricultural origin and that had maximum intensity >5 × 10⁶, and on all profiles that had maximum intensity >107 and ≥30 detections. For each profile, MS1 and MS/MS data were ex- tracted from the sample with highest precursor intensity using the RMassBank package (Stravs et al., 2013). Structural propos- als were then assignedusing both MetFrag CL 2.4.5 (using func- tions from the R package ReSOLUTION, Schymanski (2020)) and
SIRIUS4/CSI:FingerID. Both in silico fragmenters were used with a list of >988,000 compounds of potential environmental rele- vance,includingthoseinCompTox(Schymanski, 2019),PubChem- Lite tier1 (Bolton and Schymanski, 2020), NORMAN SusDat (Nor- manNetworket al., 2020), STOFF-IDENT (Letzel etal., 2017), the original dataset used for UBAPMT (Arp and Hale, 2020), i.e. Ex-
tended PMT (H.-P. Arp and S.E. Hale, personal communication), SwissPest19 (Kieferetal., 2020b), aswell as71additionalpoten- tiallymobilepesticidetransformationproducts(T.Poiger,personal communication).Fordetails,seeSI-A6.
Nontargets were prioritized for confirmation based on multi- plelines ofevidence asinthe following:(i) a positive hit inthe MS/MSlibrariesNIST17 (NationalInstitute ofStandardsandTech- nology, U.S. Department of Commerce), MoNA (LC-MS/MS spec- tra obtainedfrom https://mona.fiehnlab.ucdavis.edu/downloads in December 2019) orMassBank (obtainedfrom https://github.com/
MassBank/MassBank-datainDecember2019)usingtheNISTMass SpectralSearchProgram(version2.3)orinmzCloud(selectedhits manuallychecked),(ii)performanceofinsilicofragmentation,(iii) peakshape, (iv)intensityanddetectionfrequency, (v)plausibility ofretentiontime,and(vi)availabilityofreferencematerial.
Suspects: The suspect list comprised 1162 MS-ready struc- tures,allwithheteroatomsandexactmasses>100,andwascom- piledfromSchulzeetal.(2019),KEMI MarketList (Fischer, 2017), UBAPMT(ArpandHale,2020), andExtendedPMT(H.-P.Arpand S.E.Hale,personalcommunication).TheExtendedPMTdatasetwas filteredforcompoundsclassifiedasvery mobile(vM) and“highly expected in the environment” (H.-P. Arp, personal communica- tion,e.g. dueto highproductionvolumes).The KEMIMarket List, containing>25,000 chemicalsthat are expectedon the EU mar- ket(e.g.industrialchemicals,pharmaceuticals,pesticides),wasre- strictedtocompounds thataremorelikelytooccur ingroundwa- ter.Therefore,onlycompoundswereselectedthatexhibitedahigh waterexposure index(>15; water exposure indexranges from1 to 27)and were classifiedas(potentially) mobile or very mobile (potM/vM, M/vM,or vM)based on speciation andlogDOW (pre- dicted byJChemforOffice, version 19.22.0.548;ChemAxon Ltd.)), asdescribedbyArpandHale(2019).
Profiles annotated with the suspect list by enviMass (Section 2.5.1) were prioritized in a similar workflow as non- target profiles. MetFrag and SIRIUS4/CSI:FingerID were run using both the suspect list and PubChemLite tier1 (Bolton and Schy- manski, 2020) as databases to check how well the measured MS/MSspectrumfitstothesuspect comparedtoother candidates (SI-A6). Only suspects ranked amongst the top 3 candidates of SIRIUS4/CSI:FingerID were checked manually, as described for nontargets.
Prioritized suspects and nontargets were classified, in accor- dance with Schymanski et al. (2014b), (i) as confirmed struc- tures where referencematerial was available for identity confir- mation (Level 1), (ii) as probablestructures wherean MS/MS li- brarymatchwasachieved(Level2a)or(iii)astentativestructures wheretentativeidentificationswere basedsolelyonMS/MSinter- pretation(Level3).TheannotationofMS/MSfragmentswithstruc- turalproposalsfortentativelyidentifiedcompoundswassupported by CFM-ID3.0. Level 1 candidateswere identified andquantified asfollows.Ten selectedsampleswere enriched andmeasured to- getherwithfourcalibrationstandards(1,10,100,1000ngL−1)and
Fig. 1. Classification of samples according to the concentration sums of urban and agricultural targets. Dashed lines mark the threshold of 100 ng L −1used for classifi- cation. Size of circles correlates with number of detected targets (1–74 per sample).
Axes are log-scaled.
sixspiked samples(100,250,1000ngL−1) withadjustedMS/MS settings.Thedeterminedcalibrationmodelwasappliedtothepre- viously measuredsamples forquantification.The qualityofquan- tification wasevaluated foreach compound basedon relativere- coveries in spiked samples and the reproducibility of concentra- tions inthesamples,whichwereeachmeasuredtwice.Notevery compoundcouldbequantifiedsatisfactorilysothatinsomecases, eitherconcentrationrangesornoconcentrationsarereported.Fur- ther details regarding structural confirmation, quantification and associatedMS/MSspectracanbefoundinSI-A7,SI-A12,andSI-B4, respectively.
3. Resultsanddiscussion
3.1. Sampleclassificationbasedontargets
The extent of urban and/or agricultural influence on the 60 groundwater monitoring sites was evaluated based on the sum concentrationof269urbanand229agriculturaltargetcompounds (for concentrationsofindividual targetsseeSI-B1, andfortargets withdetections≥100ngL−1seeTableSI-A7).Accordingly,17sites showed only low urban and agriculturalinfluence, 18 sites were predominantlyinfluencedbyagriculturaltargets,22siteswerein- fluenced by agricultural and urban targets and three sites were predominantly impacted by urban targets (Fig. 1). These classifi- cations,whichwerebasedontheherepresentedtargetscreening, wereconsistentwithclassificationsbasedonlong-termmonitoring data for53out of60monitoring sites(fordetails see SI-A8).For most monitoring sites the classification was also consistent with thelanduseofthecatchment,i.e.siteswithhighurbaninfluence wereoftenclosetosettlementsortowastewaterimpactedsurface waters(bankfiltration),siteswithhighagriculturalinfluencewere usuallyinareaswithintensiveagriculturallanduse,andthecatch- mentsofsiteswithlowurbanandagriculturalinfluencewereusu- allydominatedbygrasslandorforest.
Urban classification wasprimarily associated with the sweet- eneracesulfame,the biocideTP N,N-dimethylsulfamide(mayalso originate from the banned plant protection product tolylfluanid), theindustrialchemicalmelamine,andthecorrosioninhibitorben- zotriazole,i.e.ifoneofthesetargetsisremovedfromthedataset, then twoto fivesitesare nolongerclassifiedashaving“highur- ban influence” or “highurban andagriculturalinfluence” (Fig.1).
Analogously,theagriculturalclassificationwasmostdrivenbyaTP ofthefungicidechlorothalonil(R471811), whichwastheonlytar- get compounddetected in each sample(maximum concentration 2200ngL−1; Kieferetal.(2020a)). Forfurtherdetails, seeFigure SI-A2. Ifsamples were classifiedbased ondetection frequencyof urban oragriculturaltargets, usingacut-off of e.g. 10detections, then44 siteswouldbe classifiedinthesameway(FigureSI-A3).
Hereitshouldbenotedthat somepesticidesmayalsobe usedas biocides(e.g.N,N-dimethylsulfamide(TP),triazine herbicides)and somepharmaceuticalsarealsousedasveterinarydrugs.Therefore, these targetsmay be related to urban and agricultural activities, potentiallyresultinginawrongclassificationofsomesites.
3.2. Classificationofnontargets
Inthe 60 groundwater samples,6504intensity profiles across samples (hereafter ”compounds”) were detected with maximum intensity >106 (Table 1), including 4800 nontargets and 98 tar- gets inpositive ionizationmode and1573 nontargetsand33tar- getsinnegativeionizationmode.Thetotalnumberofcompounds waslikelyslightlylower,duetoambiguitiesthatariseduringcom- ponentisation of isotopologues and adducts, e.g. ten target com- pounds were associated withseveral profiles. Furthermore,some compoundsmightbedetectedinbothionizationmodes,suchas15 targetcompounds.Ofthe6373nontargets,4027(63%)werefound inlessthanfiveoutofsixpooledsamplereplicatesortheintensity showedarelative standarddeviationof>50%(in pooledsamples withdetections,seeTable1),indicatingthateithertheconcentra- tion wastoo low to be reproducibly detected (potentiallydue to dilutionduringmixingofsamplealiquots)orthatthepeak shape wasnotreproducible.Moreover,for296compounds,themaximum intensityin the pooledsamples waseven higher than themaxi- mum intensity inthe groundwater samples. Thismay be related tocontaminationduringsamplehandlingorpeakpickingartefacts (e.g.noise).
Fromthe6373nontargets,331(5%)wereclassifiedaspotential urbanMPs,945(15%)aspotentialagriculturalMPs,and1892(30%) aspotentialMPsfromurbanandagriculturalsources.Theremain- ing3205(50%)couldnot beassignedtooneofthesegroups(not classifiable)andmight becompounds of naturalorigins(Table1, Fig. 2). Morethan 90% of profiles annotatedas target compound wereclassifiedcorrectly,whichwasexpectedbecauseclassification criteria(>5timeshigherintensityincontaminatedsamples)were guidedbythetargetcompounds.
The“not classifiable” targetcompounds (centreofFig.2)were unclassified due to one or more of the following reasons: (i) a compound was incorrectly annotated (different compound with similarretentiontime);(ii)acompoundhadanoisyEIC,resulting in toomany detectionsby enviMass;(iii)a compound originates frommultiplesources(thesweetenersaccharinmayoriginatefrom wastewaterorfrompigmanure(Buergeetal.,2011)andcanthere- fore occur at lesscontaminated sites); (iv) a compound was de- tected inonlyone samplewithlow urban andagricultural influ- ence (site-specific); (v) a compound had shifting retention time andwasthereforenotcorrectlygrouped;(vi)compoundsthathave probablybeenspreadubiquitously,such asbanned triazinepesti- cides andtheir TPs; and (vii)a compound elutedvery early and wasthereforeaffectedbyionsuppression.Thisearly-elutingcom- pound wasmelamine,an industrialchemical andTP ofthelarvi- cidecyromazine,which isoftenapplied tomanure(ECHA,2015).
Basedon concentrations(determinedwithastructurallyidentical internal standard), melamine would be correctlyclassified asan MPfromurbanandagriculturalsources.Thiscompoundwas,how- ever,hardlyretainedbytheapplied chromatographicmethod(re- tentiontime3.4min),elutingtogetherwithsaltsandotherhighly polar compounds, leading to strong ion suppression effects and,
Table 1
Classification of target and nontarget compounds as well as characterisation of nontarget compounds regarding maximum inten- sity, retention time, and detections in the 60 groundwater samples. Numbers in brackets correspond to the percentage of profiles that are less relevant for structure elucidation (e.g. false positives): (i) profiles with early retention time (3–4 min, i.e. salts and very polar compounds), (ii) profiles, for which a very broad ( > 5 min) peak shape is likely (i.e. if > 2 profiles with retention time
> 10 min were grouped; potential natural organic matter (NOM), see SI-A9 for explanation), or (iii) profiles, for which the max-
imum intensity in the pooled samples was higher than the maximum intensity in the samples. The category “reproducible in pooled samples” provides the number of nontargets detected in at least five out of six pooled sample replicates with relative standard deviation < 50% (calculated in pooled samples with detections).
Urban Urban and Agricultural Agricultural Not Classifiable Total All Compounds 345 (26%) 1929 (8%) 1013 (21%) 3217 (48%) 6504 (30%) Targets
Urban Targets 14 (0%) 21 (0%) 1 (0%) 6 (17%) 42 (2%)
Agricultural Targets 0 16 (0%) 67 (1%) 6 (0%) 89 (1%)
Nontargets
Total (without Targets) 331 (27%) 1892 (8%) 945 (22%) 3205 (48%) 6373 (31%) Retention Time < 4 min 68 (100%) 81 (100%) 140 (100%) 1127 (100%) 1416 (100%) Reproducible in Pooled Samples 122 (20%) 517 (9%) 318 (19%) 1389 (43%) 2346 (31%)
Potential NOM 9 (100%) 34 (100%) 44 (100%) 244 (100%) 327 (100%)
Intensity > 5 ×10 6 56 (38%) 323 (12%) 86 (24%) 394 (72%) 859 (42%) Intensity > 10 7 21 (19%) 156 (15%) 30 (30%) 191 (76%) 398 (46%)
Intensity > 5 ×10 7 2 (0%) 11 (0%) 3 (33%) 38 (82%) 54 (59%)
≥30 Detections 10 (40%) 24 (17%) 51 (24%) 862 (44%) 947 (43%) Intensity > 10 7& ≥30 Detections 6 (33%) 12 (25%) 14 (21%) 97 (86%) 129 (71%) Intensity > 10 7& < 30 Detections 15 (13%) 144 (14%) 16 (38%) 94 (67%) 269 (34%) Site-specific (1 Detection) 23 (17%) 727 (6%) 110 (39%) 106 (65%) 873 (16%)
Fig. 2. Compounds were classified based on their occurrence and intensity in sam- ples with urban or agricultural influence. Each circle represents one compound; size of circle correlates with detection frequency in samples (1–60). Compounds to the right of/above the blue/red lines (log 10(5)) show, on average, more than five times higher intensities in samples with high urban/agricultural influence than in samples with low urban/agricultural influence. Compounds on the diagonals are artefacts re- sulting from the replacement of non-detects with the minimum intensity observed across the whole dataset (see Section 2.5.2 ).
in turn,low intensity(which isusedforautomatic classification), whichhamperedproperclassification.Intotal,20%ofalldetected compoundselutedbetween3and4min.Halfofthesecompounds are located in thecentre ofFig.2, indicating eithertheir ubiqui- tous occurrenceor their possiblemisclassification, asin the case ofmelamine.
In addition, many compounds with broad late-eluting peaks, positive mass defect values and higher m/z were located in the
centreof Fig.2.Many were assignedaspotential naturalorganic matter and occurred either at each site or were randomly dis- tributed(seeSI-A9fordetails;Table1).
Further characterization and elucidation focused on the more intense compounds classifiedaspotential MPs fromurban or ur- ban andagricultural sources (maximum intensity>5 × 10⁶) and themostprominentcompoundsfromtheremainingdataset(>107,
≥30 detections). From the resulting 488 compounds in the pos- itive and negative mode (SI-B2), 480 compounds had at least oneMS/MSspectrum,demonstratingtheeffectivenessofAcquireX (Section 2.3). AcquireXincreasedthe MS/MScoverageforthe488 nontargetsby39% (forsuspectsan increaseof73%wasobserved;
detailed discussion in SI-A10). Overall, 409 compounds were an- notated withbetween1 and576candidate proposals usingMet- Fragand/orSIRIUS4/CSI:FingerID.Mostcompoundswithoutcandi- dateproposals (80%)elutedbefore 4minandthereforemight be artefactsfromtheLC-HRMS/MSanalysis.
Togetfurtherevidence forananthropogenic origin,562com- poundswerecheckedforcharacteristicisotopepatternssuchasCl (SI-C1)andfortheiroccurrenceineffluentsamplesoftwomunic- ipalwastewatertreatment plants(SI-C2, including74 agricultural compounds with maximum intensity>5 × 10⁶, which were not part of the 488 compounds).At least 39 ofthe 488 compounds containedone or moreClatoms (see SI-B2and discussion inSI- A9) based on their isotope pattern. In terms of occurrence, 38%
ofthe 56urban compounds were detected inatleast one ofthe twoeffluentsamples,only12%ofthe323urban/agriculturalcom- poundsand12%ofthe86agriculturalcompoundsshoweda peak intheeffluentsamples.Interestingly,alsoahighpercentageofthe 97not classifiablecompounds (39%) werefound inthe wastewa- tereffluents(SI-B2).However,themajorityofthesenotclassifiable compounds(70%)elutedbetween3and4min,i.e.theywerepos- siblymisclassifiedoroccurnaturally(e.g.salts).
3.3. Characterizationofgroundwaterqualityatmonitoringsites
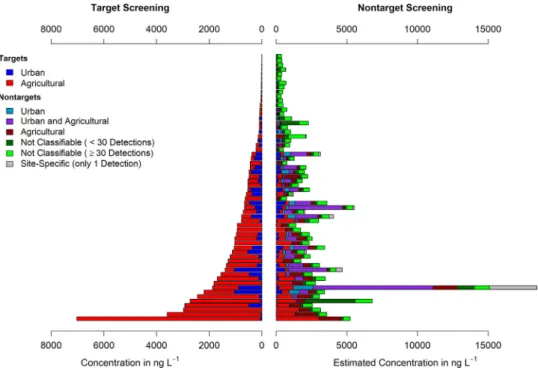
Fig.3illustratesthe totalestimatedconcentrationsofdetected compounds at the 60 monitoring sites, after excluding potential false positives(see figure caption). The total concentrationswere estimatedassuming thatthecompoundsionize,onaverage,asef- ficientlyasthetargetcompounds(Section2.5.2).
Fig. 3. Total concentrations determined in target screening (left) and estimated total concentrations determined from nontarget screening (right) for each monitoring site.
The colour code indicates the potential source of the contamination. Concentrations were estimated assuming that the nontargets ionize on average as efficiently as target compounds (same ionization efficiency for each nontarget). Therefore, concentrations of urban and agricultural targets determined in the target screening may differ from estimated concentrations of targets determined in the nontarget screening. To reduce false positives, compounds were excluded if they (i) were identified as potential natural organic matter (broad peak, retention time > 10 min, SI-A9), (ii) had retention time < 4 min, (iii) had a maximum intensity in the pooled samples that was larger than the maximum intensity in the samples (296 compounds), or (iv) were not reproducibly detected in the pooled samples ( < 5 detections or relative standard deviation > 50%). The early-eluting compounds were excluded because they are likely to be misclassified (intensity does not necessarily correlate with concentration) or to be of natural origins (e.g. salts). The exclusion of compounds not reproducibly detected in the pooled samples may lead to an underestimation of site-specific pollution. See Figure SI-A6 to Figure SI-A11 for similar plots based on detections or estimated concentrations, with and without excluded compounds.
Thetargetscreening,shownforcomparison,demonstratesthat anthropogenic activitiesaffectthe monitoringsitesto verydiffer- entextents.Totaltargetconcentrationsrangedfrom12to7000ng L−1.Formostmonitoringsites,thenontargetscreeningconfirmed thecontaminationtrendobservedinthetargetscreening.Monitor- ing siteswithfewtargetdetectionsalsohadlessnontargetdetec- tions than sites whereseveral targetswere found (FigureSI-A7).
Most not classifiablenontargets were detected inpositive ioniza- tion mode (Figure SI-A8). To estimate which percentage of total contaminationwasexplainedbythetargetscreeningfor498MPs, wecomparedtheestimatedconcentrationoftargetswiththeesti- mated concentrationofnontargetsfromeachsource(without not classifiable/site-specificnontargets,i.e.only1detection, andwith- out potentialfalsepositives).Accordingtothisapproximation,the targetswouldexplain4to72%ofthetotalcontaminationinindi- vidual samples(median: 34%; pooledsamples:30–33%; basedon detections: 8–28%,median:16%, pooledsamples10–11%). Assum- ing that nontargets ionize as efficiently astarget compounds, 46 nontargetshadconcentrations>100ngL−1inatleastoneground- water sample.However, it should bekept inmind that thesees- timates are subject to various uncertainties:(i) the classification might be erroneous; (ii)the true ionization efficiencyof individ- ual compounds mightdiffer considerably from the ionization ef- ficiencyassumedby ourquantificationapproach(same ionization efficiencyforall compounds);(iii)matrixeffects(ionsuppression and enhancement) may influence signal intensities and thus the estimatedconcentrationsinindividualsamples;(iv)somepotential MPsmighthavebeendetectedseveraltimes,e.g.inbothionization modesorduetoinsufficientcomponentisation(seeSection3.2).
Despitetheseuncertainties, nontargetscreeningindicated that the contamination from agriculture at sites with high agricul- tural influencemightbe considerablyhigherthanassumedbased
solely on target screening. Indeed, based on the roughly esti- matedcompound concentrations,21–96%ofpotential agricultural MPs,detected atsiteswithhighagriculturalinfluence,wouldnot be explained by targets (median: 49%, pooled samples: 48–52%;
basedon detections: 62–89%,median77%,pooled samples:81%).
This was at first glance surprising since we had previously per- formedasuspect screeningformostregistered pesticides,includ- ing their TPs, using samples frompartially the same monitoring sites (Kiefer et al., 2019). The suspect list comprised more than 1000pesticideTPs,compiledfromvarioussourcesandmostlyob- served within the European pesticide registration. However, for many pesticides applied in Switzerland between 2005 and 2017, relatively few TPscould be gatheredforthe suspect list;for 26%
ofpesticides transformationdata wasunavailable orinaccessible.
Consideringthatforsomepesticides,e.g.chlorothalonil,morethan 20 TPs are known (EFSA, 2018), it is likely that the suspect list lackedimportantTPs,whichwerethereforenotdetectedusingthe suspectscreeningapproach.
Whethergroundwaterquality isindeedmoreaffectedby agri- culturethanbyurbanactivities(asindicatedbythetargetscreen- ing)remainsunclear.Manynontargetcompoundswere jointlyas- signed to both urban and agricultural sources (“potential urban andagriculturalMPs”;Fig.3:purple),thoughsome oftheseprob- ablyoriginatefromonlyurbansources,asshownforsomeidenti- fied compounds (see Table 2 and Section 3.4.2). One monitoring site differed strongly from the remaining sites in terms of esti- mated concentrations,totalnumber ofnontargetcompounds and thenumberofsite-specificcompounds(Fig.3,FigureSI-A6toFig- ure SI-A11). Strikingly, thissite was not suspicious in the target screening,exceptforhighconcentrationsofthepesticide cycluron (140ngL−1;SI-B1),whichwasbannedinSwitzerlandin2005and inthe EUin 2003(EuropeanCommission, 2002). Theelucidation
Table 2
Identified suspects and nontargets, reported previously in literature and ordered according to confirmation confidence and detection frequency in groundwater. The Pub- Chem Compound ID (CID) is provided as identifier. Further identifiers (InChIKey, SMILES) and quantification results are listed in SI-B4. For MS/MS fragments, see SI-A12.
See SI-B2 and SI-B3 for all prioritized nontargets and suspects, including annotated candidates. References point to studies reporting prior detections in environmental samples; n.q. = no quantification.
Compound Screening Classification
Maximum concentration in ng L −1
No. of
detections Use/sources
Literature on environmental occurrence
Trifluoroacetic acid ∗ Level 1, CID 6422
Suspect Not Classifiable > 5000 60 Various sources Berg et al. (2000) , Scheurer et al. (2017) Trifluoromethanesulphonic
acid ∗
Level 1, CID 62406
Suspect Agricultural 90 53 Industrial chemical Zahn et al. (2016)
Atrazine-desethyl-desisopropyl Level 1, CID 18831
Nontarget Agricultural 90 51 Pesticide TP BMASGK (2018)
Perfluoropropanesulfonic Acid Level 1, CID 9859771
Nontarget Urban & Agricultural 5–30 51 Perfluorinated compound
Mak et al. (2009) Oxypurinol ∗
Level 1, CID 135398752
Nontarget Urban 300 20 Pharmaceutical TP Funke et al. (2015)
Methyldiphenylphosphine oxide ∗∗
Level 1, CID 75041
Nontarget Urban & Agricultural n.q. 23 Industrial chemical Brand et al. (2018)
Edetic acid (EDTA) ∗
Level 1, CID 6049 Suspect Urban n.q. 20 Industrial chemical Schmidt et al. (2004)
2-Acrylamido-2-methyl-1- propanesulfonic acid (AMPS) ∗ Level 1, CID 65360
Suspect Urban & Agricultural 90 13 Wide-spread use (industry and households)
Schulze et al. (2019)
Perfluorobutylsulphonamide Level 1, CID 10958205
Nontarget Urban & Agricultural n.q. 13 Perfluorinated compound
Chu et al. (2015) in fish Methenamine ∗
Level 1, CID 4101 Suspect Urban < 200 11 Wide-spread use
(industry and households)
Knepper et al. (1999)
Dimethylbenzenesulfonic acid (isomers) ∗
Level 1
Suspect Urban & Agricultural 80 10 Industrial chemical Betowski et al. (1996)
p-Toluenesulfonic acid ∗ Level 1, CID 6101
Suspect Not Classifiable 200–700 7 Industrial chemical Crathorne et al. (1984) 5-Methoxy-2H-benzotriazole
Level 1, CID 119717
Nontarget Urban & Agricultural 3 7 Benzotriazole derivate or TP thereof
Liu et al. (2013) , Huntscha et al. (2014) tentative structure Propyphenazone
Level 1, CID 3778
Nontarget Urban & Agricultural 10 5 Pharmaceutical Heberer (2002) Pyrimidinol (2-Isopropyl-6-
methyl-4-pyrimidone) Level 1, CID 135444498
Nontarget Urban & Agricultural 60 2 Pesticide / biocide TP (diazinon TP)
Diaz-Cruz and Barcelo (2006)
Fluometuron Level 1, CID 16562
Suspect Urban & Agricultural 40 2 Pesticide / biocide Herrero Hernández et al. (2012) Sulisobenzone
Level 1, CID 19988
Suspect Site-specific 50–100 1 UV filter, various uses Rodil et al. (2008) Iopromide TP 643
Level 2a, CID 139597923 Nontarget Urban & Agricultural n.q. 26 Pharmaceutical TP Schulz et al. (2008) Iopromide TP 701 A
Level 2a, CID 139596314
Nontarget Urban & Agricultural n.q. 23 Pharmaceutical TP Schulz et al. (2008) Iomeprol TP 629
Level 2a, CID 23189998
Nontarget Urban n.q. 18 Pharmaceutical TP Kormos et al. (2009)
Triphenylphosphine oxide ∗ Level 2a, CID 13097
Nontarget Urban & Agricultural n.q. 16 Industrial chemical (synthesis by-product)
Knepper et al. (1999) Hexa(methoxymethyl)-
melamine Level 2a, CID 62479
Suspect Not Classifiable n.q. 7 Industrial chemical Dsikowitzky and Schwarzbauer (2015) , Bobeldijk et al. (2002) Metolachlor TP CGA357704
Level 2a, CID 71312482
< 100 6 Pesticide TP Reemtsma et al. (2013)
Chlorendic acid Level 2a, CID 8266
Nontarget Site-specific n.q. 1 Industrial chemical, TP
of organochlorine
pesticides Ying et al. (1986) , IPCS (1996) Isomer of
5,6-Dimethyl-2H-benzotriazole Level 3
Nontarget Urban 1–10 15 Benzotriazole derivate
or TP thereof Huntscha et al. (2014) , Trcek et al. (2018) Isomer of
5-Methoxy-2H-benzotriazole Level 3
Nontarget Urban & Agricultural 10–30 14 Benzotriazole derivate or TP thereof
Liu et al. (2013) , Huntscha et al. (2014) tentative structure Naphthalenedisulfonic Acids
(various isomers) ∗ Level 3
Nontarget Urban & Agricultural > 500 1 Industrial chemical Jekel and Gruenheid (2005) , Knepper et al. (1999)
∗ Contamination during sample processing cannot be fully excluded. Only detections are reported, meaning that the concentration in groundwater samples was at least twice as high as the maximum concentration in 18 blank samples. Where quantification was not possible, an intensity threshold was instead applied, requiring a sample intensity at least five times higher than the maximum intensity recorded in blank samples.
∗∗The METLIN MS/MS library reports different MS/MS fragments than recorded in this study.
Fig. 4. Novel MPs elucidated through nontarget and suspect screening. For more details, including structural identifiers and quantification results in individual samples, see SI-B4. For MS/MS fragments, see SI-A12. Two metolachlor TPs were too strongly retained by LC, i.e. partially eluting in subsequent samples. logD OW,pH7(water-n-octanol distribution coefficient considering the speciation at pH 7) was predicted with JChem for Office (Version 17.1.2300.1455; ChemAxon Ltd.).
of some nontargets supports the hypothesis that thismonitoring siteishighlycontaminated(Section3.4).
3.4. Identificationofnontargetsandsuspects
Structural elucidationefforts were especially successfulwhere (i)nontargetswereannotatedwithrelativelyfewstructuralcandi- dates (12 of 21 unequivocallyor tentativelyidentified nontargets had <10 candidates), (ii) MS/MSspectra ofthe correct candidate were availableinlibrariesorliterature(13nontargets),(iii)useful metadata was accessible (e.g. information on field of application for candidates), and finally (iv) reference material could be pur- chased.
Using29referencestandards,weconfirmed11suspectsand12 nontargets(Level1)andrejectedthreesuspectsandthreenontar- gets. Moreover,five nontargetsandtwo suspectscouldbe identi- fiedasprobablestructuresbyalibraryspectrummatch(Level2a), while a further five nontargets and five suspects were assigned tentative structures (Level 3). Fig. 4 presents novel compounds (Level 1orLevel 3) andTable2 compounds,which were already reportedtobedetectedinenvironmentalsamples.Furtherdetails, including quantification results and MS/MS spectra, are given in SI-A12 andSI-B4. Inaddition,MS/MSspectra willbeuploadedto MassBank(www.massbank.eu).
3.4.1. Novelmicropollutants
2,5-dichlorobenzenesulfonic acid is pre-registered under REACHandwaspredictedaslikelytobe carcinogenicandpersis- tentintheenvironment(ECHA2020).2,5-dichlorobenzenesulfonic acid was detected in 19 out of 60 samples, mostly in the low ng L−1 range,inone sampleat100 ngL−1.We didnot findevi-
denceforaprior detectioninenvironmentalsamplesinavailable literature.
Phenylphosphonic acid is registered under REACH (10–100 t a−1, ECHA(2020)) andwas detected at10 monitoring siteswith concentrationsofup to50ngL−1.Schulzeetal.(2019)compared variousanalyticalapproachesfortheanalysisofpolarcompounds.
Phenylphosphonic acidcould only be analysedby reversed-phase LC, butthe testedenrichment methods, all based onsolid phase extraction, were unsuitable for this industrial chemical. The oc- currenceinenvironmentalsamplesafterevaporativeenrichmentis herereportedforthefirsttime.
O-des[2-aminoethyl]-O-carboxymethyl dehydroamlodipine is aTPofthebloodpressureregulatoramlodipine,whichisapproved inSwitzerland.TheTPwasdetectedinnearlyonethirdofthesam- plesatconcentrations<100ngL−1 andisprobablyreportedhere forthefirsttimeinenvironmentalsamples.
Triisopropanolamine borate was detected at two monitoring sitesatconcentrationsofup to40ngL−1 andwastoourknowl- edge not reported before in the environment. The sulphonamide diureticdrug xipamide wasfound in two samples at30 ngL−1. Previously, Li et al. (2017) identified xipamide only tentatively inEuropeanwastewater-impactedrivers.Interestingly,xipamideis notapprovedinSwitzerlandandwasthereforealsonotonthetar- getlist(PharmaWiki,2020).Onenontargetcompound,detectedat fivemonitoringsitesandclassifiedasa potentialurban andagri- culturalMP,wastentativelyidentifiedasthepesticideTPpyroxsu- lamTPPSA(referencestandardnotavailable).
Amongst the top ten most intense potential agricultural MPs withadetectionfrequency>50%,wetentatively identifiedmeto- lachlorTPSYN542490(referencestandardsnotavailable).Assum- ing a similar ionization efficiency as metolachlor-ESA and meto-
lachlor TPCGA 368208,maximumconcentrationswere estimated to be in the range of 100–500 ng L−1, which is comparable to the concentrations ofthe target compounds metolachlor-ESA and metolachlor TP CGA 368208.S-metolachlor iscurrentlyunderre- view for renewal in the EU. In contrast to our previously per- formed target and suspect screening (Kiefer et al., 2019), which includedninemetolachlorTPs,herewehadaccesstoninefurther metolachlorTPs(includingTPSYN542490;T.Poiger,personalcom- munication). They were previously observed in a lysimeter study by the pesticide producer (Hand et al., 2016). After the detec- tion of SYN542490,we manually screened for theremaining TPs andtentativelyidentifiedtheTPsCGA357704(reportedpreviously by Reemtsma et al. (2013)), SYN542607, SYN547977, SYN542489, SYN542491, andone or both of the isomers, namely SYN547969 andSYN542488;allofwhichweredetectedatlowerintensityand lowerfrequencycomparedtoSYN542490.
3.4.2. Evaluationofpre-classificationofelucidatedcompounds The identification efforts focused on compounds classified as potential MPs from urban sources and urban and agricul- tural sources. Probably all elucidated compounds with this pre- classification originate from urban or industrial sources, except for the tentatively identified TP of the herbicide pyroxsulam, namelypyroxsulamTPPSA.Furthermore,weinvestigatedthemost intense and wide-spread potential agricultural pollutants lead- ing to the identification of TPs of the pesticides metolachlor and atrazine, confirming the correct pre-classification. Interest- ingly, in addition to the mentioned pesticide TPs, we also de- tectedtheshort-chainperfluorinatedcompoundtrifluoromethane- sulfonic acid(53 detections), whichhaspreviously been reported by Zahn etal. (2016) andSchulze et al.(2019) asa wide-spread MP withconcentrations inthengL−1 to μgL−1 range.The high- est concentrations inour study(up to 90ng L−1) were detected insampleswithhighagriculturalinfluence,explainingitsclassifi- cationasapotentialagriculturalMP.Incontrasttoanothershort- chainperfluorinatedcompound,trifluoroaceticacid,forwhichvar- ioussourceshavebeenreportedincludingthedegradationofpes- ticides (Scheurer etal., 2017), trifluoromethanesulfonic acidis to ourknowledgenotknownasbeingofpotentialagriculturalorigin.
Four elucidatedsuspectscould notbe relatedto urban and/or agricultural sources, i.e. were “not classifiable”. The industrial chemicalhexa(methoxymethyl)melamineshowed,onaverage,only four times higher intensity in samples with high urban influ- ence compared to the averageintensity in sampleswith low ur- ban influence andwastherefore “not classifiable” (threshold was five,Section 2.5.2).Inthe caseofp-toluenesulfonicacid, contam- ination during sample handling or analysis led to false positive detections in a few samples, including the blank samples. This compound is a known background contaminant (Schulze et al., 2019). On average its intensity was 28 times higher in samples thaninblanks,meaningitwasnotremovedduringpre-processing (Section2.5.1).Similarly,1,3-diphenylguanidinewasdetectedinall samples and in 19 of these had an intensity five times greater than inblanks.However, inspikingexperiments(100ngL−1) we observed 3–4 timeshigher intensities inthe sample matrixthan in ultrapure water(ion enhancement),suggestingthat the detec- tions with relatively high intensity might represent contamina- tions.Therefore,1,3-diphenylguanidineisnotreportedinTable2.A further“notclassifiable” compoundwastrifluoroaceticacid,which isa ubiquitouslyspreadpollutantandmayentergroundwatervia diffuse sources (atmospheric deposition, pesticide application) or point sources (industrial emissions to rivers) (Berg et al., 2000; Freeling et al., 2020; Scheurer et al., 2017). Accordingly, trifluo- roaceticacidwasdetectedinallsamples,thoughreliablequantifi- cationwasnotpossible.
Manyidentifiednontargetsandsuspectswerepre-classifiedas
“potentialurban and agriculturalMP”, although they likely origi- nateonlyfromurban sources(e.g.TPsofx-raycontrastagentio- promide,benzotriazolederivates,Table 2).This impreciseclassifi- cation results from the large number of monitoring sites, which wereinfluencedbybothurbanandagriculturalactivities,whereas onlyfewsitesshowedahighurban butlowagriculturalinfluence (Fig.1).ToachieveabetterclassificationofurbanMPs,moremon- itoringsites withprimarily urban influence wouldbe neededfor the workflow, but this was difficult to obtain due to the Swiss small-scalestructuredlandscape.
Thecharacterizationofthemonitoringsites(Section3.3)high- lighted one site in particular, due to its especially high contam- ination in terms of both the number and estimated concentra- tionsofdetectednontargets(Fig.3,FigureSI-A6toFigureSI-A11).
Out of46nontargetswithestimatedconcentrations >100 ngL−1 (Section3.3;10ofthe46wereidentified),23weredetectedatthis site. The hypothesis that this sitemight be highly contaminated was further supported by the elucidationof various compounds, beingeithersite-specificorshowinghighestconcentrationsatthis site, such as theindustrial chemicals naphthalenedisulfonic acids (variousisomers, >500 ng L−1) andp-toluenesulfonic acid(200–
700 ng L−1), the diazinone TP pyrimidinol (60 ng L−1), the in- dustrialchemicalsdimethylbenzenesulfonicacids(variousisomers, 80ngL−1)and2,5-dichlorobenzenesulfonicacid(100ngL−1),and chlorendicacid(Level2a).TheECHAclassifieschlorendicacidasa carcinogencategory1B(ECHA,2020).Potentialsourcesincludethe degradation of flame-retardant polyesters or organochlorine pes- ticidessuch asendosulfan,heptachlor, oraldrin(IPCS,1996). The reason for this contamination is unknown, but the groundwater fromthissiteisnotcurrentlyusedfordrinkingwaterproduction.
4. Conclusions
Bycombiningan appropriate compoundprioritizationstrategy withahighlyautomatedstructuralelucidationworkflow,wewere abletocharacterizegroundwaterqualityinamorecomprehensive manner than previously possible using targeted methods and in doingso,toidentifyasyetunreportedMPs.
• Nontargetswere prioritizedbased ontheir potentialoriginfor structural elucidation. Categorisation of nontargets also pro- videdrough estimates of the number and the concentrations ofthusfaroverlookedcontaminants.
• A combination of computational tools supported the struc- tural elucidation process. AcquireX improved MS/MS cover- age for nontargets and suspects, while MetFrag and SIR- IUS4/CSI:FingerID (together with an extensive compound database)resultedin23unequivocallyidentifiedand17tenta- tivelyidentifiedcompounds.13ofthesecompoundsarenovel.
• Structural elucidation wasmost successful for compounds (i) withMS/MSspectrainlibrariesorliterature,(ii)thatwereas- signed limitednumbers of candidate structures, (iii) that had accessiblemetadata,and(iv)forwhichreferencematerialwas available.
• Despite the high degree of automation of the structural elu- cidationworkflow, structural elucidation itself remains a ma- jor bottleneck in transforming unknowns into known com- pounds.Moreover, elucidation of compounds not presently in anydatabase,e.g.sofarnotobservedTPs,ishighlychallenging andwasnotcoveredatallbyourelucidationapproach.
• Onegroundwater samplewasrevealed tobe much morepol- lutedthanassumedbasedontargetscreening,highlightingthe relevance ofcomprehensive screening approachesfor evaluat- ingwaterquality.