Life-Cycle Support for Staff Assignment Rules in Process-Aware Information Systems
?Stefanie Rinderle-Ma1,2 and Wil M.P. van der Aalst2
1Department Databases and Information Systems, Faculty of Engineering and Computer Sciences,
Ulm University, 89069 Ulm, Germany.
2Department of Technology Management, Eindhoven University of Technology,
P.O. Box 513, NL-5600 MB, Eindhoven, The Netherlands.
stefanie.rinderle@uni-ulm.de, w.m.p.v.d.aalst@tm.tue.nl
Abstract. Process mining has been proposed as a tool for analyzing business processes based on events logs. Today, most information sys- tems are logging events in some log and thus provide detailed informa- tion about the processes they are supporting. This information can be used for two forms of process mining: conformance checking (comparing the actual process with some a-priori model) and discovery (deriving a model from scratch). Most of the process mining tools have been focus- ing on the control-flow perspective and today it is possible to automat- ically construct process models that can be used for the configuration ofProcess-Aware Information Systems (PAISs). This paper provides an overview of process mining and focuses on a neglected aspect of PAISs:
staff assignment. We propose an approach forstaff assignment mining based on decision tree learning, i.e., based on some organizational model and an event log we try to discover allocation rules. This is useful for configuring new PAISs. However, it can also be used to evaluate staff assignment rules in some existing PAIS. Based on this, flaws and re- dundancies within staff assignment rules (e.g., security holes by offering process activities to non-authorized users in exceptional cases) can be detected and optimization strategies can be derived automatically. The approach has been implemented in the context of the ProM framework and different strategies have been evaluated using simulation. Altogether, this work contributes to a complete life-cycle support for staff assignment rules.
1 Introduction
New trends in information technology and developments at the (e-business) mar- ket let companies crave for automated business process support. Process-Aware
?We thank the EIT for supporting the research stay of Stefanie Rinderle-Ma at the Department of Technology Management, Eindhoven University of Technology, dur- ing which this work was conducted.
TU Eindhoven, Computer Science Report, Beta Working Paper Series, No. 213, 2007
Information Systems (PAISs) [25] (e.g., in the form of a workflow management system [4]) allow for the explicit definition of the process logic, the execution and monitoring of processes, the integration of distributed application components, and the provision of worklists to authorized users.
1.1 Problem Description
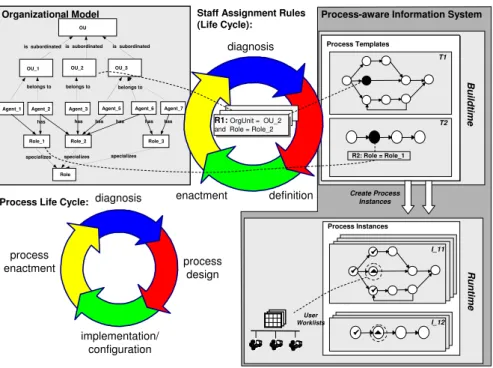
Despite the promising perspectives of PAISs, their breakthrough with respect to a broad application in practice has not taken place so far. One reason might be that, in general, the discovery and the design of business processes are difficult tasks: It requires deep knowledge of the business process at hand (i.e., lengthy discussions with the workers and management ar needed) and the process model- ing language being used. In this context,process mining technology has brought up a very promising alternative to classical process modeling approaches. Based on collecting audit trail data of already executed processes it is possible to au- tomatically derive the process control-flow (note that in most cases, prior to the deployment of a PAIS, the processes are already there). Closely monitoring the events taking place at runtime also enablesprocess diagnosis, i.e., detecting flaws or discrepancies between the design constructed in the design phase and the actual execution registered in the enactment phase (cf. Figure 1). Coupled with adaptive process management technology [1, 38, 49, 60] a complete support of the business process life-cycle becomes possible.
By developing a variety of algorithms and implementing them within the ProM framework [22], process mining has become a mature technology in the last years, in particular with focus on control-flow mining [11, 6]. However, fur- ther aspects have to be specified in order to execute the processes in the sequel.
One important task is to model the related organizational structures capturing the agents working in the associated domain, their roles and abilities as well as the organizational units they belong to (e.g., Agent 1 having role Role 1 and belonging to organizational unit OU 1). Social network mining [8, 7] constitutes a first approach for analyzing audit trail data with respect to agents and their relation between each other (e.g., who hands over work to whom). Although this approach enables us to gain insight into the organizational structures behind the audit trail data, it does not provide information about how process models and organizational models are coupled. In today’s PAISs this is accomplished by definingstaff assignment rules which link the process activities to elements of the organizational structures (cf. Figure 1). At runtime, the system can de- termine which agents are authorized to work on certain activities by resolving the staff assignment rules over the underlying agent set. Accordingly, the system puts the activities to be processed into work lists of qualified agents. Based on this mechanism the controlled execution of process activities (i.e., by authorized agents only) is ensured.
As discussed the definition of staff assignment rules is indispensable for the execution of business processes. Similar to the discovery and definition of busi- ness processes the specification of staff assignment rules might often be a complex task for users. Therefore the automated discovery and design of staff assignment
OU
OU_1
Agent_1
is subordinated
Role specializes
specializes specializes
OU_2 OU_3
is subordinated Process Templates
Buildtime
Process Instances
Runtime
Agent_2 Agent_5 Agent_6 Agent_7
belongs to
Agent_3
belongs to belongs to
Role_1 Role_2 Role_3
has has has has has
Process-aware Information System
has is subordinated
Staff Assignment Rules (Life Cycle):
Create Process Instances
User Worklists
Organizational Model
T1
R2: Role = Role_1 T2
I_11
I_12 R1: OrgUnit = OU_2
and Role = Role_2 R1: OrgUnit = OU_2 and Role = Role_2
process design
implementation/
configuration process
enactment
diagnosis Process Life Cycle:
diagnosis
definition enactment
Fig. 1.Life-cycles in process-aware information systems.
rules could be of high interest in practice. In [39] the problem of mining staff assignment rules from audit trail data was addressed for the first time. Based on existing organizational structures and audit trail data, a decision tree based algorithm automatically determines the staff assignment rule for a certain activ- ity.
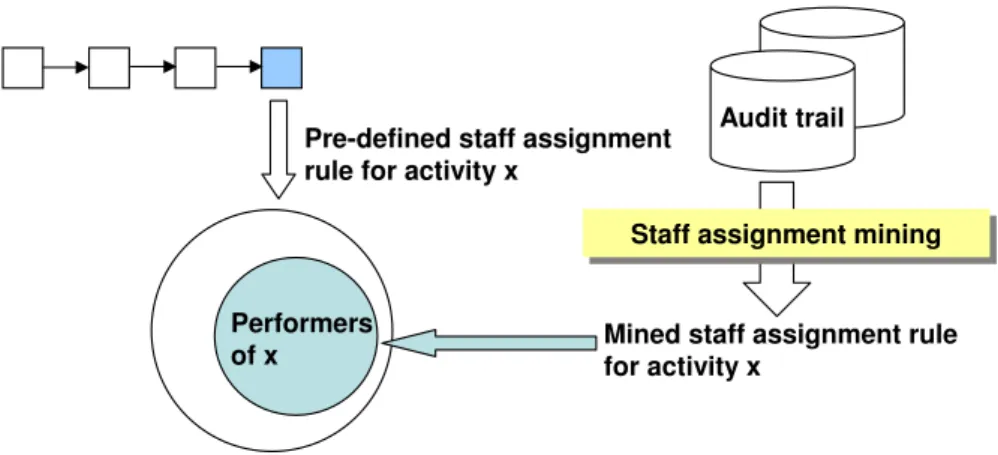
Analogous to process models, the specification of staff assignment rules may not be stable forever (i.e., deviations from the pre-defined rules may occur rather frequently). Therefore a diagnosis phase is included within the life-cycle of staff assignment rules where discrepancies between pre-defined rules and actual be- havior of agents regarding the execution of process activities is analyzed. Con- sider, for example, Figure 2 where activity xis actually performed by a subset of agents qualifying for the pre-defined staff assignment rule forx.
However, it is not sufficient to just detect such discrepancies. The diagnosis phase should also lead to suggestions for optimizing the staff assignment rules in the sequel: First of all, the pre-defined staff assignment rules may containredun- dant parts (i.e., the set of agents qualifying for the affected staff assignment rule does not change if the redundant part is removed). However, at runtime these re- dundant parts are evaluated as well since the system cannot distinguish between necessary and unnecessary parts of staff assignment rules. This, in turn, might lead to performance losses, in particular when resolving staff assignment rules for a large number of running process instances (for large hospitals, for example,
Audit trail
Performers of x
Pre-defined staff assignment rule for activity x
Staff assignment mining Staff assignment mining
Mined staff assignment rule for activity x
Fig. 2.Deriving and evaluating staff assignment rules
10000 process instances may be active at the same time). A second optimiza- tion for staff assignment rules is based on the detection of agents which have executed activities in an exceptional manner (e.g., agents substituting others in case of holidays or diseases). Deriving specifications of substitution assignments (e.g., the examination of doctor Smith is always substituted by doctor Black) would contribute to controlled handling of such exceptional situations (i.e., the examination is intentionally offered to Black if Smith is not available and not wrongly to nurse Johnson). Thirdly, similar to business processes, staff assign- ment rules may be specified in a sub-optimal way, or change over time. In this case, at least, the system should be able to detect the modeling flaws and report them to users. For all these reasons an adequate support for discovering, design- ing, and diagnosing staff assignment rules during their life-cycle would be very beneficiary for the practical application of PAISs.
1.2 Contribution
In this paper we provide a framework for the discovery and design as well as for the diagnosis and optimization of staff assignment rules. It is based on a decision tree based approach and a simulation which is evaluated by different plug-ins of the ProM framework1. With these results a comprehensive support of the staff assignment life-cycle (cf. Figure 1) becomes possible.
First of all, we conduct a complete simulation for an example medical treat- ment process using CPN tools and ProMimport [33]. Based on the simulation data, a complete overview of existing process mining techniques is provided ranging from control-flow mining [11], social network mining [8, 7], and decision mining to analysis techniques like conformance checking [50] and property check- ing [2]. This constitutes a complete overview of existing techniques for process
1 This analysis constitutes a substantial extension of the work presented in [39] where the basic staff assignment mining concepts have been introduced.
life-cycle support. Further on we provide formal definitions for organizational models and for staff assignment rules as well as the decision tree based mining approach presented in [39].
After introducing the fundamental definitions the simulation data is evalu- ated with respect to staff assignment mining. For the analysis we assume pre- defined staff assignment rules and compare them with the mining results. Based on the results, possible relations between original and mined staff assignment rules are formalized. In addition, we show how these relations can be used for deriving optimization suggestions in the sequel. In the following we extend the simulation scenario by introducing exceptional agent behavior (i.e., agent sub- stitutions for a certain percentage of process instances). By evaluating the sim- ulation data we show how substitution rules can be automatically specified.
Altogether the presented approach provides complete life-cycle support for staff assignment rules and therefore contributes to the practical applicability of PAISs.
The remainder of this paper is organized as follows: In Section 2 we provide an overview of the existing process mining techniques based on simulation data.
Section 3 contains background information on defining organizational structures as well as on the basic staff assignment mining approach. The evaluation frame- work for staff assignment rules including optimization suggestions is presented in Section 4. We discuss related work in Section 5 and conclude with a summary of the presented results and an outlook on future work in Section 6.
2 Process Mining
This section provides an overview of process mining. Using a running example, it shows the different ways to discover and check the various perspectives of a process based on some event log.
2.1 Overview
Today’s information systems are logging events that are stored in so-called “event logs”. For example, any user action is logged in ERP systems like SAP R/3, workflow management systems like Staffware, and case handling systems like FLOWer. Classical information systems have some centralized database for log- ging such events (called transaction log or audit trail). Modern service-oriented architectures record the interactions between web services (e.g., in the form of SOAP messages). Moreover, today’s organizations are forced to log events by national or international regulations (cf. the Sarbanes-Oxley (SOX) Act that is forcing organizations to audit their processes). As a result of these developments, there is an abundance of process-related data available. The goal of process min- ing is to use this data, i.e., enable a fine grained analysis of processes based on event logs.
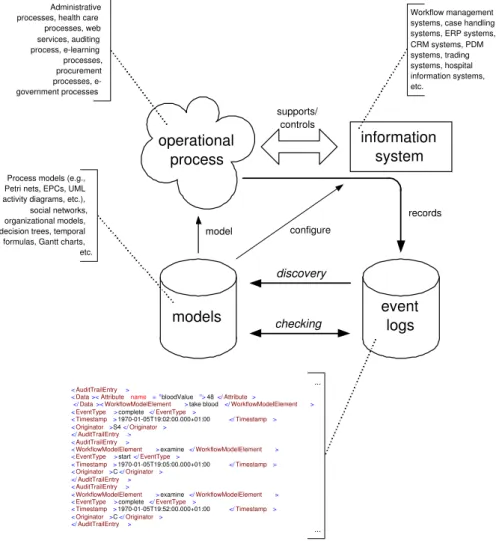
Figure 3 illustrates the basic idea of process mining. As indicated a wide variety of operational process are supported by information systems that record events. Crucial for process mining is the existence of an event log showing in
information system operational
process
models event
logs
model
discovery
checking
records configure
supports/
controls
Process models (e.g., Petri nets, EPCs, UML activity diagrams, etc.), social networks, organizational models, decision trees, temporal formulas, Gantt charts, etc.
Administrative processes, health care
processes, web services, auditing process, e-learning processes, procurement processes, e- government processes
Workflow management systems, case handling systems, ERP systems, CRM systems, PDM systems, trading systems, hospital information systems, etc.
...
...
<AuditTrailEntry >
<Data><Attribute name = "bloodValue ">48 </Attribute>
</Data><WorkflowModelElement >take blood </WorkflowModelElement >
<EventType >complete</EventType >
<Timestamp >1970-01-05T19:02:00.000+01:00 </Timestamp >
<Originator>S4</Originator >
</AuditTrailEntry >
<AuditTrailEntry >
<WorkflowModelElement >examine</WorkflowModelElement >
<EventType >start</EventType >
<Timestamp >1970-01-05T19:05:00.000+01:00 </Timestamp >
<Originator>C</Originator >
</AuditTrailEntry >
<AuditTrailEntry >
<WorkflowModelElement >examine</WorkflowModelElement >
<EventType >complete</EventType >
<Timestamp >1970-01-05T19:52:00.000+01:00 </Timestamp >
<Originator>C</Originator >
</AuditTrailEntry >
Fig. 3.An overview of process mining.
chronological order relevant events, e.g., events like “payment for customer or- der XQ665456 is received”, “X-ray taken for patient with id 86868”, or “building permit BP085354 is granted”. These events are recorded in a so-calledevent log.
Based on such an event log two types of analysis are possible: discovery and checking. Discovery algorithms try to extract models from event logs without any a-priori information. For example, theαalgorithm [11] is able to discover a Petri net model capturing the control-flow of a process based on an analysis of the log.
Other approaches assume some a-priori model and check whether the log and the model fit together. For example, it is possible to formulate some business rule in Linear Temporal Logic (LTL) and then check whether the behavior recorded in the log is consistent with this rule [2]. Orthogonal to the dimension distinguishing discovery (no a-priori model) and checking (some a-priori model is used as a ref- erence) is the dimension “distinguishing the various perspectives of operational processes. In this paper, we distinguish thecontrol-flow,data, andorganizational perspectives. The control-flow perspective is mainly concerned with the selection and ordering of activities. Typical languages to describe this perspective are Petri nets, Event-driven Process Chains (EPCs), UML activity diagrams, etc.
The data perspective is more concerned with the information related to activities and cases (i.e., process instances). Typical examples of models in this area are decision trees and data models. The organizational perspective focuses on the agents (typically people but in principle also other types of resources) executing the activities. Using these two dimensions, we can identify 2*3=6 process mining classes: discovery/checking and control-flow/data/organization. Theαalgorithm [11] mentioned earlier is a control-flow discovery algorithm and fits into one of these 6 classes. Although some process mining approaches cover multiple classes, most techniques can be positioned in one of the 6 classes.
The focus of this paper is on staff assignment mining. This fits primarily in the organizational discovery class. However, before focusing on staff assignment mining we provide an overview of process mining using a running example.
2.2 Running Example
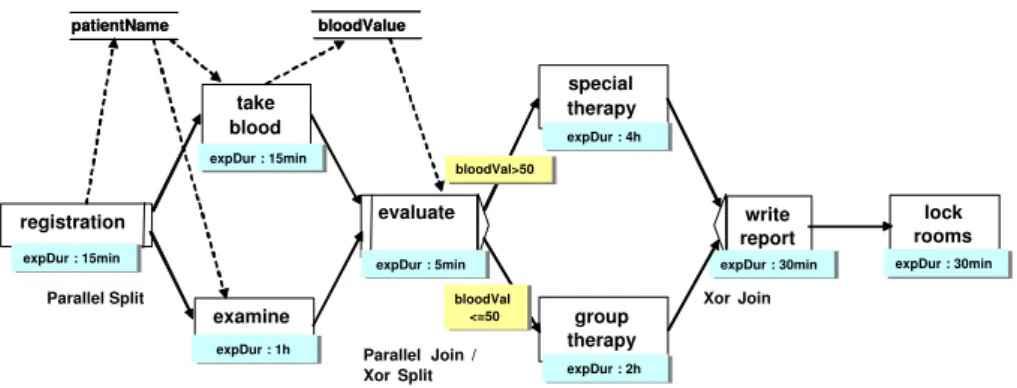
To illustrate various classes of process mining, we use the treatment process shown in Figure 4. First of all, the patient is registered (activityregistration) by his or her name (data element patientName) which takes approximately 15 minutes. Afterwards the examination of the patient (activityexamine) and tak- ing a blood sample (activity take blood) can be executed in parallel. Both activities require the patient name as input data. Activity take blood writes data element bloodValue when completed. The expected duration for activity examineis 1 hour whereas taking blood takes approximately 15 minutes. After taking the blood sample and examining the patient an evaluation of the blood value takes place (activity examine). If the blood value exceeds 50 units the patient has to undergo aspecial therapywith a duration of 4 hours. Other- wise (if the blood values is equal or less 50 units) the patient participates in a group therapy. The expected duration of the group therapy is 2 hours. If the patient has undergone either the special or the group therapy a report is written
(activity write report) with an expected duration of 30 minutes. Finally, the rooms for the patient treatment are locked (activity lock rooms) which takes approximately 30 minutes.
examine
lock rooms special
therapy
registration
take blood
write report
Parallel Split
Parallel Join / Xor Split
evaluate
Xor Join patientName
patientName bloodValuebloodValue
bloodVal>50 bloodVal>50
expDur : 15min expDur : 15min
expDur : 15min expDur : 15min
expDur : 1h expDur : 1h
expDur : 5min expDur : 5min
expDur : 4h expDur : 4h
expDur : 30min
expDur : 30min expDur : 30minexpDur : 30min
group therapy
expDur : 2h expDur : 2h bloodVal
<=50 bloodVal
<=50
Fig. 4.Running example represented in ADEPT notation (for details on this notation see46).
Now we assume that we do not know this process, i.e., we can only see events related to the activities shown in Figure 4. These are the events recorded by the corresponding information system in someevent log. A fragment of such an event log could be:
<WorkflowLog xmlns:xsi="http://www.w3.org/2001/XMLSchema-instance"
...
<Process id="Treatment Process"
description="log contains information on patients">
...
<ProcessInstance id="567"
description="Event related to patient John Smith">
<AuditTrailEntry>
<WorkflowModelElement>registration</WorkflowModelElement>
<EventType >offer</EventType>
<Timestamp>2005-01-01T01:00:00.000+01:00</Timestamp>
<Originator></Originator>
</AuditTrailEntry>
<AuditTrailEntry>
<WorkflowModelElement>registration</WorkflowModelElement>
<EventType >start</EventType>
<Timestamp>2005-01-01T01:00:00.000+01:00</Timestamp>
<Originator>S7</Originator>
</AuditTrailEntry>
<AuditTrailEntry>
<Data>
<Attribute name = "patientName">John Smith </Attribute>
</Data>
<WorkflowModelElement>registration</WorkflowModelElement>
<EventType >complete</EventType>
<Timestamp>2005-01-01T01:16:00.000+01:00</Timestamp>
<Originator>S7</Originator>
</AuditTrailEntry>
...
<AuditTrailEntry>
<Data>
<Attribute name = "bloodValue">34 </Attribute>
</Data>
<WorkflowModelElement>take blood</WorkflowModelElement>
<EventType >complete</EventType>
<Timestamp>2005-01-01T01:31:00.000+01:00</Timestamp>
<Originator>D7</Originator>
</AuditTrailEntry>
...
</ProcessInstance>
...
</Process>
</WorkflowLog>
The fragment shows part of an event log stored in the so-called MXML format [24] that is used by ProM [22]. The MXML format is system-independent and using ProMimport it is possible to extract logs from a wide variety of systems, i.e., systems based on products such as SAP, Peoplesoft, Staffware, FLOWer, WebSphere, etc. and tailor-made systems.
The fragment shows that an MXML log contains information about one or more processes. Per process there can be multiple process instances (i.e., cases) as shown by theProcessInstanceelement. In this example each instance refers to the treatment of a particular patient. Within each process instance there may be multipleAuditTrailEntryelements each referring to a particular event. Within each AuditTrailEntry element there can be multiple elements describing the nature and content of the event. The WorkflowModelElementelement refers to some “model object”, e.g., an activity or a subprocess. Note that in the MXML fragment some of the activity names shown in Figure 4 are used. TheEventType element denotes the transactional property of an event. In the fragment we see offer, start, andcomplete as event types. MXML also supports event types such as reassign, withdraw, autoskip, manualskip, suspend, resume, etc.
Note that this information is optional, i.e., in many logs only events of type completeare present because only the commit of a transaction in the system is logged. The elementsTimestamp, Originator, andData are also optional. The Timestampelement refers to the date and time of the event. If no timestamp is given, it is assumed that the event occurred in the order listed. TheOriginator element refers to the resource (i.e., person) executing the event. Using theData
element it is possible to add arbitrary data to each event. The same element can be used to add data to process instances and processes.
Although we have a variety of real-life logs in MXML format (e.g., data of several hospitals), we use an artificially generated log in this paper. The reason is that it allows us the explain the concepts in a clear way. Real-life logs tend to require domain knowledge and typically refer to processes which are much larger and complex than the process shown in Figure 4.
We have used CPN Tools [21] to simulate the process and using ProMimport converted the simulation data of 1000 patients into MXML. Note that ProMim- port allows for the collection and transformation of data from many systems including CPN Tools [33]. We will use this data in the remainder of this paper.
The MXML fragment just discussed is part of this larger event log.
The MXML log will be used to discuss the functionality of ProM [22]. Since ProM has a good coverage of the 6 classes mentioned before, it is representative for what is possible with process mining today. Moreover, the staff assignment miner which we present in this paper has also been implemented in ProM and we will use the same event log to show the application of staff assignment mining.
2.3 Process Discovery
Process discovery refers to the various techniques for control-flow discovery.
ProM currently offers eight plug-ins for discovering processes. These plug-ins use different “target formats”, i.e., different languages to represent the result of the discovery algorithm (e.g., Petri nets, EPCs, heuristics nets).
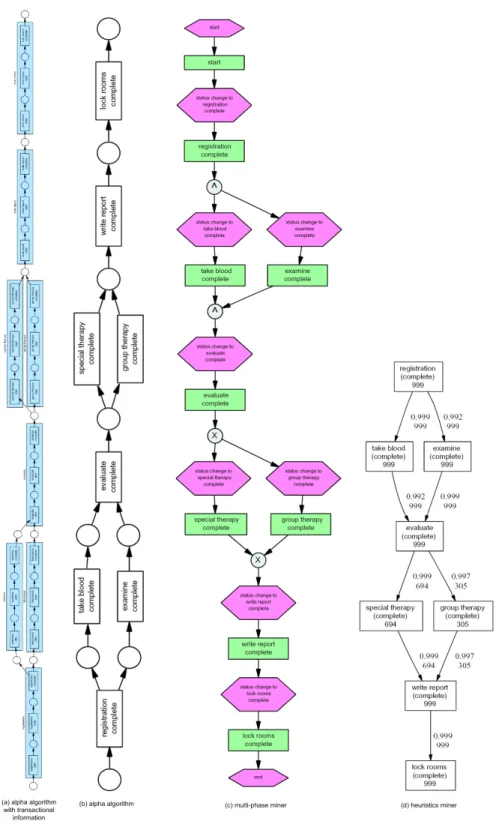
Figure 5 shows four process models obtained using various plug-ins for control- flow discovery present in ProM. Figure 5(a) shows the result obtained by ap- plying the α algorithm [11] to the log with the full transactional information, i.e., each activity characterized by three events in the log: offer, start, and complete. Hence, in the resulting Petri-net each activity is represented by three transitions. Figure 5(b) is also generated by the αalgorithm but now by only considering the complete events. Now it is possible see that the αalgorithm is able to discover the process depicted in Figure 4 without any a-priori informa- tion. Figure 5(c) shows the result of applying the multi-phase miner [23]. This approach first builds a model for every instance and then starts aggregating these instance models. The native format of the multi-phase miner is the EPC language. However, the multi-phase miner can also display its results as Petri nets. In fact, in ProM any Petri net can be converted into an EPC, YAWL model, or heuristics net and vice versa. Figure 5(d) shows a heuristics net discovered by the heuristics miner [59]. The format is also used by the genetic miner [6] and both are able to cope with noise.
2.4 Social Network Mining
Most related to the topic of this paper is thesocial network miner plug-in [7, 8].
Both the social network miner and the staff assignment miner aim to discover models related to the organization. While the staff assignment plug-in, presented
Fig. 5.Based on an analysis of an event log with data on 1000 patients, various mining plug-ins are able to discover the underlying process.
later in Section 3, assumes some a-priori information about the organization (e.g., roles and organization units), the social network miner looks at the infor- mation in the log only. The key information element in the log is theOriginator element that refers to the resource (i.e., person/agent/individual/performer) ex- ecuting the event. Using (1) metrics based on (possible) causality, (2) metrics based on joint cases, (3) metrics based on joint activities, and (4) metrics based on special event types, the social network miner attempts to discover the social relationships and their weight. Metrics based on (possible) causality monitor for individual cases how work moves among performers. One of the examples of such a metric ishandover of work. Within a case (i.e., a process instance) there is a handover of work from individual ito individual j if there are two subsequent activities where the first is completed by i and the second by j. This notion can be refined in various ways as shown in [7, 8]. Metrics based on joint cases ignore causal dependencies but simply count how frequently two individuals are performing activities for the same case. If individuals work together on cases, they will have a stronger relation than individuals rarely working together. Met- rics based on joint activities do not consider how individuals work together on shared cases but focus on the activities they perform. The assumption here is that people doing similar things have stronger relations than people doing com- pletely different things. Each individual has a “profile” based on how frequent they conduct specific activities. There are many ways to measure the “distance”
between two profiles thus enabling many metrics. Metrics based on special event types consider the event type. For example, if i frequently delegates work to j but not vice versa it is likely that iis in a hierarchical relation withj.
Based on these metrics one can determine if there is a social relationship between to individuals, and if so, the importance/weight of this relationship is established. This is then represented as a social network (i.e., a graph where each node represents an individual). Many notions have been defined for such networks [57, 53]. If all other individuals are in short distance to a given node and all geodesic paths (i.e., shortest path in the graph) visit this node, clearly the node is very central (like a spider in the web). There are different metrics for this intuitive notion of centrality. The Bavelas-Leavitt index of centrality is a well-known example that is based on the geodesic paths in the graph. Other related metrics are closeness (1 divided by the sum of all geodesic distances to a given resource) and betweenness(a ratio based on the number of geodesic paths visiting a given node). Another interesting metric is thesociometric status which is determined by the sum of input and output relations. It is also possible to determine cliques, i.e., groups of connected individuals with few relations to people outside this group.
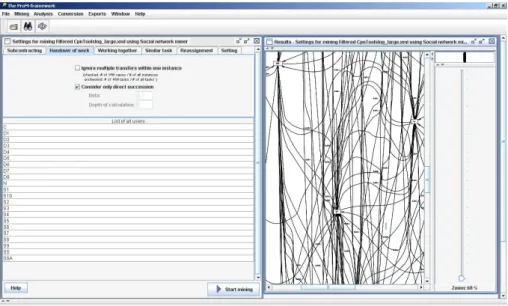
Figure 6 shows a screenshot of the social network miner plug-in of ProM while analyzing the event log with data on 1000 patients. Using the “handover of work” a social network is built. The current social network miner plug-in of ProM offers little support for the analysis of social networks. Instead it provides exports to tools such as Agna and NetMiner.
Fig. 6. Based on an analysis of an event log with data on 1000 patients, the social network miner constructs a social network that can be analyzed using dedicated SNA tools.
D8 Secretary
SS Staff nurse
S4, S7 Nurse for night shift
S1, S2, S3, S4, S5, S6, S7, S8, S9, S10 Nurse
N Night watchman
SS Lead special therapy
D1 Leader neurology
C Head of department
D1, D2, D3, D4, D5, D6, D7 Doctor
SC Deputy chief
SSA Assistant for staff nurse
Agent Role
Fig. 7.Organizational data containing agents and their assigned roles.
Before showing some results obtained using the social network miner plug-in and the social network analysis tool NetMiner, we return to our running example.
In the MXML log the originator element refers to the person executing the corresponding activity, e.g., in the fragment shown before some person referred to asS7executes activityregistrationfor process instance567(i.e., patient John Smith). In this paper, we will refer to S7as the agent performing the activity.
Figure 7 shows the role of each agent. As shown, agentS7is both anurseand a nurse for night shift. When we discuss the staff assignment rules, we will see that these roles are used for work distribution and authorization. For example, activity take blood can only be done by agents having the role nurse or the roledoctor, e.g., nurseS7can take blood but the head of the department head (agentC) cannot. Figure 8 shows some screenshots of NetMiner while analyzing
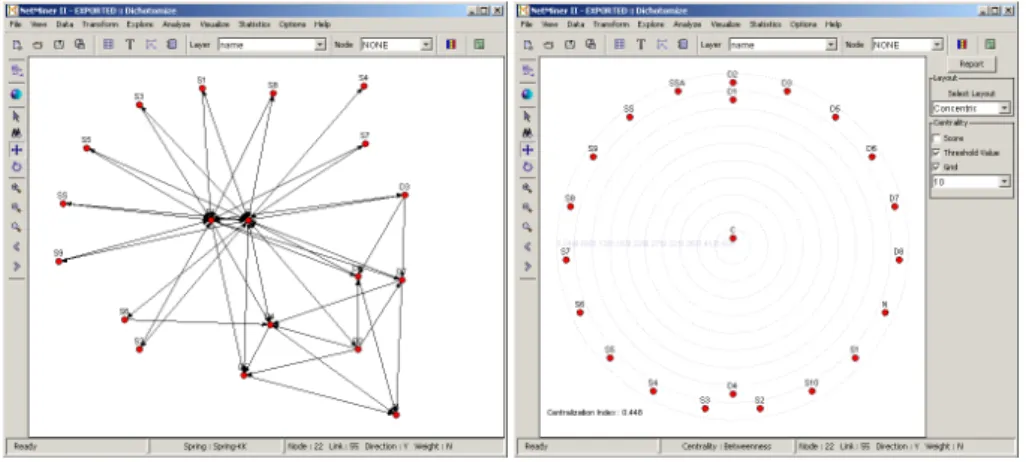
Fig. 8.Screenshots of NetMiner while analyzing the social network obtained in Fig- ure 6.
the social network obtained using ProM. The screenshot on the left shows the social network when only considering the stronger relationships. (The two nodes in the middle are C and D1.) The screenshot on the right shows an analysis of “centrality” using the betweennessmetric (as mentioned before, this ratio is based on the number of geodesic paths visiting a given node). This analysis clearly shows that the head of the department (agent C) is the most central person in the social network. As depicted, doctors D1and D4 are more central than the other doctors. Doctor D1 is also the leader of neurology which puts her more into the center. Doctor D4has the same role as the other doctors, but has additional abilities. In addition to roles (as shown in Figure 7) we will also consider abilities and organizational units. However, we will not elaborate on this now and refer to Section 3 instead.
Tools such as NetMiner offer many techniques to analyze the social network.
For example, based on the MXML log we can analyze the frequencies of ac- tivities and use the hypothesis that actors with a similar “profile” are close in
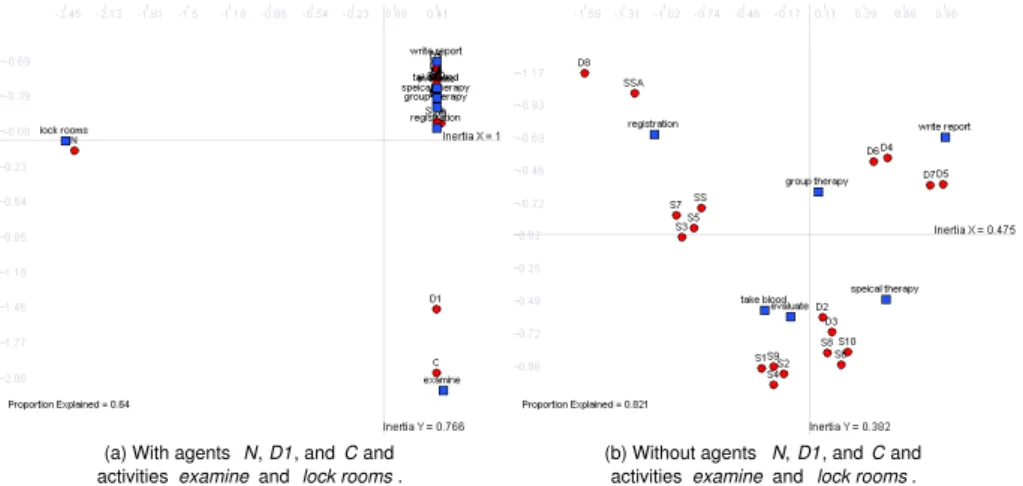
the social network. Based on this we conduct a correspondence analysis [19] as shown in Figure 9. The screenshot on the left-hand side shows the result of cor- respondence analysis based on all actors and all activities. In the figure, boxes represent activities and circles represent agents. Closely positioned nodes (both activities and agents) indicate a strong correspondence while distant nodes are
“more different”. (Although the distance between both types of nodes should not be interpreted as an absolute measure [19].) In other words, in the two- dimensional space shown, similar nodes attract one another while dissimilar nodes repel one another. The left-hand side of Figure 9 shows that the agentN (the night watchman) is quite different from the other nodes and is only close to activity lock rooms. This is correct, he is the only person that can execute activity lock roomsand he is not allowed to execute any other activity. In the other dimension, agents D1 and C, and activity examine are isolated from the rest of the nodes. Again this is a correct conclusion: the head of the department C and the leader of neurologyD1 are the only two that are allowed to execute activity examine. Note that correspondence analysis only analyses the actual execution profile of each actor and is not aware of any staff assignment rules.
The screenshot on the right-hand side of Figure 9 shows the result of corre- spondence analysis after removing the activities and actors just mentioned, i.e., without agentsN,D1andC, and activitieslock roomsandexamine. Again sim- ilar actors are grouped together and actors and activities that are related are positioned close to one another.
(a) With agents N, D1, and C and activities examine and lock rooms.
(b) Without agents N, D1, and C and activities examine and lock rooms.
Fig. 9.Using correspondence analysis to see how activities and agents fit together.
Although Figure 9 illustrates that correspondence analysis can be used to discover staff assignment rules, it is a rather crude mechanism that requires careful human interpretation. Hence, we will usedecision trees instead (this will be explained in Section 3).
2.5 Decision Mining
After discussing plug-ins focusing on the control-flow and organizational perspec- tives, we now apply a plug-in focusing on the data perspective to the running example. This is the decision miner, i.e., a plug-in for the analysis of decision points. Note that using an discovery algorithm (e.g., theαalgorithm [11]) it is possible to discover the control-flow perspective of a process. In such a discov- ered process there are decision points, e.g., in a Petri net places with multiple output arcs and in an EPC (X)OR-split connectors denote such decisions. The decision miner aims to discover the data influencing this decision using decision trees.
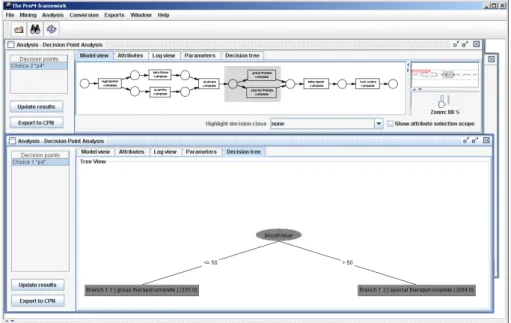
Fig. 10.Screenshots of the decision miner while analyzing the only decision point in the running process.
In the running example there is only one decision, i.e., the choice between special therapyandgroup therapy. This decision is made when completing activity evaluate. At this point in time, data such as the patient name, blood value, etc. are known. Clearly, the name of the patient is not relevant for the decision but the blood value is. This is discovered by the decision miner as shown in Figure 10. The two screenshots show that a decision point can be selected and analyzed. The result is depicted as a decision tree. In this example, the choice betweenspecial therapyandgroup therapyonly depends on the data elementbloodValue (with 50 being the split value).
2.6 Conformance Checking
So far the focus has been on discovery, i.e., discovering a process model, a social network, or a decision tree. To conclude this section we discuss two plug-ins that focus on conformance rather than discovery. The first plug-in we present is the conformance checker.
Fig. 11.Screenshot of the conformance checker.
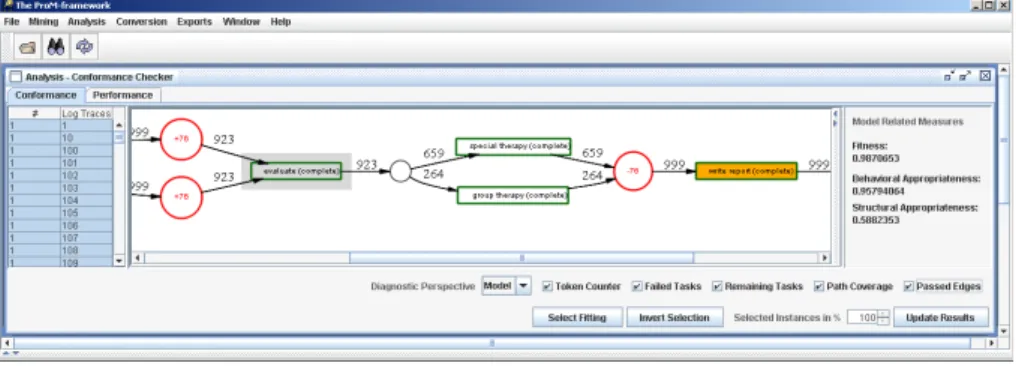
To present we have created an event log containing some deviations. First of all, for some exceptional cases we inserted a new activitylab testthat follows activity examine. Moreover, it is also possible that after taking the blood (ac- tivitytake blood), the process immediately progresses towrite report(again only for some exceptional cases). Now assume that the hospital considers the ini- tial process as shown in Figure 4 to be the desirable process (i.e., the reference model). Using the conformance checker we can compare a real log with some a-priori model. Figure 11 shows the result. The screenshot shows the Petri net model of the initial process and highlights the points where the observed behav- ior deviates from the desirable behavior. When loading the conformance checker, a warning is given that activitylab testdoes not appear in the process model.
After this warning, the conformance checker “replays” the history as recorded in the MXML log and notes the deviations related to the skipping of activities evaluateand special/group therapy. As shown in Figure 11, there were 76 cases where evaluatewas supposed to be executed but instead directly write reportwas executed. Moreover, the conformance checker measures the fitness, structural appropriateness, and behavioral appropriateness. The fitness of the model is 0.98, i.e., 98 percent of the events in the log can be “explained” by the model. See [50] for more information about these metrics.
2.7 Property Checking
The conformance checker assumes some a-priori process model. In some cases, there is not a complete a-priori process model but merely a set of desirable or
undesirable properties. For example, “a request should always be followed by a response within a time period of 10 days”, “under no circumstances both activ- ities should be executed”, or “two specific activities should never be executed by the same person”. Such properties, also referred to asbusiness rules, can be expressed intemporal logic [40]. The ProM framework provides anLTL checker that can check properties expressed in Linear Temporal Logic (LTL) [2]. LTL is a specific temporal logic and we have extended this on the basis of all possible information in MXML logs, i.e., in the LTL checker is is easy to refer to data, timestamps, agents, etc. Properties in the LTL checker can be parameterized and re-used, e.g., the 4-eyes principle (“two specific activities should never be executed by the same person”) is defined once and can be re-used for any event log and serves as a basis for derived formulas (cf. [2]).
Fig. 12.Screenshot of the LTL checker plug-in.
Like the conformance checker the LTL checker aims at conformance rather than discovery. Therefore, we again use the event log with deviations. Using the LTL checker it is easy to find both types of deviations. Figure 12 shows the analysis of the property that each person should get therapy, i.e., at least one of the activities group therapyand special therapyshould be executed for each patient. As Figure 12 shows, there are 76 cases where this is not the case and for patient 131 it is shown that indeed the activities group therapy and special therapyare skipped becauseexamineis followed bywrite report.
The LTL checker can also be used to ask questions related to the organiza- tional perspective. For example, we can investigate whether the 4-eyes principle applies to activities examineand evaluate. Using the LTL checker we discov-
ered that for 25 cases, both activities are executed by the same person. By again applying the LTL checker to these 25 cases we find that D1 is the only person violating the 4-eyes principle with respect to activitiesexamine andevaluate.
This shows that the LTL checker is a highly generic tool also useful for inves- tigating staff assignment rules. However, using the LTL checker one can only check rules that have been explicitly formulated by the user of ProM. Using the StaffAssignmentMinerpresented in the next section, no a-priori model/rule is needed (only the organizational context and the log are taken as input).
3 Mining Staff Assignment Rules
In this section we provide the basic definitions of organizational models and staff assignment rules (cf. Section 3.1). They are necessary for introducing the staff assignment mining approach in Section 3.2 as well as for the evaluation of the simulation results in Section 4.2.
3.1 Organizational Framework
In the following an (organizational) meta model is presented which is comparable to existing RBAC models (e.g., [27, 47]). It can be used for describing organi- zational entities and the relations between them (cf. Figure 13). In this paper we restrict our considerations to the basic entity types Organizational Unit, Role,Ability, andAgent, and to the particular relation types existing between them (e.g., agent A1belongs to organizational unit O1, role R1 specializes role R0, etc.).
Org.
Unit
is subordinated
Agent Role
has1 (0, n)
Ability
has2 (0, n) specializes
(0, n) (0, 1)
(0, n) (0, 1)
(0, n) has3 (0, n) (0, n)
has4
Ability
(0, n)
(0, n)
Fig. 13.Organizational meta model
Based on this meta model, we formalize the notion oforganizational models.
We have also developed an XML format for storing such models. Since the focus is on staff assignment mining rather than on organizational modeling, we do not consider the cardinalities depicted in Figure 13.
Definition 1 (Organizational Model). An organizational model is a tuple OM = (Agents,Roles,Abilities,OrgUnits,has1,has2,has3,has4,is subordinated, specializes), where:
– Agents is the set of agents (i.e., the people performing activities), – Roles is the set of roles,
– Abilities is the set of abilities,
– OrgUnits is the set of organizational units,
– has1 ⊆Agents×Roles is the relation linking agents to roles, – has2 ⊆Agents×Abilities is the relation linking agents to abilities,
– has3 ⊆ Agents×OrgUnits is the relation linking agents to organizational units,
– has4 ⊆Abilities×Roles is the relation linking abilities to roles,
– is subordinated⊆OrgUnits×OrgUnits defines the organizational hierarchy, and
– specializes⊆Roles×Roles defines the role hierarchy.
As part of the organizational model used in our example we have already introduced the set of agents and their assigned roles in Figure 7. Additionally, the agents may belong to organizational units (e.g., agentsSC,C, andNbelong to organizational unithospital, cf. Figure 14). The roles can be specialized (e.g., astaff nurseis anurse) and the organizational units can be subordinated to other organizational units (e.g., organizational unitadministrationis subordi- nated to organizational unithospital) as depicted in Figure 14. Due to space restrictions we omit the associations between agents and abilities. Moreover, for simplicity reasons we ignore relation has4. (This relation has only been added to explicitly check the consistency between the roles and abilities of an agent.)
SS, SSA, S1, S2, S3, S4, S5, S7, S8, S9, D4, D5, D6, D7
Therapy
S6, S8, S10, D2, D3 Special therapy
D1, D6 Neurology
SC, C, N Hospital
SSA, C, SC, N, D8 Administration
Agent OrgUnit
Administration, Special therapy, Therapy
Hospital
Subordinated OrgUnits OrgUnit
Staff nurse Nurse
Specialized Role Role
Fig. 14. Organizational data containing organizational units and belonging agents, specialization relation between roles, and subordinated organizational units.
To be able to use the relations mentioned in Definition 1, we define the following basic notations.
Definition 2 (Relations and Functions). Let U be some universe of dis- course and R⊆U×U some relation. For anyu∈U:R(u) ={x∈U |(u, x)∈ R}.R∗ is the transitive closure ofR. Letf ∈A→B be a function with domain A and rangeB. For any set X ⊆A:f(X) ={f(x)|x∈X}.
These notations can be applied to the relations of Figure 7, e.g.,has1(staff nurse) is the set of agents with rolestaff nurse.is subordinated∗is the transi- tive closure of the organizational hierarchy.has3(hospital) is the set of agents in hospital. These are the agentsSC,C, andN. However, the organizational unit hospitalcontains other units. Usinghas3(is subordinated∗(hospital)) we ob- tain people that are indirectly associated to the organizational unit hospital, e.g., the agents in therapy. Using has1(specializes∗(nurse)) we obtain people that are indirectly associated to the role nurse, i.e., also people having role staff nurse.
Based on the organizational entities and relations described byOM we can define staff assignment rules in order to specify the assignment of agents to process activities. Since the structuring and semantics of the staff assignment rules is fundamental for the (semi-)automated derivation of rule adaptations, we consider this issue in more detail. We distinguish between elementary and complex staff assignment rules.
Definition 3 (Elementary Staff Assignment Rule). Let OM be an orga- nizational model as defined in Definition 1. An elementary staff assignment rule EARon OM is defined as follows:
EAR≡(EAR1 ←− (Role = r))|(EAR2 ←− (Ability = a))| (EAR3 ←− (OrgUnit = o))|(EAR4 ←− (Role+ = r))|
(EAR5 ←− (OrgUnit+ = o))| (EAR6 ←− (Agent = ag)).
For each possible elementary staff assignment rule we define the set of all agents that qualify (we call this the valid agent set or VAS for short):
– VAS(OM,EAR1) =has1(r)is the set of agents having role r, – VAS(OM,EAR2) =has2(a)is the set of agents having ability a,
– VAS(OM,EAR3) =has3(o) is the set of agents in organizational unito, – VAS(OM,EAR4) =has1(specializes∗(r))is the set of agents (indirectly) hav-
ing roler, and
– VAS(OM,EAR5) =has3(is subordinated∗(o))is the set of agents (indirectly) in organizational unito
– VAS(OM,EAR6)= {ag}.
In order to enable the definition of more complex staff assignment rules we allow for the composition of existing rules (cf. Definition 4). For this purpose the following operators can be used: negation, conjunction, and disjunction.
Definition 4 (Staff Assignment Rule). Let OM be an organizational model (cf. Definition 1). A staff assignment ruleARis defined recursively:
AR≡EAR| NAR| CAR|DAR, where
– EARis an elementary staff assignment rule (cf. Definition 3), – NAR ←− (NOT (AR)) whereARis a staff assignment rule,
– CAR ←− (AR1 AND AR2)with AR1and AR2are staff assignment rules, and – DAR ←− (AR1 OR AR2)with AR1and AR2are staff assignment rules.
For each possible elementary staff assignment rule we define the set of all agents that qualify:
– VAS(OM,EAR)is defined in Definition 3,
– VAS(OM,NAR) =Agents\VAS(OM,AR)is the set of agents not qualifying forAR,
– VAS(OM,CAR) =VAS(OM,AR1)∩VAS(OM,AR2)is the set of agents qual- ifying forAR1andAR2,
– VAS(OM,DAR) =VAS(OM,AR1)∪VAS(OM,AR2)is the set of agents qual- ifying forAR1orAR2.
Definitions 3 and 4 define the set of agents qualifying for any staff assignment rule. Given a staff assignment rule AR, VAS(OM,AR) is the set of qualifying agents.
For more details on the framework for defining and changing organizational models and staff assignment rules see [47].
3.2 Decision Tree Learning
In this section we provide background information on staff assignment mining based on decision tree learning as introduced in [39]. Since staff assignment rules are supposed to identify the set of real performers of a given activityx, the challenge is to determine combinations of properties that distinguish performers from non-performers. Thus, the problem of deriving the rules can be interpreted as an inductive learning task from positive and negative examples.2Unlike with control-flow mining negative examples are directly given for our problem: every non-performer can serve as a negative example. First, we define the notion of positive and negative examples for this learning problem.
Definition 5 (Positive/Negative Examples). Let A be a set of agents and let X be the total set of activities. Then performer is a classification function which determines whether a given agent a∈ A has worked on any instance of activityx∈X or not: performer :A×X→ {True,False}
performer(a, x) =
½ True if a has performed an instance of x False otherwise
The triple (x, a,performer(a, x)) represents an “example”. We further distin- guish between positive examples, i.e., (x, a,True), and negative examples, i.e.,
2 Note that we need to assume some notion of completeness, i.e., if an agent is able to perform an activity, it will be observed. However, this notion of completeness seems to be realistic and is much weaker than the notions of completeness typically used for control-flow mining.
(x, a,False). Note that due to this definition, agents performing x multiple times will be associated with a respective number of examples. For every non-performer a negative example can be generated.
Based on the examples the objective is to derive a hypothesis h(a) which approximates the classification function performer(a). This problem belongs to supervised learning[34] since we have predefined classes. Many learning methods can be applied to solve this problem. We have chosen to adapt decision tree learning [18].
Decision tree learning is one of the most widely-used methods of inductive inference. It can be employed for attribute-based learning of disjunctive concepts.
This method is simple and explicitly enables graphical representations. This constitutes an advantage when developing a user-friendly graphical interface for a respective staff assignment mining tool. Furthermore, decision tree learning also incorporates methods for handling noise data and continuous attribute values.
All entities of an organizational model can be used as testing attributes in order to separate the performers from the non-performers of a given taskx.
Staff assignment rules can be derived from building decision trees. Starting at the root an attribute is chosen in order to separate the example set. Which attributes are chosen and in which order is discussed in the following. This pro- cedure is continued recursively for the child nodes until only examples from one class (indicated by the ‘+’ and the −’ set are left or no attributes are left).
The ‘+’ set represents the class of performers while the ‘−’ set represents the class of non-performers. Depending on whether they are related to an organi- zational entity, examples (i.e., agents) are assigned to the “yes”-child-node or
“no”-child-node respectively. Note that for every agent it can be determined whether the agent is related to an organizational entity or not. From a decision tree if-then-rules or rules in disjunctive normal form (DNF) can be easily de- rived. The conjunction of attribute values of a path from a leaf-node with the target class to the root represents the if-part of the if-then rule or a disjunction element of the DNF.
However, our objective is to mine general profiles of performers with as few conjunction elements as possible. Finding decision trees representing minimal rules is of NP-hard complexity [44]. For guiding the search, i.e. chosing an at- tribute, the metricinformation gain[45, 44] is used. Theinformation gainmet- rics is based on entropy calculations. The formulas forentropy andinformation gain are given below.Sis an example set,aan attribute, andp+andp−indicate the proportion of positive and negative examples respectively.Syes andSno are the example sets assigned to the “yes”- or the “no”-child of the node belonging toS, respectively.
The entropy is a metrics for the homogeneity of a set. At every separation step the attribute with the bestinformation gainvalue is chosen. Thus, the decision tree algorithm tries to achieve the best split in every step.
entropy(S) =−p+log2p+−p−log2p− (1)
information gain(S, a) =entropy(S)−|Syes|
|S| entropy(Syes)−
|Sno|
|S| entropy(Sno) (2)
For further information on decision trees and metrics please refer to [45, 44, 41].
Generally more than one decision tree can be derived. Therefore, it is impor- tant to offer alternative rules to the process engineer who then evaluates them.
In order to extract more than one rule backtracking is needed. Again,informa- tion gain can be used in order to chose the suitable attributes. Instead of using only the best separating attribute thek-best attributes can be used, where kis a configurable parameter.
3.3 Implementation within ProM
The staff assignment mining approach based on decision tree learning is realized as plug-in of the ProM framework (called StaffAssignmentMiner). When this plug-in is started it imports an organizational model (represented as XML file) and process execution logs represented within the ProM MXML audit trail for- mat [24]. After the import users can specify certain parameters for the mining process like the activity for which the staff assignment rule is to be mined as well as the number of decision trees to be generated (e.g., parameter “k best attributes”, cf. Figure 15). The decision trees and the resulting staff assignment rules are visualized as depicted in Figure 16. For an a-posteriori analysis, it is possible to specify thresholds for the number of performers / non-performers in order to prune the decision trees accordingly (cf. Figure 15).
4 Diagnosis and Optimization of Staff Assignment Rules
Using the StaffAssignmentMiner plug-in of the ProM framework, the ”real”
staff assignment rules (which are reflected by the execution logs) can be mined and compared with the staff assignment rules defined for the underlying process afterwards. Based on this comparison, possible deviations between existing and mined staff assignment rules can be automatically detected (we call this staff assignment rules diagnosis). Section 4.1 illustrates the diagnosis phase based on the simulation data for the patient treatment process (cf. Figure 4).
However, the results of comparing existing and mined staff assignment rules have to be interpreted afterwards. The goals are 1) to either comfirm the existing staff assignment rules or to come up with suggestions for improving them and 2) to learn more about the work practice of the analyzed organization (e.g., to learn about substitution behavior among colleagues). Section 4.1, first of all, motivates the different relations between existing and mined staff assignment rules by presenting the comparison results for the patient treatment process.
Fig. 15.Staff assignment plug-in for the ProM framework.
Then, in Section 4.2, the possible syntactical relations between existing and mined staff assignment rules are formalized to provide a basis for an automatic comparison. How these syntactical relations can be interpreted is presented in Section 4.3. The whole approach is finally extended with respect to exceptional agent behavior in Section 4.4.
4.1 Simulation-Based Analysis of Staff Assignment Mining
Table 1 summarizes the original and mined staff assignment rules for all ac- tivities of our example treatment process (cf. Figure 4). In order to be able to compare the original and the mined staff assignment rules we logically remove those parts from the mined staff assignment rules which are built by redundant FALSEbranches in the decision tree (i.e., the valid agent set for the staff assign- ment rule does not change when removing the part associated with the FALSE branch). For example, for activity examine staff assignment mining yields the following rule:
SARexaminemined ←−((Role="head of department") OR
(Role="leader neurology") AND NOT (Role="head of department"))).
Since the valid agent sets of rulesEAR1←−(Role="head of department")and EAR2←−(Role="leader neurology")are disjoint over the underlying organi- zational model, ruleEAR3←−(NOT (Role="head of department"))is redun- dant. Therefore we (logically) remove these parts from the mined staff assignment rules in order to provide a suitable basis for the following evaluation.
In the remainder of this section we try to conclude certain relations between original and mined staff assignment rules which are then formalized in Section 4.2. These relations build the basis for suggesting optimizations for the pre- defined staff assignment rules in the following.
Table 1.Original and resulting staff assignment rules after simulation.
Activity x, original and mined staff assignment rules SARxoriginal/ SARxmined x =registration
SARregistration
original ←− ((Role="secretary") OR ((Ability="edv") AND (Ability="english"))) SARregistration
mined ←− ((Ability="edv") AND (Ability="english")) x =examine
SARexamineoriginal ←− ((Role="head of department") OR (Role="leader neurology")) SARexaminemined ←− ((Role="head of department") OR (Role="leader neurology")) x =take blood
SARtakebloodoriginal ←− ((Role="doctor") OR (Role="nurse"))
SARtakebloodmined ←− (NOT (Role="assistant for staff nurse")) AND (NOT (OrgUnit="administration")) x =evaluate
SARevaluateoriginal ←−((Role="doctor") OR (Role="nurse"))
SARevaluatemined ←−(NOT ((Role="assistant for staff nurse") AND (NOT (OrgUnit="administration"))) x =special therapy
SARspecialtherapy
original ←− ((Role="doctor") OR ((Role="nurse") AND (OrgUnit="special therapy"))) SARspecialtherapy
mined ←− ((Role="doctor") OR (NOT (Role="doctor") AND (OrgUnit="special therapy"))) x =group therapy
SARgrouptherapy
original ←− ((Role="doctor") OR Role=("assistant for staff nurse") OR (Role="staff nurse")) SARgrouptherapy
mined ←− ((Role="doctor") OR (Role="assistant for staff nurse") OR (NOT (Role="doctor") AND (Ability="pharmaceutic knowledge") AND (Ability="edv"))) x =write report
SARwritereport
original ←− ((Role="doctor") OR (OrgUnit="therapy")) SARwritereport
mined ←− ((Role="doctor") OR (OrgUnit="therapy")) x =lock rooms
SARlockroomsoriginal ←−(Role="night watchman") SARlockroomsmined ←−(Role="night watchman")
From Table 1 we can see that for some activities the mined staff assignment rule exactly matches the original one (this holds for activities examine, write report, and lock rooms). Apparently, an exact match between original and mined staff assignment rule is more likely if only a small percentage of all agents qualifies for them (for activities examine, write report, and lock rooms the percentage of qualifying agents ranges from 4% and 17%).
For other activities the mined staff assignment rules differ from the orginal ones. This is, for example, the case for activity registration as depicted in Figure 16. The first separating attribute is given by abilityedv, the second one
by abilityenglish. The resulting staff assignment rule is SARregistration
mined ←−((Ability="edv") AND (Ability="english"))
which corresponds to the second part of the original staff assignment rule (cf.
Table 1). The other part (i.e.,Role="secretary"), however, is redundant since it does not influence the valid agent set. Therefore it is not taken into account by the mining algorithm, even if we select more thank= 1 best attributes for analysis. In this case the staff assignment mining filters outredundant parts of the staff assignment rule and thereforerefines the original staff assignment rule.
Fig. 16.Decision tree and staff assignment rule for activityregistration.
For the remaining activities staff assignment mining results in so-calledcom- plementarystaff assignment rules; i.e., the valid agent set for the original and for the mined staff assignment rules are the same. However, the mined staff assign- ment rules are (partially) build up by negating (elementary) staff assignment rules of the original rules. One example is the mined staff assignment rule for activity evaluate(cf. Figure 17). The resulting staff assignment rule
SARevaluatemined ←− (NOT (Role="assistant for staff nurse")) AND (NOT (OrgUnit="administration"))
excludes all agents which do not have roledoctoror rolenurse. This, however, exactly corresponds to the negation of original staff assignment rule
SARevaluateoriginal ←− ((Role="nurse") OR (Role="doctor")).
When analzing simulation data we observe that complementary staff assignment rules are derived if a high percentage of all agents qualifies for the original staff
assignment rule (i.e., 78,3% for
SARevaluateoriginal ←− ((Role="nurse") or (Role="doctor"))).
Fig. 17.Mining results for activityevaluate.
4.2 Syntactical Comparison of Staff Assignment Rules
In the previous section, different relations between original and mined staff as- signment rules have been observed, comprising exact match, refinement, and complement. In this section, we provide a formalization based on the valid agent sets of original and mined staff assignment rules (cf. Definitions 3 and 4). In general, the following relations may occur as depicted in Figure 18. First of all, the valid agent sets may be equal for original and mined staff assignment rule (a). We denote this asagent match. In case (b) the mined staff assignment rule specifies a subset of the valid agent set of the original rules. Since only a subset of the agents qualifying for the original staff assignment rule actually works on the affected activity, this may indicate some kind of refinement (therefore we denote this as agent refinement). Consequently, the mining result can be suggested as optimization for the pre-defined rule. Contrary, the mined staff assignment rules may also specify a superset of the valid agent sets of the original staff assignment rules (i.e.,
VAS(OM, SARoriginal)⊂VAS(OM, SARmined), cf. Figure 18(c)). This happens if agents have exceptionally worked on the affected activity, for example, as substi- tutes. This case is denoted asagent expansion. Case (d) (calledagent mismatch