https://doi.org/10.5194/bg-14-4767-2017
© Author(s) 2017. This work is distributed under the Creative Commons Attribution 3.0 License.
Primary production sensitivity to phytoplankton light attenuation parameter increases with transient forcing
Karin F. Kvale1and Katrin J. Meissner2
1GEOMAR Helmholtz-Zentrum für Ozeanforschung Kiel, Düsternbrooker Weg 20, 24105 Kiel, Germany
2Climate Change Research Centre and ARC Centre of Excellence for Climate System Science, University of New South Wales Sydney, Sydney, New South Wales 2052, Australia
Correspondence to:Karin F. Kvale (kkvale@geomar.de) Received: 31 March 2017 – Discussion started: 13 April 2017
Revised: 3 September 2017 – Accepted: 21 September 2017 – Published: 25 October 2017
Abstract. Treatment of the underwater light field in ocean biogeochemical models has been attracting increasing inter- est, with some models moving towards more complex param- eterisations. We conduct a simple sensitivity study of a typi- cal, highly simplified parameterisation. In our study, we vary the phytoplankton light attenuation parameter over a range constrained by data during both pre-industrial equilibrated and future climate scenario RCP8.5. In equilibrium, lower light attenuation parameters (weaker self-shading) shift net primary production (NPP) towards the high latitudes, while higher values of light attenuation (stronger shelf-shading) shift NPP towards the low latitudes. Climate forcing mag- nifies this relationship through changes in the distribution of nutrients both within and between ocean regions. Where and how NPP responds to climate forcing can determine the magnitude and sign of global NPP trends in this high CO2 future scenario. Ocean oxygen is particularly sensitive to pa- rameter choice. Under higher CO2concentrations, two simu- lations establish a strong biogeochemical feedback between the Southern Ocean and low-latitude Pacific that highlights the potential for regional teleconnection. Our simulations serve as a reminder that shifts in fundamental properties (e.g.
light attenuation by phytoplankton) over deep time have the potential to alter global biogeochemistry.
1 Introduction
Treatment of marine light availability for photosynthesis in biogeochemical compartments of ocean general circulation models (OGCMs) has largely avoided careful scrutiny un-
til recently (e.g. Dutkiewicz et al., 2015; Kim et al., 2015;
Gregg and Rousseaux, 2016). These models typically use simplified, empirically based parameterisations of phyto- plankton growth rates related to photosynthetically available radiation (PAR) based on the state of the science in the 1970s and 1980s. The OGCM in the University of Victoria Earth System Climate Model (UVic ESCM; Weaver et al., 2001;
Eby et al., 2009) is one example. In it, the irradiance (I) at each depth level is calculated as
I=Iz=0PARexp(−kwez−kc ez
Z
0
(P+Diaz)dz) (1)
·
1+ai(exp(−ki(hi+hs))−1)
(Schmittner et al., 2005; Kirk, 1983), where PAR stands for photosynthetically available radiation,kw,kc, andki are light attenuation coefficients for water, phytoplankton (dia- zotrophs and general phytoplankton), and ice,ezis the effec- tive vertical coordinate,aiis the fractional sea ice cover, and hiandhsare calculated sea ice and snow cover thicknesses.
Phytoplankton concentration (P and Diaz) is expressed in a base unit of mmol N m−3. Light attenuation coefficientskw
andkihave the unit of m−1, but light attenuation by phyto- plankton is dependent on phytoplankton concentration (Kirk, 1975) and kc is expressed in units of (m mmol N m−3)−1. However,kccannot be considered to represent the light at- tenuation of phytoplankton only, but also represents the at- tenuation of constituents that are assumed to co-vary with phytoplankton (i.e. particulate and dissolved inorganic and organic materials). Light attenuation coefficients are classi- fied as apparent optical properties (AOP) because they rep-
resent the combined effect of the inherent optical properties (IOP) of the medium (e.g. seawater or phytoplankton cells) and the optical properties of the radiation field (see Kirk, 1983; Falkowski and Woodhead, 1992, and associated refer- ences). Early tests of kc (e.g. Fasham et al., 1990) demon- strated low model biomass sensitivity to parameter value choice, and this has been the prevailing wisdom of biogeo- chemical modellers for over 20 years. Estimates of kc vary widely: for example, 0.014 m2(mg Chl a)−1 (generally ap- plicable, Lorenzen, 1972), 0.041 m2(mg Chla)−1(Southern Ocean, Bracher and Tilzer, 2001), or a range from 0.006 to 0.015 m2(mg Chla)−1assuming all phytoplankton represent mixes of specific species of dinoflagellates, calcifiers, or di- atoms (Falkowski et al., 1985). Even the assumption thatkc
varies predictably with chlorophyll concentration can be con- sidered highly simplistic because the co-varying constituents might cause this ratio to fluctuate (Siegel et al., 2005). In practice, any value assigned to kc is going to be highly model-dependent (e.g. 0.058 m2(mg Chla)−1in Wang et al., 2008) because of the wide range of observational estimates and the necessary conversion from chlorophyll to model nu- trient units, which requires some assumptions that depend on model structure.
While it was recognized early on that a rigorous descrip- tion of the spectral composition of the underwater light field must separate effects of IOP from the radiation field, early measurements emphasized AOP because of technological limitations as well as for a lack of data resolving the IOP of seawater constituents (Kirk, 1983). Research into the IOP of these constituents has since benefited from continuously improving analytical tools, including satellite remote sens- ing, whose algorithms depend on their resolution (Sathyen- dranath and Platt, 2007). Phytoplankton IOP are species- specific (e.g. Stramski et al., 2001). Of the major seawa- ter constituents, detrital particles contribute the most to light scattering and attenuation, and picoplankton are the primary phytoplankton light absorbers (Stramski et al., 2001; Fujii et al., 2007), though their contribution to absorption is possi- bly exceeded by coloured dissolved organic matter (CDOM) (Siegel et al., 2005; Fujii et al., 2007).
Recent work has highlighted what we potentially miss in our OGCMs, and hence our earth system models (ESMs) as well, by neglecting explicit radiative transfer and IOP.
Decomposing the calculation of underwater irradiance into IOP, resolving a variable number of radiative wavebands, and then testing three parameterisations of light limitation of phytoplankton growth in a one-dimensional ecosystem model comparable to observational data show that a model resolving multiple wavebands and a spectral sensitivity in photosynthesis outperformed a simple parameterisation sim- ilar to Eq. (1) (Kettle and Merchant, 2008). Choice in pa- rameterisation of spectral resolution can contribute percent- age errors of up to 200 % (Kettle and Merchant, 2008). Not including a radiative transfer model in an OGCM can re- duce global nitrate by 33 % and chlorophyll by 24 %, and
bring about large changes in phytoplankton biogeography, even when there is no change in total irradiance (Gregg and Rousseaux, 2016). Dutkiewicz et al. (2015) offer the most complicated model analysis, and demonstrate that explic- itly resolving radiative transfer and the IOP of phytoplank- ton types, detritus, and CDOM in a three-dimensional ocean model can improve model performance against observational data. Their sensitivity analysis demonstrates complex feed- backs between light, phytoplankton attributes, and biogeo- chemistry (Dutkiewicz et al., 2015).
Explicit radiative transfer and fully resolved IOP add com- putational expense to already expensive ESMs. Since em- pirically based AOP parameterisations are still widely used and economical, it is useful to test their limitations and sen- sitivities. Including light attenuation by phytoplankton in an OGCM amplifies the seasonal cycle of temperature, mixed layer depth, and ice cover by about 10 % over neglecting it altogether (Manizza et al., 2005). Gnanadesikan and Ander- son (2009) find the inclusion of light attenuation by chloro- phyll in an OGCM alters physical water mass characteristics, including a decrease in subsurface temperatures by over 2◦C at the low latitudes. Kim et al. (2015) explore the biogeo- chemical consequences of differentiating light attenuation by CDOM and detrital particles from that of chlorophyll in an ESM and find these components increased surface phyto- plankton biomass by reducing levels of light at depth, which reduced deeper production and made more nutrients avail- able at the surface. Two model simulations with and without CDOM and detrital particle light attenuation differ by 9 % in the global average biomass and 7 % in the global carbon ex- port flux at 200 m depth (Kim et al., 2015). These are modest changes with respect to other production and export param- eters (e.g. Kwon et al., 2009 found a 5 Gt C yr−1, or 50 %, increase in global carbon export by raising the export trans- fer efficiency exponent by 0.4), though regional sensitivities are stronger (Kim et al., 2015).
All of the studies mentioned above make their compar- isons using models to which pre-industrial forcings are ap- plied. Dutkiewicz et al. (2015) highlighted the potential for complex feedbacks arising due to model treatment of light and optical properties; therefore, it stands to reason that such feedbacks may be compounded under climate change. A re- cent bug fix in the implementation of Eq. (1) in the UVic ESCM prompted a hasty equilibrated model re-evaluation, which then led to our more thorough assessment including climate change. Future implementation of a more complex radiative transfer and phytoplankton IOP model may be jus- tified based on the conclusions of the authors above (e.g.
Dutkiewicz et al., 2015); however, the UVic ESCM (and other models of similar structure) is widely used in its current form and it is therefore worthwhile assessing and reporting on its current sensitivities. The aim of our study is to assess the sensitivity of modelled net primary production to phyto- plankton light attenuation parameter value in an ESM using pre-industrial equilibrated, historical, and projected climate
forcing. The drivers of net primary production are of scien- tific interest as they may respond to anthropogenic climate change (e.g. Kvale et al., 2015; Laufkötter et al., 2015). To our knowledge, such a simple assessment has not appeared in the peer-reviewed domain despite there being a wide range of phytoplankton light attenuation parameter values currently in use (described in more detail below) and a demonstrated sensitivity of primary production, export, and nutrients in OGCMs and ESMs to how the underwater light field is mod- elled (described above).
2 Methods
The University of Victoria Earth System Climate Model (UVic ESCM, Weaver et al., 2001; Eby et al., 2009) ver- sion 2.9 is a coarse-resolution (1.8◦×3.6◦×19 ocean depth layers) ocean–atmosphere–biosphere–cryosphere–geosphere model. The biogeochemical component (Schmittner et al., 2005, 2008; Keller et al., 2012) is a nutrients–phytoplankton–
zooplankton–detritus (NPZD) model with two phytoplank- ton types (general phytoplankton and diazotrophs), one zoo- plankton type, and chemical tracers nitrate, phosphate, dis- solved inorganic carbon, alkalinity, and oxygen. Iron limi- tation is accounted for using a seasonally variable mask of dissolved iron concentrations in the upper three ocean lay- ers (Keller et al., 2012). The biogeochemistry is comprehen- sively assessed in Keller et al. (2012); however, the model has since been updated with several bug fixes and minor ad- justments. Only one of the bug fixes is relevant to our study.
In previous published versions of the model, the depth was incorrectly calculated for the light availability equation in a way that resulted in too much light in the first ocean depth level. This calculation is corrected here.
Our study examines model biogeochemical sensitivity to a spread of kcvalues at both equilibrium in a pre-industrial climate (atmospheric CO2concentration of 283.8 ppm) and a future projection. We use historical atmospheric CO2con- centrations, agricultural land cover, volcanic radiative forc- ing, sulfate aerosol, and CFC concentrations to force the model, as well as changes in land ice and solar forcing from years 1800 to 2005 following Machida et al. (1995), Battle et al. (1996), Etheridge et al. (1996), Etheridge et al. (1998), Flückiger et al. (1999), Flückiger et al. (2004), Ferretti et al.
(2005), and Meure et al. (2006). From years 2005 to 2300 the simulations were forced using increasing CO2and non- CO2greenhouse gas concentrations, projected changes to the fraction of the land surface devoted to agricultural uses (cal- culated to year 2100 by Hurtt et al., 2011, and then held con- stant after), and changes in the direct effect of sulfate aerosols following “business-as-usual” RCP scenario 8.5 (RCP8.5, Riahi et al., 2007; Meinshausen et al., 2011). Solar insola- tion at the top of the atmosphere, wind stress, and wind fields varied seasonally (Kalnay et al., 1996), and the wind fields were geostrophically adjusted to air temperature anomalies
(Weaver et al., 2001). The sediment and weathering models (Meissner et al., 2012) were not used. Model equilibration was achieved by integrating over 10 000 years prior to appli- cation of climate forcing.
The simplistic nature of Eq. 1 makes our study highly idealized. Parameterkw represents light attenuation of wa- ter and is fairly well constrained to about 0.04 m−1(Loren- zen, 1972), which is its assigned value in our model. The light attenuation of an ice parameter is not examined here:
any primary production sensitivity to variation inkiis likely to have effects relegated to the high latitudes. Light atten- uation by phytoplankton also implicitly accounts for atten- uation of light by co-varying factors, with the current de- fault model value applied to both diazotrophs and the sin- gle general phytoplankton type (Eq. 1). The Schmittner et al.
(2008)kcvalue of 0.03 (m mmol N m−3)−1was increased in Keller et al. (2012) to 0.047 (m mmol N m−3)−1. Light atten- uation parameters are measured based on chlorophyll (com- monly chlorophylla) concentration, but the model uses nitro- gen units, necessitating the application of a conversion fac- tor also implicit inkc. Conversion of the range ofkcvalues given above (0.006 to 0.041 m2(mg Chla)−1) to carbon and then nitrogen units using the maximum Chla to carbon ra- tio for non-diatom phytoplankton in Table 4 of Dutkiewicz et al. (2015) and the Redfield C:N ratio used in our model (6.625) yields a range of 0.008 to 0.054 (m mmol N m−3)−1 in the observationally based literature (though higher values in models exist – Evans and Parslow, 1985, used a value of 0.12 (m mmol N m−3)−1). For our test, we employ eight separate simulations usingkc=0.01, 0.02, 0.03, 0.04, 0.05, 0.06, 0.07, and 0.08 (m mmol N m−3)−1. Increasing the light attenuation parameter value increases the self-shading effect of the phytoplankton biomass, reducing the amount of light available for photosynthesis. In the following analysis they will be referred to as “K1–8”, as we assess the impact of parameter choice on model net primary production, and car- bon and nutrient distributions in a model equilibrated to pre- industrial climate conditions and then forced with historical and projected greenhouse gas concentrations. Gridded ob- servations from the World Ocean Atlas climatology (Garcia et al., 2010a, b) (phosphate, nitrate, and oxygen) and GLO- DAP (Key et al., 2004) (DIC and alkalinity) are compared to the pre-industrial model.
3 Results
3.1 Pre-industrial equilibrium simulations
Patterns of equilibrated net primary production (NPP) in the UVic ESCM are sensitive tokcwithin the tested range.
Depth-integrated zonally and annually averaged NPP, and horizontally and annually averaged NPP, are shown in Fig. 1.
The simulation spread is smallest between 20 and 40◦, where phytoplankton biomass is low. The tropics and regions
(a) (b)
Depth (m)
NPP (g C m–3 yr–1)
Latitude NPP (g C m–2 yr–1)
Figure 1.Annually and zonally averaged pre-industrial, depth-integrated NPP(a), and annually and globally averaged NPP with depth(b).
Longitude Longitude Longitude
Latitude
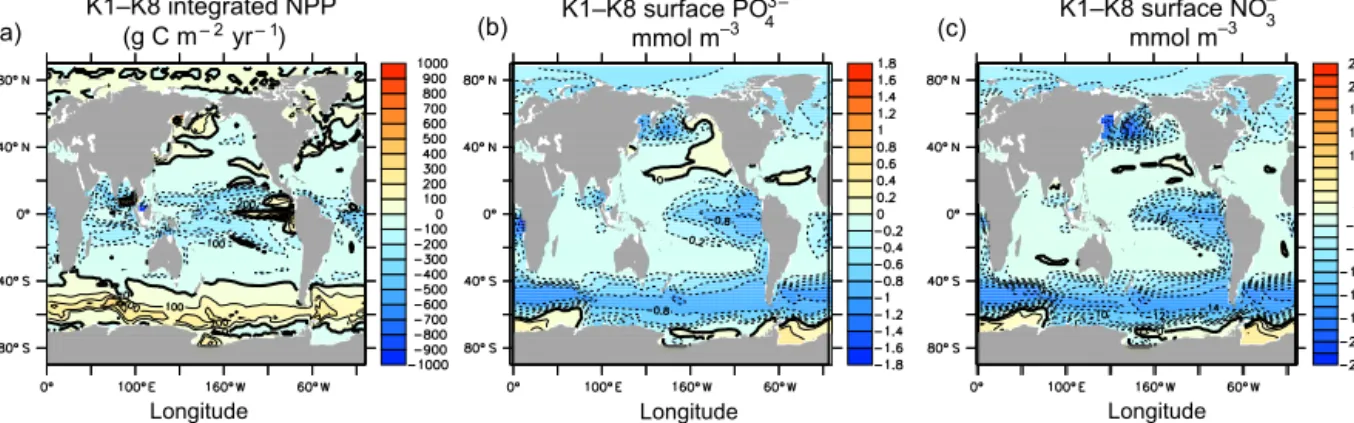
K1–K8 integrated NPP
(g C m– 2 yr )– 1 K1–K8surfacePO43–
mmol m–3
K1–K8 surface NO3– mmol m–3
(a) (b) (c)
Figure 2.Annually averaged pre-industrial differences between K1 and K8 for depth-integrated NPP(a), surface phosphate(b), and surface nitrate(c).
between 40 and 75◦, particularly in the Southern Ocean, show the largest differences in NPP with varyingkc. In the tropics, the differences in simulated zonal mean NPP be- tween end members K1 and K8 exceed 200 g C m−3yr−1, while regional differences in depth-integrated NPP exceed 200 g C m−3yr−1over large parts of the Southern Ocean and tropics (Fig. 2). In the Southern Ocean, K1 zonally averaged primary production rates can exceed those of K8 by more than a factor of 3 because phytoplankton in K1 do not self- shade as strongly during the austral summer, thereby allow- ing for a stronger seasonal cycle. South of this region (around 60◦S) UVic ESCM primary production transitions to being light-limited from being nutrient-limited to the north (annu- ally averaged limitation regimes are shown in Fig. 3), and so reducing the self-shading increases primary production in the light-limited regime. The transition zone between light and nutrient limitation is well mixed, and lateral advection of re- generated nutrients from the light-limited regime boosts NPP in the nutrient-limited regime in low-kcvalue simulations. In the more stratified (and nutrient-limited) tropics, the effect is opposite in that K8 yields zonally averaged NPP of up to double K1 because stronger self-shading inhibits deeper pho- tosynthesis (see the globally averaged NPP depth profile plot in Fig. 1, which is dominated by the low-latitude response), making more regenerated nutrients available at the surface (Figs. 2 and 4, and similar to the effect of light attenuation
by CDOM described previously by Kim et al., 2015). Higher nutrient concentrations at the tropical surface in K8 cause a net increase in depth-integrated primary production be- cause of the temperature dependency of primary production and respiration in the model (the warmer surface increases the production and remineralisation rates, resulting in higher NPP). Simulation differences in the tropical eastern Pacific upwelling region arise from processes similar to those de- scribed in the Southern Ocean. While the eastern Pacific up- welling zone is nutrient-limited in our model (like the rest of the tropics, Fig. 3), a weak near-surface temperature gradient reduces primary production in the surface layer. Higher light availability in K1 therefore allows for deeper utilization of upwelled nutrients, resulting in higher depth-integrated NPP in K1 compared to K8. Three distinct regional responses to kcparameter value choice are therefore apparent. In regions that are light-limited, reducing the light attenuation param- eter results in higher NPP (Southern Ocean and Arctic). In regions that are nutrient-limited, reducing the light attenua- tion parameter results in lower NPP when combined with a strong vertical temperature gradient near the surface (tropics and subtropical gyres). In regions that are nutrient-limited and are characterized by a weak vertical temperature gradi- ent near the surface, reducing the light attenuation parameter results in higher NPP (eastern Pacific, western boundary cur- rents). The northern hemisphere midlatitudes do not show
year year year
year year year
year year year
LatitudeLatitudeLatitude
Longitude Longitude Longitude
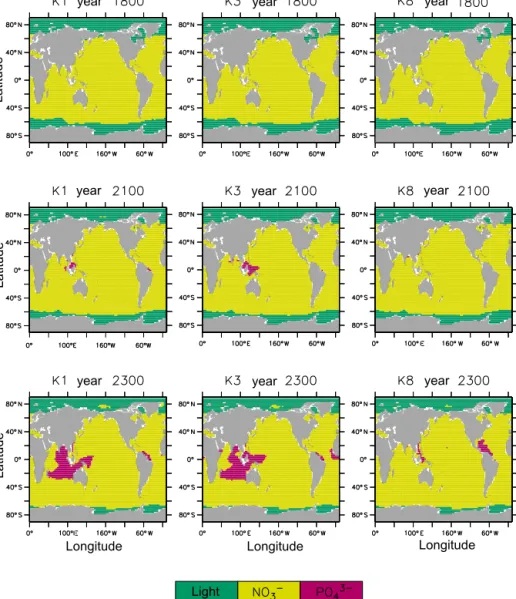
Light
Figure 3.K1, K3, and K8 light and nutrient limitation regions for years 1800, 2100, and 2300.
as clear a zonally averaged NPP-kc relationship, as can be seen in the Southern Hemisphere and the tropics, because the western boundary currents and oligotrophic regions op- pose each other in the North Atlantic and North Pacific.
Carbon and nutrient distributions in the UVic ESCM are also sensitive tokcbecause parameter choice affects the effi- ciency of the biological pump (Fig. 1), leading to a redistri- bution of nutrients (Fig. 4). Low-valuekcsimulations experi- ence a greater proportion of global NPP at the high latitudes (regions with higher sequestration efficiency; DeVries et al., 2012), and increasing the kc value shifts NPP towards the tropics (a region of lower sequestration efficiency; DeVries et al., 2012). As a consequence, more nutrients and carbon end up in the abyssal Pacific Ocean in low-value kc simu- lations than in higher-value ones. Increased storage of nu- trients in this deep ocean basin reduces the inventory avail- able for subduction in the northern Atlantic (e.g. Kwon and
Primeau, 2006; Kwon et al., 2009; Kriest et al., 2012), where water column concentrations of nitrate and phosphate decline (Fig. 4). Increasingkc values reduces average surface alka- linity (Fig. 4) by about 50 µmol kg−1globally, a response to increasing low-latitude NPP (including a stronger carbonate pump) with higherkcvalues. In low-valuekcsimulations, al- kalinity is higher in the Atlantic as a result of the decline of the Atlantic biological pump. Deep ocean alkalinity is less sensitive tokc value, though the average deep Pacific also shows a range of about 50 µmol kg−1and the Southern Ocean varies by about 25 µmol kg−1. Deep ocean DIC, however, is more sensitive to choice ofkc value (Fig. 4). K4–K8 DIC ranges in basin averages less than 30 µmol kg−1, but sensi- tivity increases at lowerkc values. K1 deep DIC values are about 40 µmol kg−1higher in the global average, Pacific, and Southern Ocean basins than in K2. These higher deep DIC values are a consequence of higher NPP at the high latitudes
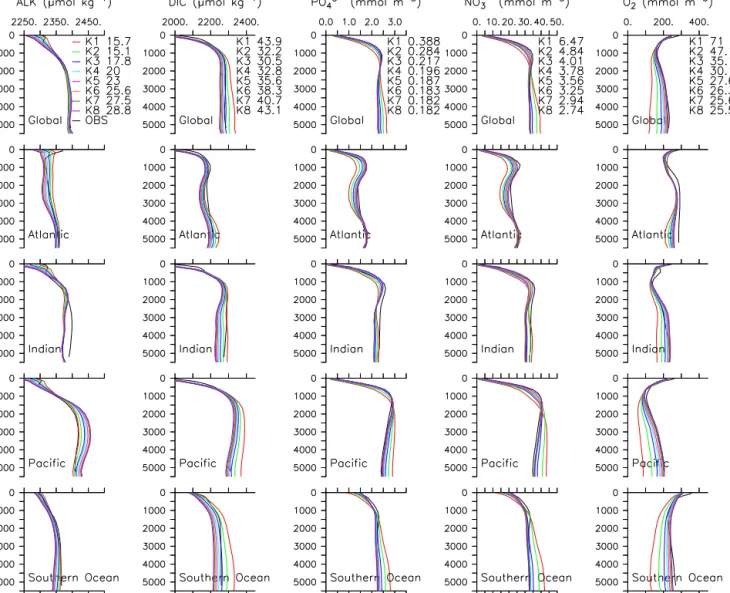
Figure 4. Annual mean pre-industrial biogeochemical tracer profiles averaged by ocean basin for all simulations compared to gridded observations. Global root mean square error is provided for each simulation.
owing to a weaker self-shading effect, which increases car- bon and nutrient export to the deep ocean. Phosphate and nitrate basin-averaged profiles show a range of values gener- ally proportional to the range in DIC, with drivers of the dif- ferences being the same (lowerkcvalues yield higher global NPP, lower surface nutrients, and higher deep ocean nutri- ents, as well as a shift in NPP to higher latitudes, Fig. 4).
Likewise, deep ocean oxygen is lower for lower kc values because there is more deep ocean remineralisation (Fig. 4).
The global average deep ocean oxygen concentration has a range of about 100 mmol m−3, which is about half of the av- erage deep ocean content. The Southern Ocean and Pacific show similar oxygen sensitivity.
Which kc value performs the “best” with respect to bio- geochemical observations is not thoroughly quantified here, but generally K4 and above perform better with respect to deep ocean nutrients and oxygen, K2 to K5 do better with
respect to global DIC, and K1 and K2 outperform the others with respect to global alkalinity (see global RMSE values in Fig. 4). As discussed in Sect. 1, selection of a single model kcvalue to represent all ocean biology and co-varying fac- tors is fairly ad hoc, and consequently, the range of values we selected for this sensitivity comparison are as well. Based on Figs. 1 and 4, the two lowestkc values we selected per- form anomalously with respect to the others (higher South- ern Ocean NPP, deep ocean DIC, nitrate, and phosphate and much lower deep ocean oxygen). Therefore we will exam- ine two groups ofK values in Sect. 3.2, K1–K8 (the full range tested) and K3–K8 (the subset better reproducing mod- ern deep ocean biogeochemistry).
3.2 RCP 8.5 transient simulations
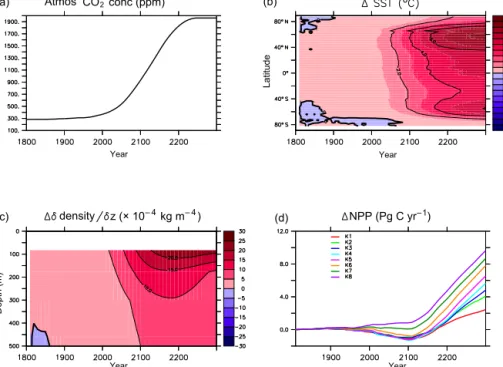
Figure 5 plots the increase in atmospheric CO2concentration from 283.8 to 1962 ppm over the course of the transient inte-
Atmos CO2 conc (ppm)
Year
density Year
z(×10– 4kgm– 4) NPP (Pg C yr–1)
Year Year
Latitude
Depth (m)
(a) (b)
(c) (d)
Figure 5.Atmospheric CO2concentration forcing of all simulations(a). Zonally averaged change in sea surface temperature in all simula- tions(b). Change in global average density gradient with depth in all simulations(c). Change in globally integrated net primary production in all simulations(d).
gration. The physical response is the same across all simula- tions and closely follows that described in Kvale et al. (2015).
Zonally averaged ocean surface temperatures rise by as much as 10◦C, North Atlantic maximum meridional overturning reduces from 20 to 9 Sverdrups (not shown), and widespread near-surface stratification occurs (Fig. 5). The phytoplank- ton and zooplankton respond to surface warming by increas- ing metabolic rates, and microbial fast recycling in the near surface increases (Kvale et al., 2015). Stratification reduces the availability of nutrients in the near surface. The global response in NPP until about the year 2100 depends on the simulation, with K1–K6 showing a decline, and K7 and K8 showing no change and an increase in NPP, respectively. Af- ter about year 2100, global NPP in K4–K8 increases linearly, while global NPP increases at a declining rate in K1–K3.
Model spread in global NPP response generally increases with radiative forcing. Change in global NPP differs by 2.5 Pg C yr−1by 2100 (more than 100 % of the total change in NPP at 2100 for all simulations) andkcparameter choice can determine the sign of the change. This applies even when only considering the subset of kc parameters offer- ing the better fits to pre-industrial nutrient and carbon ob- servations (K3–K8) and excluding K1 and K2. By 2300 this spread has increased to 7 Pg C yr−1 across all simulations, and 5 Pg C yr−1 between K3 and K8. By 2300, the spread between K3 and K8 is roughly equal to the all-simulation average change in NPP since 1800, suggesting choice ofkc
value can have a significant and increasing effect on global NPP response to climate forcing.
Before the year 2100, physical limitation of nutrients is the dominant driver of changes in global NPP (Kvale et al., 2015). Over this time, choice ofkc parameter value affects the magnitude and direction of how NPP in different re- gions responds. Increasingly oligotrophic conditions expand the extent of nutrient-limited regions, with phosphate lim- itation arising in the tropics in lower kc value simulations (shown for K1 and K3 in Fig. 3). More nutrient limitation re- sults in declining global NPP in the simulations with weaker self-shading (K1–K6). In these simulations, lower starting concentrations of surface nutrients cause the biology in these simulations to be more sensitive to an increase in stratifica- tion. Figure 6 (left plot) shows some decline between years 1800 and 2100 in tropical depth-integrated NPP between 10 and 20◦ for all simulations, with the declines generally in- creasing with decreasingkc. Declines in low-latitude NPP in simulations K1–K6 are not fully offset by increasing NPP in the Southern Ocean, which is driven by regional increas- ing temperature, wind-driven overturning, and nutrient rem- ineralisation (Kvale et al., 2015). K1 and K2 demonstrate a particularly strong increase in NPP in the Southern Ocean around 60◦S, for reasons discussed below. Along the Antarc- tic margin (around 80◦S), local freshening causes large local declines in NPP in simulations using weaker self-shading, though the region is not nutrient-limited in our model. The mechanism for the decline is a drop in seawater tempera- ture in the second ocean depth layer, which disproportion- ately affects simulations that have deeper NPP. Simulations K7 and K8 are relatively less sensitive to increasing stratifica-
Depth integrated NPP (g C m–2 yr–1) Depth integrated NPP (gCm–2yr–1)
years years years years years years years years
yearyear yearyear yearyear
Latitude Latitude
(a) (b)
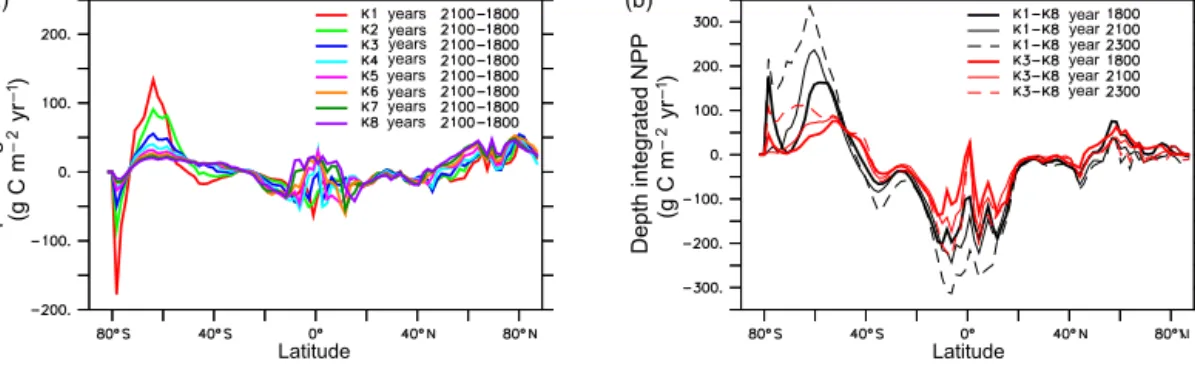
Figure 6.Change in annually and zonally averaged depth-integrated NPP between years 2100 and 1800(a)and annually and zonally averaged depth-integrated NPP differences between K1 and K8 (black lines) and K3 and K8 (red lines) at three time slices(b).
tion (and associated nutrient limitation) because their highkc
values raise primary production higher in the water column, thereby raising surface nutrient concentrations and allowing the phytoplankton to be less reliant on resupply of nutrients from deeper waters. Pre-2100 global NPP increases in K8 are therefore attributable to increased biological rates due to warming. All simulations show an increase in NPP north of about 50 to 60◦N, which is driven by warming temperatures in all light attenuation tests.
After year 2100, physical limitation of nutrients becomes a less important driver of changes in global NPP than temperature-enhanced biological processes (Kvale et al., 2015). Increasing global NPP in lowerkcsimulations is dom- inated by increasing NPP in the Southern Ocean, and in higher kc simulations is a combination of increasing NPP in the Southern Ocean and at low latitudes. The drivers of change in NPP after year 2100 in the Southern Ocean are the same as those mentioned earlier, with alleviation of light limitation (Fig. 3) and warming seawater temperatures in- creasing production rates, to particular effect on low-valuekc simulations. The driver of change in NPP after year 2100 in the tropics is the increase in temperature-enhanced biological processes. Increasing divergence in zonal mean NPP between simulations is shown in Fig. 6 (right plot). At year 1800, Southern Ocean depth-integrated and zonally averaged NPP in K1 exceeds that in K8 by 180 g C m−3yr−1 at most. By year 2100, this difference has increased to 250 g C m−3yr−1, and by year 2300 it is over 300 g C m−3yr−1 (correspond- ing to more than 150 % of K1 pre-industrial Southern Ocean zonal mean NPP). The pattern is similar but opposite at the low latitudes, where depth-integrated and zonally averaged NPP in K8 exceeds that in K1 by about 200 g C m−3yr−1in year 1800, around 250 g C m−3yr−1in year 2100, and more than 300 g C m−3yr−1 in year 2300. Divergence in depth- integrated and zonally averaged NPP for K3 and K8 follows the same pattern with smaller magnitudes – K3 exceeds K8 in the Southern Ocean by as much as 75 g C m−3yr−1(year 1800) and 100 g C m−3yr−1(year 2300, a difference of 60 % of the highest pre-industrial K3 Southern Ocean zonal NPP value), and K8 exceeds K3 at the low latitudes by up to about
130 g C m−3yr−1 (year 1800) and over 200 g C m−3yr−1 (year 2300). Throughout the simulations, Northern Hemi- sphere differences between K1 and K8 and K3 and K8 are relatively small, as the regional trends in responses to nutri- ent limitation are less cohesive than in the other regions.
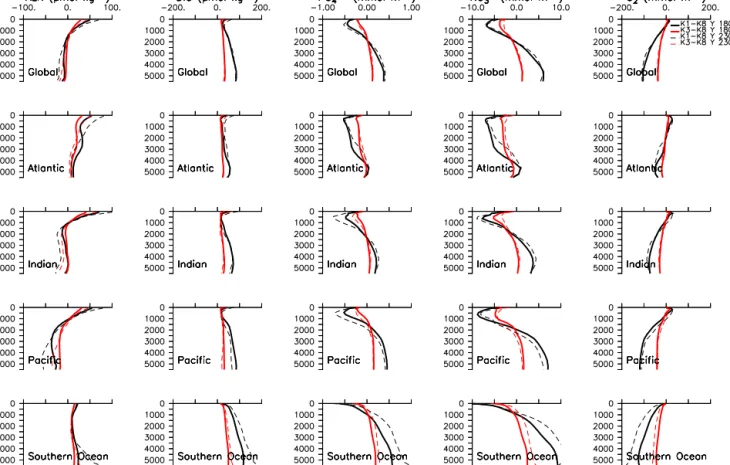
The biogeochemical consequences ofkcparameter choice at years 1800 and 2300 are shown for major ocean basins in Fig. 7. Most biogeochemical quantities retain the pre- industrial spread in global profiles with increasing CO2forc- ing (for both K1–K8 and K3–K8), with changes on basin scale cancelling out in the global mean. This observation likely relates to the asymmetry in Southern Ocean/tropical trends in NPP K1–K8 differences noted in the previous para- graph (NPP rates in K1 exceed those of K8 in the South- ern Ocean roughly equally to the amount NPP rates in K8 exceed those of K1 in the tropics). Basins reveal increas- ing changes with time. In particular, biogeochemical quan- tities in the deep Southern Ocean display increasing sen- sitivity to light attenuation parameter choice with time. At 5000 m in depth, by year 2300 the K1–K8 difference in average Southern Ocean alkalinity is 50 µmol kg−1 (com- pared to 25 µmol kg−1at year 1800), while the difference in DIC has increased to 170 µmol kg−1(110 µmol kg−1at year 1800). Alkalinity and DIC are higher in the K1 simulation because of higher NPP and stronger associated carbon ex- port to the deep Southern Ocean compared to K8. Phosphate concentration differences at year 2300 and 5000 m in depth equal 0.8 mmol m−3 (0.5 mmol m−3 at year 1800), nitrate concentration differences exceed 10 mmol m−3at year 2300 (9 mmol m−3 at year 1800), and oxygen concentration dif- ferences equal 180 mmol m−3 at year 2300 (120 mmol m−3 at year 1800).
All simulations experience a loss in oxygen due to warm- ing and increasing remineralisation, but K1 and K2 addi- tionally experience denitrification in the Southern Ocean (not shown) as a result of very high primary production in the region and already lower oxygen concentrations at pre-industrial equilibrium. This denitrification establishes a nutrient feedback with the low-latitude Pacific and Indian oceans that reduces Southern Ocean oxygen further (Fig. 8),
Figure 7.Annual mean biogeochemical tracer profile differences between K1 and K8 (black lines) and K3 and K8 (red lines), averaged by ocean basin for all simulations at years 1800 (solid lines) and 2300 (dashed lines).
S tratif ication NO3-
W arming NPP
S outhward PO 43- flux POC flux
Low latitude Pacif ic biogeochemical response
W arming POPO43-
R emineralisation
NPP POC flux
orthward NO-3 flux Southern Ocean biogeochemical response
D enitrif ication N
Figure 8.K1 and K2 feedback schematic in Southern Ocean and low-latitude Pacific nutrients. Increases with climate change are represented in bold font. Decreases with climate change are repre- sented in italic font. Regular font indicates little or no change with climate forcing. Bold arrows indicate the dominant factor influenc- ing change in NPP. Dashed arrows indicate the secondary factor influencing change in NPP. Nutrient feedback between regions is shown in coloured arrows.
thus producing a strong regional decline in oxygen despite K1 and K2 showing weaker global NPP trends than the other simulations. The feedback starts with increased stratification in the low-latitude Pacific and Indian oceans (to which low kc simulations are particularly sensitive), which limits ni-
trate availability for local primary production. As a result, more phosphate begins to advect into the Southern Ocean, where it fertilizes phytoplankton growth. The regional loss of phosphate in the western Pacific and Indian oceans in K1 and K3 can be seen in Fig. 3 as expanding phosphate- limited regimes. Warming seawater increases both primary production and remineralisation rates. Phytoplankton in K1 and K2 are only weakly inhibited by self-shading and take full advantage of warmer temperatures and imported nutri- ents, and the resulting large increases in primary production lead to the consumption of enough oxygen that denitrification is established in the Southern Ocean. Denitrification reduces the flow of nitrate in intermediate water back into the low- latitude Pacific and Indian basins, which become even more nitrate-limited.
Excluding the K1 and K2 simulations in which Southern Ocean denitrification occurs, differences between K3 and K8 biogeochemical quantities change less over time, though the spread in Southern Ocean intermediate and deep nitrate con- centrations increases by about 50 % (Fig. 7).
4 Discussion
The pre-industrial equilibrium simulations demonstrate a sensitivity in zonally averaged NPP, and global and basin profiles of biogeochemistry to choice of kc value for the range tested. Simulation spread is greatest in the Southern Ocean and tropics. Simulation differences arise from a com- plex interplay of factors. Higher light attenuation values have a stronger self-shading effect on phytoplankton, which acts to increase NPP in stratified, nutrient-limited regions (the low latitudes in our model). This is because strong self- shading raises the depth profile of primary production into the warmest surface ocean layer by reducing the amount of light available in lower layers. Biological processes have a temperature dependency in the UVic ESCM, so reduced nu- trient utilization in deeper layers increases nutrient availabil- ity at the surface, increasing surface net primary produc- tion. This finding somewhat agrees with Kim et al. (2015), who found a decoupling between nutrient concentrations and biomass when light attenuation of CDOM was accounted for in their ESM. Including light attenuation of CDOM (there- fore raising total model light attenuation) increased sur- face nutrient concentrations in their model through a simi- lar mechanism (shoaling of the biomass and production pro- files); however, they found that CDOM light attenuation de- creased depth-integrated biomass and attributed the increas- ing surface nutrients to less total production. Our model demonstrates an increase in depth-integrated NPP with in- creasing light attenuation. The Kim et al. (2015) model al- lowed biological light attenuation to reduce shortwave heat- ing of the water column, while our model does not account for this. Including a reduction of near-surface temperatures with strong self-shading might reduce the increase we find in NPP with higher values ofkc, though Manizza et al. (2005) found that inclusion of a shortwave feedback to NPP can also enhance spring sea surface temperatures and reduce sea ice.
Our model is also nutrient-limited in the tropical eastern Pacific upwelling zone, but this region is also well mixed (near-surface shoaling of the nutrient profile is weaker and the near-surface temperature gradient is lower), so greater light inhibition of deeper photosynthesis results in less NPP with higherkcvalues. In the Southern Ocean, higher NPP is the result of lower light attenuation values, which allow phy- toplankton in the light-limited regions to produce deeper in the water column. In simulations with lower light attenua- tion values, NPP also increases in the northern parts of the Southern Ocean, which are nutrient-limited in our model.
This may be a response to nutrient advection from locally increased near-surface remineralisation arising from higher NPP in the light-limited regions, and highlights the important point that light attenuation parameter choice can potentially have surprising effects on nutrient transport by changing the depth of primary production. Keller et al. (2016) found a sim- ilar effect at this latitude by suppressing primary production around Antarctica, which caused a northward advection of
nutrients, raising local NPP. In this particular region, higher vertical resolution might reduce the overall NPP response of the Southern Ocean to decreasing a light attenuation param- eter by reducing advected regenerated nutrients and reduc- ing preformed nutrients made available for primary produc- tion by reduced self-shading. At the stratified low latitudes, higher vertical resolution might reduce the nutrient shoaling effect of strong self-shading.
Though iron availability is accounted for in the form of a seasonally variable mask, in our model iron is not a limit- ing nutrient on an annually averaged basis. This is in con- trast to evidence of iron limitation in the Southern Ocean, North Atlantic, and eastern boundary currents and upwelling systems (see the recent review by Tagliabue et al., 2017).
More iron limitation of phytoplankton growth in the UVic ESCM might damp the NPP response we show for lower light attenuation simulations in the Southern Ocean and east- ern equatorial Pacific. More iron limitation might also mit- igate differences in the efficiency of the global biological pump between high- and low-value light attenuation parame- ter simulations. Higher NPP at the high latitudes in low-value light attenuation parameter simulations results in more effi- cient export and storage of nutrients in the deep ocean, par- ticularly the abyssal North Pacific (also found by DeVries et al., 2012). Model phosphate is conserved in our simu- lations; thus, larger deep ocean inventories result in lower concentrations in downstream surface and intermediate wa- ters (in qualitative agreement with Kwon and Primeau, 2006;
Kriest et al., 2012). The effect of enhanced deep nutrient se- questration is most apparent in Atlantic phosphate and nitrate profiles, where concentrations are lower for lowerkc simu- lations and NPP is not very much higher at the surface, in spite of being a seasonally well-mixed region. If iron were more limiting in the Southern Ocean deep water formation regions, fewer nutrients would be sequestered in the deep Pacific and more would be available to the North Atlantic, raising regional primary production and export (assuming no iron limitation also existed in the North Atlantic). More iron limitation at the low latitudes might furthermore damp the NPP response of higherkcsimulations in the thermally strat- ified tropics, thus increasing nutrient transport poleward and increasing high-latitude NPP.
Parameter estimation and the quantification of biogeo- chemical model uncertainty is a major field of research (see the review by Schartau et al., 2017). Our study demonstrates the importance of considering transient model behaviour in both parameter estimation and estimates of uncertainties for biogeochemistry in OGCMs and ESMs. Differences in the relative importance of regional biological pumps to global NPP between high- and low-light attenuation simulations have a strong effect on how the model responds to climate change. Using a lower kc value emphasizes the Southern Ocean response, where physical drivers of warming temper- atures and increasing light availability enhance NPP, while using higherkc values places increasing importance on the
tropical drivers of warming and stratification. Thus, simu- lation spread increases in our transient simulations, and kc
parameter choice can determine the sign as well as the mag- nitude of the global NPP response, particularly in the near term (to year 2100), when physical changes are the domi- nant model drivers of NPP. Simulations K6 to K8 perform roughly equivalently with respect to biogeochemical obser- vations in the pre-industrial equilibrium, and yet global NPP differences by 2100 are around 2 Pg C yr−1, with K8 show- ing an increase and K6 showing a decrease with respect to year 1800 NPP. A recent review of the drivers of change in global NPP in a suite of OGCMs and ESMs to which climate forcing was applied found the low latitudes contained the largest spread in model response, with global trends compris- ing a balance between increasing metabolic rates and increas- ing stratification (Laufkötter et al., 2015). Our results sug- gest differences between this balance across models might be partly related to differences in the treatment of phytoplank- ton light attenuation.
Climate change furthermore compounds regional differ- ences in biological pumps according to light attenuation pa- rameter choice, as nutrient export from the tropics to the Southern Ocean increases in low-kcvalue simulations due to the disproportionate sensitivity of low-kc value simulations to low-latitude stratification. Low-latitude nutrient recycling is strongly enhanced in high-kcvalue simulations due to sur- face warming and shallow NPP, reducing the availability of regenerated nutrients for export to the high latitudes and damping increasing NPP in the Southern Ocean. Where NPP responds to climate change has implications for long-term carbon sequestration, which can be seen as a 180 µmol kg−1 deep Southern Ocean DIC surplus and rising DIC concentra- tions in the near-surface Atlantic in the K1 simulation when compared to K8 by year 2300. Furthermore, ocean oxygen shows particular sensitivity to light attenuation parameter choice when forcing the model with future projections. That oxygen is sensitive to model treatment of NPP (e.g. Kriest et al., 2012), and that Southern Ocean biological processes can affect global nutrient, carbon, and oxygen distributions (e.g. Kwon and Primeau, 2006; DeVries et al., 2012; Kriest et al., 2012; Keller et al., 2016), are not new findings, but, as far as we know, our study is the first to demonstrate the potential for denitrification in the Southern Ocean. The nu- trient exchange feedback that is established in the two low- estkc value simulations (K1 and K2) substantially reduces Southern Ocean oxygen concentrations. Our model is highly idealized, but it is worth noting that the nutrient exchange feedback occurs because (1) it highlights the potential for strong biogeochemical teleconnection between the Southern Ocean and the low-latitude Pacific in the real world, and (2) light attenuation characteristics of dominant phytoplankton (Katz et al., 2004) and ocean oxygen content (Lenton et al., 2014) and rates of change (e.g. Paleocene Eocene Thermal Maximum; Norris et al., 2013) have changed over geologic timescales. A recent model study by Meyer et al. (2016) ex-
plored the sensitivity of oxygen to e-folding depth of rem- ineralisation and total phosphate inventory and hypothesized an increase in remineralisation depth has occurred over the Phanerozoic alongside a stabilisation of the ocean oxygen in- ventory. Our tests demonstrate another potential mechanism for the increase in ocean oxygen inventory in equilibrated conditions as well as for a stabilisation of oxygen under rapid climate change – an evolved increase in light attenuation by dominant phytoplankton, which in our model increases the ocean oxygen inventory and mitigates total oxygen change with climate forcing.
It is possible that primary production in our model demon- strates similarly increasing sensitivity to other phytoplankton parameters with climate change, and that the sensitivity of NPP tokcmay be damped or magnified by the choice of other parameter values (e.g. the initial value of the photosynthesis- irradiance curve). Exploring the uncertainty associated with multiple parameter manipulations is costly and better left to offline approaches that can objectively and systematically as- sess the solution space (see the review by Schartau et al., 2017), though as far as we know, offline methods for three- dimensional models are currently restricted to steady-state analysis. It is also possible that including a fully resolved radiative transfer model and explicit IOPs for multiple phy- toplankton types could damp the Southern Ocean response we find in K1 and K2 and the low-latitude response we find in the higher light attenuation simulations (Gregg and Rousseaux, 2016). Lastly, the impact of phytoplankton shad- ing on water column heating is not considered here. This is a potentially significant omission with respect to the climate change response of model physics as global net primary pro- duction increases strongly in all of our simulations but never contributes to regional cooling, in contrast to the Manizza et al. (2005) finding that light attenuation by biomass can amplify the seasonal cycle of temperature, mixed layer depth, and ice cover by about 10 % under pre-industrial conditions.
From a global perspective, increasing shortwave penetration along the Equator can warm regions to the south (Gnanade- sikan and Anderson, 2009), which might damp southward nutrient transport in our low-light attenuation simulations by increasing local export production. However, increasing shortwave penetration in the Southern Ocean can enhance mode water formation from subtropical water (Gnanadesikan and Anderson, 2009), which might enhance the positive nu- trient feedback we demonstrate in low-kc simulations. Re- gardless, the UVic ESCM is fairly typical with respect to other ESMs with regard to the treatment of the underwater light field; therefore, our sensitivity study is useful for as- sessing uncertainty in models of similar structure.
5 Conclusions
The highly simplistic parameterisation of underwater light availability used in the UVic ESCM to calculate primary
production and associated chemistry (alkalinity, DIC, nitrate, phosphate, and oxygen) is sensitive to a range of light atten- uation parameter values constrained by data. This applies to both pre-industrial equilibrium and future projections. This sensitivity can grow with changing background climate as complex biogeochemical feedbacks develop, with primary production and ocean oxygen being especially susceptible to parameter choice. Our study highlights the need to assess biogeochemical models under transient as well as equilib- rium conditions. In addition, the biogeochemical feedback we describe in two of our transient simulations also serves as a reminder that even seemingly small events, like the emer- gence of shell-secreting phytoplankton, could have poten- tially large biogeochemical consequences just by altering the underwater light field.
Code availability. Model data and figure scripts are available from https://thredds.geomar.de/thredds/catalog/open_access/kvale_
meissner_2017_bg/catalog.html (GEOMAR, 2017). Model code is available from the authors upon request.
Author contributions. KFK designed and implemented the experi- ment, and wrote the paper with comments by KJM. KFK and KJM interpreted the model results.
Competing interests. The authors declare that they have no conflict of interest.
Acknowledgements. Computing resources were provided by Kiel University.
The article processing charges for this open-access publication were covered by a Research
Centre of the Helmholtz Association.
Edited by: Victor Brovkin
Reviewed by: two anonymous referees
References
Battle, M., Bender, M., Sowers, T., Tans, P., Butler, J., Elkins, J., Ellis, J., Conway, T., Zhang, N., Lang, P., and Clarke, A.:
Atmospheric gas concentrations over the past century mea- sured in air from firn at the South Pole, Nature, 383, 231–235, https://doi.org/10.1038/383231a0, 1996.
Bracher, A. and Tilzer, M.: Underwater light field and phytoplank- ton absorbance in different surface water masses of the At- lantic sector of the Southern Ocean, Polar Biology, 24, 687–696, https://doi.org/10.1007/s003000100269, 2001.
DeVries, T., Primeau, F., and Deutsch, C.: The sequestration effi- ciency of the biological pump, Geophys. Res. Lett., 39, l13601, https://doi.org/10.1029/2012GL051963, 2012.
Dutkiewicz, S., Hickman, A. E., Jahn, O., Gregg, W. W., Mouw, C. B., and Follows, M. J.: Capturing optically im- portant constituents and properties in a marine biogeochem- ical and ecosystem model, Biogeosciences, 12, 4447–4481, https://doi.org/10.5194/bg-12-4447-2015, 2015.
Eby, M., Zickfeld, K., Montenegro, A., Archer, D., Meissner, K. J., and Weaver, A. J.: Lifetime of anthropogenic climate change: Millennial time scales of potential CO2 and sur- face temperature perturbations, J. Climate, 22, 2501–2511, https://doi.org/10.1175/2008JCLI2554.1, 2009.
Etheridge, D., Steele, L., Langenfelds, R., Francey, R., Barnola, J., and Morgan, V.: Natural and anthropogenic changes in at- mospheric CO2 over the last 1000 years from air in Antarc- tic ice and firn, J. Geophys. Res.-Atmos., 101, 4115–4128, https://doi.org/10.1029/95JD03410, 1996.
Etheridge, D., Steele, L., Francey, R., and Langenfelds, R.: Atmo- spheric methane between 1000 AD and present: Evidence of an- thropogenic emissions and climatic variability, J. Geophys. Res.- Atmos., 103, 15979–15993, https://doi.org/10.1029/98JD00923, 1998.
Evans, G. T. and Parslow, J. S.: A model of annual plankton cycles, Biological Oceanography, 3, 327–347, https://doi.org/10.1016/0198-0254(85)92902-4, 1985.
Falkowski, P. and Woodhead, A. (Eds.): Primary productivity and biogeochemical cycles in the sea, Proceedings of the conference on primary productivity and biogeochemical cycles in the sea, Brookhaven National Laboratory, Plenum Press, 1992.
Falkowski, P. G., Gan, R., and Wyman, K.: Growth-irradiance re- lationships in phytoplankton, Limnol. Oceanogr., 30, 311–321, 1985.
Fasham, M. J. R., Ducklow, H. W., and McKelvie, S. M.:
A nitrogen-based model of plankton dynamics in the oceanic mixed layer, J. Marine Res., 48, 591–639, https://doi.org/10.1357/002224090784984678, 1990.
Ferretti, D., Miller, J., White, J., Etheridge, D., Lassey, K., Lowe, D., Meure, C., Dreier, M., Trudinger, C., van Ommen, T., and Langenfelds, R.: Unexpected changes to the global methane budget over the past 2000 years, Science, 309, 1714–1717, https://doi.org/10.1126/science.1115193, 2005.
Flückiger, J., Dällenbach, A., Blunier, T., Stauffer, B., Stocker, T. F., Raynaud, D., and Barnola, J.-M.: Variations in atmospheric N2O concentration during abrupt climatic changes, Science, 285, 227–
230, https://doi.org/10.1126/science.285.5425.227, 1999.
Flückiger, J., Blunier, T., Stauffer, B., Chappellaz, J., Spahni, R., Kawamura, K., Schwander, J., Stocker, T. F., and Dahl-Jensen, D.: N2O and CH4variations during the last glacial epoch: Insight into global processes, Global Biogeochem. Cy., 18, GB1020, https://doi.org/10.1029/2003GB002122, 2004.
Fujii, M., Boss, E., and Chai, F.: The value of adding optics to ecosystem models: a case study, Biogeosciences, 4, 817–835, https://doi.org/10.5194/bg-4-817-2007, 2007.
Garcia, H., Locarnini, R. A., Boyer, T. P., Antonov, J., Baranova, O., Zweng, M. M., and Johnson, D.: World Ocean Atlas 2009, Volume 3: Dissolved Oxygen, Apparent Oxygen Utilization, and Oxygen Saturation, Tech. rep., NOAA Atlas NESDIS 70, U.S.
Government Printing Office, Washington, D.C., 2010a.
Garcia, H., Locarnini, R. A., Boyer, T. P., Antonov, J., Zweng, M. M., Baranova, O., and Johnson, D.: World Ocean Atlas 2009, Volume 4: Nutrients (phosphate, nitrate, silicate), Tech. rep.,
NOAA Atlas NESDIS 71, U.S. Government Printing Office, Washington, D.C., 2010b.
GEOMAR: Catalog of Gridded Data, available at: https:
//thredds.geomar.de/thredds/catalog/open_access/kvale_
meissner_2017_bg/catalog.html, last access: October 2017.
Gnanadesikan, A. and Anderson, W. G.: Ocean water clarity and the ocean general circulation in a cou- pled climate model, J. Phys. Oceanogr., 39, 314–332, https://doi.org/10.1175/2008JPO3935.1, 2009.
Gregg, W. W. and Rousseaux, C. S.: Directional and spectral ir- radiance in ocean models: Effects on simulated global phy- toplankton, nutrients, and primary production directional and spectral irradiance in ocean models, Front. Mar. Sci, 3, 240, https://doi.org/10.3389/fmars.2016.00240, 2016.
Hurtt, G. C., Chini, L. P., Frolking, S., Betts, R. A., Feddema, J., Fischer, G., Fisk, J. P., Hibbard, K., Houghton, R. A., Janetos, A., Jones, C. D., Kindermann, G., Kinoshita, T., Klein Gold- ewijk, K., Riahi, K., Shevliakova, E., Smith, S., Stehfest, E., Thomson, A., Thornton, P., van Vuuren, D. P., and Wang, Y. P.:
Harmonization of land-use scenarios for the period 1500–2100:
600 years of global gridded annual land-use transitions, wood harvest, and resulting secondary lands, Climatic Change, 109, 117, https://doi.org/10.1007/s10584-011-0153-2, 2011.
Kalnay, E., Kanamitsu, M., Kistler, R., Collins, W., Deaven, D., Gandin, L., Iredell, M., Saha, S., White, G., Woollen, J., Zhu, Y., Chelliah, M., Ebisuzaki, W., Higgins, W., Janowiak, J., Mo, K., Ropelewski, C., Wang, J., Leetmaa, A., Reynolds, R., Jenne, R., and Joseph, D.: The NCEP/NCAR 40-year reanalysis project, B.
Am. Meteorol. Soc., 77, 437–471, https://doi.org/10.1175/1520- 0477(1996)077<0437:TNYRP>2.0.CO;2, 1996.
Katz, M. E., Finkel, Z. V., Grzebyk, D., Knoll, A. H., Paul, G., and Falkowski, P. G.: Evolutionary trajectories and bio- geochemical impacts of marine eukaryotic phytoplankton, An- nual Review of Ecology, Evolution and Systematics, 35, 523–
556, https://doi.org/10.1146/annurev.ecolsys.35.112202.130137, 2004.
Keller, D. P., Oschlies, A., and Eby, M.: A new marine ecosystem model for the University of Victoria Earth Sys- tem Climate Model, Geosci. Model Dev., 5, 1195–1220, https://doi.org/10.5194/gmd-5-1195-2012, 2012.
Keller, D. P., Kriest, I., Koeve, W., and Oschlies, A.: Southern Ocean biological impacts on global ocean oxygen, Geophys. Res.
Lett., 43, 6469–6477, https://doi.org/10.1002/2016GL069630, 2016.
Kettle, H. and Merchant, C. J.: Modeling ocean primary production: Sensitivity to spectral resolution of attenuation and absorption of light, Prog. Oceanogr., 78, 135–146, https://doi.org/10.1016/j.pocean.2008.04.002, 2008.
Key, R., Kozyr, A., Sabine, C., Lee, K., Wanninkhof, R., Bullister, J., Feely, R., Millero, F., and Mordy, C.: A global ocean carbon climatology: Results from GLODAP, Global Biogeochem. Cy., 18, GB4031, https://doi.org/10.1029/2004GB002247, 2004.
Kim, G. E., Pradal, M.-A., and Gnanadesikan, A.: Quantifying the biological impact of surface ocean light attenuation by colored detrital matter in an ESM using a new optical parameterization, Biogeosciences, 12, 5119–5132, https://doi.org/10.5194/bg-12- 5119-2015, 2015.
Kirk, J. T. O.: A theoretical analysis of the contribution of algal cells to the attenuation of light within natural waters I: General treat-
ment of suspensions of pigmented cells, New Phytol., 75, 11–20, https://doi.org/10.1111/j.1469-8137.1975.tb01366.x, 1975.
Kirk, J. T. O.: Light and Photosynthesis in Aquatic Ecosystems, Cambridge University Press, 1983.
Kriest, I., Oschlies, A., and Khatiwala, S.: Sensitiv- ity analysis of simple global marine biogeochemi- cal models, Global Biogeochem. Cy., 26, gB2029, https://doi.org/10.1029/2011GB004072, 2012.
Kvale, K. F., Meissner, K. J., and Keller, D. P.: Potential in- creasing dominance of heterotrophy in the global ocean, En- viron. Res. Lett., 10, 074009, https://doi.org/10.1088/1748- 9326/10/7/074009, 2015.
Kwon, E. Y. and Primeau, F.: Optimization and sensitivity study of a biogeochemistry ocean model using an implicit solver and in situ phosphate data, Global Biogeochemical Cycles, 20, gB4009, https://doi.org/10.1029/2005GB002631, 2006.
Kwon, E. Y., Primeau, F., and Sarmiento, J. L.: The impact of remineralization depth on the air–sea carbon balance, Nature Geosci., 2, 630–635, https://doi.org/10.1038/ngeo612, 2009.
Laufkötter, C., Vogt, M., Gruber, N., Aita-Noguchi, M., Aumont, O., Bopp, L., Buitenhuis, E., Doney, S. C., Dunne, J., Hashioka, T., Hauck, J., Hirata, T., John, J., Le Quéré, C., Lima, I. D., Nakano, H., Seferian, R., Totterdell, I., Vichi, M., and Völker, C.: Drivers and uncertainties of future global marine primary pro- duction in marine ecosystem models, Biogeosciences, 12, 6955–
6984, https://doi.org/10.5194/bg-12-6955-2015, 2015.
Lenton, T. M., Boyle, R. A., Poulton, S. W., Shields-Zhou, G. A., and Butterfield, N. J.: Co-evolution of eukaryotes and ocean oxy- genation in the Neoproterozoic era, Nature Geosci., 7, 257–265, 2014.
Lorenzen, C.: Extinction of light in ocean by phytoplankton, Journal du Conseil, 34, 262–267, 1972.
Machida, T., Nakazawa, T., Fujii, Y., Aoki, S., and Watanabe, O.: Increase in the atmospheric nitrous-oxide concentration dur- ing the last 250 years, Geophys. Res. Lett., 22, 2921–2924, https://doi.org/10.1029/95GL02822, 1995.
Manizza, M., Le Quere, C., Watson, A., and Buitenhuis, E.: Bio- optical feedbacks among phytoplankton, upper ocean physics and sea-ice in a global model, Geophys. Res. Lett., 32, L05603, https://doi.org/10.1029/2004GL020778, 2005.
Meinshausen, M., Smith, S. J., Calvin, K., Daniel, J. S., Kainuma, M. L. T., Lamarque, J.-F., Matsumoto, K., Montzka, S. A., Raper, S. C. B., Riahi, K., Thomson, A., Velders, G. J. M., and van Vu- uren, D. P. P.: The RCP greenhouse gas concentrations and their extensions from 1765 to 2300, Climatic Change, 109, 213–241, https://doi.org/10.1007/s10584-011-0156-z, 2011.
Meissner, K. J., McNeil, B. I., Eby, M., and Wiebe, E. C.: The importance of the terrestrial weathering feedback for multimil- lennial coral reef habitat recovery, Global Biogeochem. Cy., 26, GB3017, https://doi.org/10.1029/2011GB004098, 2012.
Meure, M. C., Etheridge, D., Trudinger, C., Steele, P., Lan- genfelds, R., van Ommen, T., Smith, A., and Elkins, J.:
Law Dome CO2, CH4 and N2O ice core records ex- tended to 2000 years BP, Geophys. Res. Lett., 33, L14810, https://doi.org/10.1029/2006GL026152, 2006.
Meyer, K. M., Ridgwell, A., and Payne, J. L.: The influence of the biological pump on ocean chemistry: Implications for long- term trends in marine redox chemistry, the global carbon cy-
cle, and marine animal ecosystems, Geobiology, 14, 207–219, https://doi.org/10.1111/gbi.12176, 2016.
Norris, R. D., Turner, S. K., Hull, P. M., and Ridgwell, A.: Marine Ecosystem Responses to Cenozoic Global Change, Science, 341, 492–498, https://doi.org/10.1126/science.1240543, 2013.
Riahi, K., Gruebler, A., and Nakicenovic, N.: Scenar- ios of long-term socio-economic and environmen- tal development under climate stabilization, Techno- logical Forecasting and Social Change, 74, 887–935, https://doi.org/10.1016/j.techfore.2006.05.026, 2007.
Sathyendranath, S. and Platt, T.: Spectral effects in bio-optical con- trol on the ocean system, Oceanologia, 49, 5–39, 2007.
Schartau, M., Wallhead, P., Hemmings, J., Löptien, U., Kriest, I., Krishna, S., Ward, B. A., Slawig, T., and Oschlies, A.: Re- views and syntheses: parameter identification in marine plank- tonic ecosystem modelling, Biogeosciences, 14, 1647–1701, https://doi.org/10.5194/bg-14-1647-2017, 2017.
Schmittner, A., Oschlies, A., Giraud, X., Eby, M., and Sim- mons, H.: A global model of the marine ecosystem for long-term simulations: Sensitivity to ocean mixing, buoy- ancy forcing, particle sinking, and dissolved organic matter cycling, Global Biogeochem. Cy., 19, GB3004, https://doi.org/10.1029/2004GB002283, 2005.
Schmittner, A., Oschlies, A., Matthews, H. D., and Galbraith, E. D.:
Future changes in climate, ocean circulation, ecosystems, and biogeochemical cycling simulated for a business-as-usual CO2 emission scenario until year 4000 AD, Global Biogeochem. Cy., 22, GB1013, https://doi.org/10.1029/2007GB002953, 2008.
Siegel, D., Maritorena, S., Nelson, N., and Behrenfeld, M.: Indepen- dence and interdependencies among global ocean color proper- ties: Reassessing the bio-optical assumption, J. Geophys. Res.- Oceans, 110, C07011, https://doi.org/10.1029/2004JC002527, 2005.
Stramski, D., Bricaud, A., and Morel, A.: Modeling the inherent optical properties of the ocean based on the detailed composi- tion of the planktonic community, Appl. Opt., 40, 2929–2945, https://doi.org/10.1364/AO.40.002929, 2001.
Tagliabue, A., Bowie, A. R., Boyd, P. W., Buck, K. N., Johnson, K. S., and Saito, M. A.: The integral role of iron in ocean biogeochemistry, Nature, 543, 51–59, https://doi.org/10.1038/nature21058, 2017.
Wang, X. J., Le Borgne, R., Murtugudde, R., Busalacchi, A. J., and Behrenfeld, M.: Spatial and temporal variations in dissolved and particulate organic nitrogen in the equatorial Pacific: bio- logical and physical influences, Biogeosciences, 5, 1705–1721, https://doi.org/10.5194/bg-5-1705-2008, 2008.
Weaver, A., Eby, M., Wiebe, E., Bitz, C., Duffy, P., Ewen, T., Fanning, A., Holland, M., MacFadyen, A., Matthews, H., Meissner, K., Saenko, O., Schmittner, A., Wang, H., and Yoshimori, M.: The UVic Earth System Climate Model:
Model description, climatology, and applications to past, present and future climates, Atmos.-Ocean, 39, 361–428, https://doi.org/10.1080/07055900.2001.9649686, 2001.