P³ - PetroPhysical Property Database – a global compilation of lab measured rock properties
Kristian Bär
1, Thomas Reinsch
2, Judith Bott
21Department of Geothermal Science and Technology, Institute of Applied Geosciences, Technische Universität Darmstadt, Schnittspahnstr. 9, Darmstadt, 64287, Germany
5
2GFZ German Research Centre for Geosciences, Telegrafenberg, Potsdam, 14473, Germany Correspondence to: Kristian Bär (baer@geo.tu-darmstadt.de)
Abstract. Petrophysical properties are key to populate local and/or regional numerical models and to interpret results from geophysical investigation methods. Searching for rock property values measured on samples from a specific rock unit at a specific location might become a very time-consuming challenge given that such data are spread across diverse compilations 10
and that the number of publications on new measurements is continuously growing and data are of heterogeneous quality.
Profiting from existing laboratory data to populate numerical models or interpret geophysical surveys at specific locations or for individual reservoir units is often hampered if information on the sample location, petrography, stratigraphy, measuring method and conditions are sparse or not documented.
Within the framework of the EC funded project IMAGE (Integrated Methods for Advanced Geothermal Exploration, EU grant 15
agreement No. 608553), an open-access database of lab measured petrophysical properties has been developed (Bär et al., 20182019: P³ - Database, http://dx.doi.org/10.5880/GFZ.4.8.2019.P3. The goal of this hierarchical database is to provide easily accessible information on physical rock properties relevant for geothermal exploration and reservoir characterization in a single compilation. Collected data include ‘classical’ petrophysical, thermophysical and mechanical properties and, in addition, electrical conductivity and magnetic susceptibility. Each measured value is complemented by relevant meta-information such 20
as the corresponding sample location, petrographic description, chronostratigraphic age, if available, and original citation. The original stratigraphic and petrographic descriptions are transferred to standardized catalogues following a hierarchical structure ensuring inter-comparability for statistical analysis (Bär et al., 2019: P³ - Petrography, http://dx.doi.org/10.5880/GFZ.4.8.2019.P3.p, Bär et al., 20182019: P³ - Stratigraphy, http://dx.doi.org/10.5880/GFZ.4.8.2019.P3.s). In addition, information on the experimental setup (methods) and the 25
measurement conditions are listed for quality control. Thus, rock properties can directly be related to in-situ conditions to derive specific parameters relevant for simulating subsurface processes or interpreting geophysical data.
We describe the structure, content and status quo of the database and discuss its limitations and advantages for the end-user.
Keywords: relational database, rock physical properties, laboratory measurements, global data compilation.
30
1 Introduction
The characterisation and utilisation of subsurface reservoirs generally relies on applying geophysical investigation methods and/or numerical simulation codes – both requiring, in turn, the knowledge of physical rock properties at depth. The strategy of populating numerical models with petrophysical properties can differ. For local-scale models, laboratory data from individual samples collected from the geological unit of interest may exist. In this case, this direct information should be used 5
together with sophisticated (physical and empirical) laws to populate the entire geological unit. For regional and continental- scale models, in contrast, parameters have to be generalised with respect to the spatial and physical variability of the investigated lithological units.
Individual rock types or petrographies typically exhibit a great variability in related properties due to heterogeneous mineral compositions, variable textures and differing porosity distribution (Schön, 2015). Existing rock properties compilations are 10
both an example for the high variability and for the different purposes of such databases (e.g. Cermak and Rybach, 1982, Clark, 1966, Clauser and Huenges, 1995, Landolt-Börnstein, PetroMod, Schön, 2004, 2011, 2015, Mortimer, 2005, Hantschel and Kauerauf, 2009, Lilios and Exadaktylos, 2011, Descamps et al., 2013, Aretz et al., 2015). Since such compilations are mostly published with limited meta-information, it is difficult to extract data for formations of interest. This is even aggravated due to additional limitations like the focused coverage of certain rock types or geographic areas (e.g. Germany: FIS Petrophysik 15
hosted by the Leibniz Institute of Applied Geophysics (LIAG) (http://www.fis-geophysik.de), Great Britain: BritGeothermal (http://www.britgeothermal.org) hosted by the British Geological Survey (BGS), USA: National Geothermal Data System (NGDS) hosted by the United States Geological Survey (USGS) (http://geothermaldata.org), Ireland: IRETherm project (http://www.iretherm.ie/), Australia: Rock Properties Explorer (http://www.ga.gov.au/explorer-web/rock-properties.html), New Zealand: PETLAB: National Rock and Geonalytical database(http://pet.gns.cri.nz/#/, and many more).
20
In addition, different compilations do not provide a homogenised set of meta-information. Furthermore, exploration data availability often depends on national legislation. In some countries industrial resource exploration data, including petrophysical properties measured on cores of deep wells, may be public after a certain time period and then usually is incorporated in national information systems. In other cases exploration data remains confidential for longer time periods or even infinitely resulting in scarce data availability for the respective countries.
25
Due to the current publication policy of international research institutions where a high number of peer-reviewed publications become more and more important for the individual scientific career, the amount of petrophysical data recorded worldwide increased dramatically. These publications however are spread among many different geoscientific journals and dispersed in many hundreds of publications. Given the rate of newly published property data combined with the multitude of publishing journals, countries and authors, the research for and collection of data can be incredibly time-consuming. Recent studies show 30
that domain experts spend nearly 80% of their working hours into collecting, cleansing and managing their domain specific data (CrowdFlower, 2016). An effective, comprehensive collection, collation and dissemination of this data is deemed critical to promote rapid, creative and accurate research (Gard et al., 2019).
To facilitate (i) efficient search for and research on measured rock physical properties, (ii) further evaluation of the property data using complementing meta-information, and (iii) adequate property generalisation for specific units, a comprehensive database was developed within the framework of the EC funded project IMAGE (Integrated Methods for Advanced Geothermal Exploration, Grant Agreement No. 608553). The aim of this database is to compile, store and publicly provide petrophysical property data from published laboratory test results on rock samples of any kind including as much meta- 5
information as possible. So far, literature data relevant for the IMAGE project and laboratory data collected during the IMAGE project were fed into this novel PetroPhysical Property Database (P3). Here, we present the current state of P³ and release version 1.0 in excel format (Bär et al., 2019: P³ - Database, http://dx.doi.org/10.5880/GFZ.4.8.2019.P3).
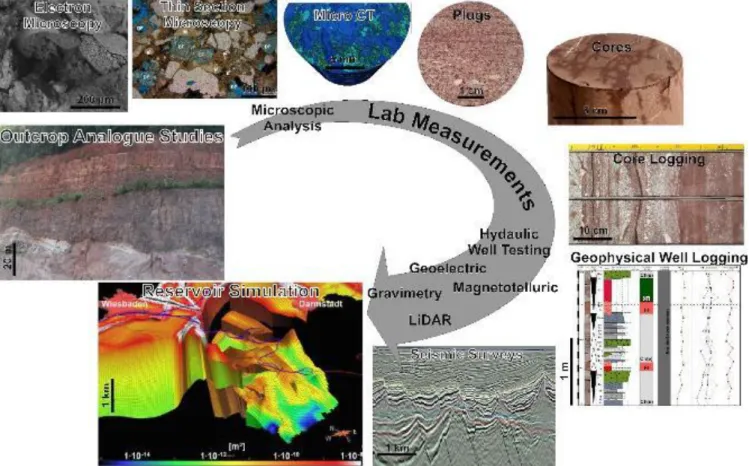
Figure 1: Concept of multiscale characterisation of geological reservoirs with (examples of) integrated petrological, petrophysical or 10
geophysical methods bridging outcrop analogue studies to numerical reservoir simulations.
2 Contents and Structure of the Database
P³ is publicly accessible and contains physical rock properties measured in laboratory experiments. All data are selected to represent the characteristic scale of rock samples of few centimetres to decimetres, depending on the measurement methods (as described by numerous norming institutions or committees as e.g. the International Society for Rock Mechanics and Rock 15
Engineering (ISRM), European Committee for Standardization (C)EN, International Organization for Standardization (ISO), American Society for testing and Materials (ASTM international) and many more) for the different properties. Within P³ we aimed at homogenising measurement method descriptions to increase the inter-comparability between individual reported values. Larger-scale data from geophysical well logging, hydraulic well testing, integrating geophysical methods or other field- scale measurements, which integrate over larger rock volumes or several rock types are not yet included in the database (Figure 5
1). This shall ensure to reduce bias introduced by heterogeneities within larger geobodies including open or partly open discontinuities like fissures, fractures, bedding or schistosity. In addition, judged based on the lithological description, we did not include data from very small scale samples, where the volume of interest is likely smaller than the minimum representative elementary volume (REV) (e.g. Ringrose and Bentely, 2015) for the investigated rock type. The full range of the scale- dependency of petrophysical properties as described in previous studies (e.g. Enge et al., 2007, Rühaak et al., 2015) is thus not 10
yet reflected by the database but is planned to be incorporated in future versions.
To ensure that source data is publicly available to researchers, only data from scientific publications (books or peer reviewed journals) or proceedings (e.g. IGA Geothermal Papers/Conference Database) as well as published research reports (e.g.
dissertations or publicly available student’s theses, project reports) were included in P³. The database only contains measurements with a minimum amount of meta-information to allow for reasonable interpretations, generalisations, or 15
simulations based on the collected data. The minimum associated meta-information is the reference to the data origin (citation) and information about the petrography to allow for a classification according to a certain lithotype. If available, additional meta-data were included, such as the sampling location (potentially including its type, e.g. outcrop, abandoned or active quarry, vertical or deviated well), the affiliation to a registered sample set (e.g. International Geo Sample Number (IGSN, cf. Devaraju et al., 2016, Lehnert et al., 2006)), stratigraphy, sample dimensions, measurement method or device and measurement 20
conditions (pressure, temperature, stress) including degree of saturation and type of saturating fluid. Conversion of published values to SI units as well as correction of some minor errors from published data or omissions from previous databases as they are identified is an ongoing process during the data curation.
The database was developed as flat-file format using Microsoft Excel to keep it as simple and easy to handle even by the unexperienced user as possible. While other database structures are in comparison much more efficient, their database 25
management schemes may render it too difficult for users not familiar with SQL to recover the desired data. However, the internal design of P³ with multiple tables is structured following a relational database management system (RDBMS, Codd, 1970) so that it could easily be transferred to e.g. the well-established structured query language (SQL, Chamberlin and Boyce, 1974). Following this relational structure the database could easily be organised into multiple tables using the names of the tables as unique keys as links to other sub-tables. The main advantages of a relational database over a flat file format are that 30
data is uniquely stored just once, eliminating data duplication, as well as performance increases due to greater memory efficiency and easy filtering and rapid queries (Gard et al., 2019). This current structure allows for easy modification and extensions as new requirements emerge, as for example by adding more sub-tables for newly developed property
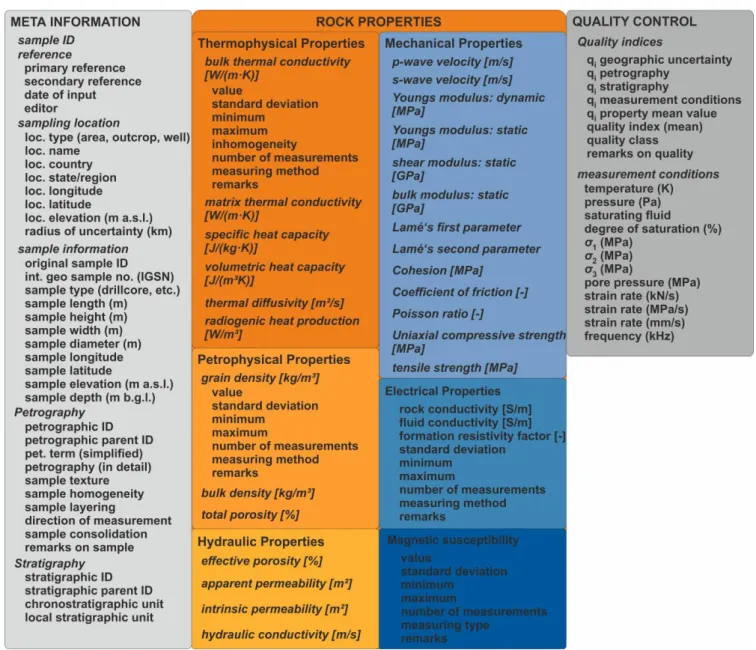
Following the minimum requirements, the database is structured into three main sections or super entities (Figure 2), which are sets of data tables (described in more detail in the following parts of the paper). The first, named ‘meta information’, contains all meta-information on the sample including the sampling location, the sample type and dimensions as well as information on its petrography and stratigraphy and thus acts as primary table for unique sample identification. The second section or super entity contains the measured property value(s) of the unique rock samples. This section is sub-grouped into 5
thermophysical properties, ‘classical’ petrophysical properties, mechanical properties as well electrical and magnetic properties and fields for property specific remarks. Finally, the third section or super entity named ‘quality control’ includes all information relevant for the quality assessment of each data record (property measurement of the unique samples). Here, especially information on the measurement conditions (methodology, pressure and temperature conditions, degree of saturation etc.) are documented and used for the implemented semi-automatic quality control and assessment.
10
The first super-entity ‘meta-information’ consist of five tables or entities: sample ID, reference, sampling location, sample information, petrography and stratigraphy. A description of each of these tables is included in the following sub-chapters. The tables for petrography and stratigraphy are available separately. The super-entity ‘rock properties’ contains 28 separate sub- tables for all properties included so far into the database each following a similar internal structure (see chapter 2.4). For many samples measurements of multiple properties were available and included into the database, which results in multiple 15
documentation of the ‘meta-information’ of these samples in the current file structure. The super-entity ‘quality control’
contains two tables or entities, the first one for documentation of the measurement conditions and the second one for the automated quality assessment of the entries (see chapter 2.5)
2.1 Sample Information
To distinguish measurements of different properties on a single sample or of the same properties performed at varying 20
measurement conditions, every measurement is listed in a separate row. To group measurement data from individual samples, every sample receives a unique sample ID, which acts the primary key of each record and links multiple measurements conducted on a single rock sample. The sample ID consists of the surname of the first author and the year of publication, together with a sequential number for the particular rock sample presented in the respective publication. In case of several references per author and year an additional letter (a,b,…) is introduced after the year.
25
For example, Fourier1822_1 stands for sample 1 within a publication of Fourier, J.B.J. (1822). In case of more than one publication per year Fourier1822a_1 would represent sample 1 within a publication of Fourier, J.B.J. (1822a). The sample ID is linked to an accompanying reference database, compatible to all major reference management tools (e.g. EndNote, Citavi, BibTeX, JabRef, etc.), which contains the full information (Co-Authors, full title, journal, volume, pages, etc.) on the reference.
The references are abbreviated in a Bibtexkey according to the terminology used for individual samples. At best, only primary 30
references are given. In case the primary reference is unavailable, while the data point is published as part of a review (or the like), a secondary reference was introduced.
Additionally, the date of input and the name of the person who generated the entry into the database (the editor, listed as contributors in chapter 6 team list) is documented.
Figure 2: Schematic structure of P³ illustrating the three sections or super entities: ‘meta information’, ‘rock properties’ and ‘quality 5
control’. Different input parameters (small font) are grouped according to entities or property sub-tables (italics) they belong to.
2.1.1 Sampling Location
The sub-section ‘sampling location’ contains all relevant information on the location where a sample was obtained. Generally, rock samples can be sampled in an outcrop, a quarry or a well. In case neither the sampling location is given as outcrop, quarry or well, nor any exact coordinates are given in the corresponding publication, the location type “area” is selected. Furthermore, for every location type, a name, a country and state is given (e.g. location type: outcrop, location name: Fontainebleau, location 5
country: France, location state/department: Seine-et-Marne).
2.1.2 Location Coordinates
The location coordinates describe the latitude and longitude based on the UTM-System (Universal Transverse Mercator) with the reference system WGS84 of the sampling point at the surface in decimal degrees. Another category of entry is the elevation given in metres above sea level (m.a.s.l.). In the case of a core sample taken from a well, the latitude and longitude of the 10
wellhead is given. In case of an area with undefined sampling point, e.g. “sample from the Rhenish Massif”, a midpoint from this geological province has been assessed and a radius of uncertainty (in km) for the sampling location is given. For elongated areas (e.g. the Red Sea, the Upper Rhine Graben etc.) the choice of a circular radius of uncertainty artificially increases the uncertainty. The introduction of polygons for the definition of an area is discussed to be included in future releases of the database. If no information is given for the location, the longitude and latitude are noted as 999 to avoid wrong map displays 15
and half the circumference of the earth is used as uncertainty.
2.1.3. Original Sample ID
To allow for reviewing original publications, the primarily given sample identification numbers or names are documented in addition to the P³ sample ID. This makes it easier to search for a specific sample in a publication, which might have been used for further measurements or more detailed descriptions by other authors subsequently or individual users of the database.
20
2.1.4 International Geo Sample Number
The International Geo Sample Number (IGSN, cf. Devaraju et al., 2016, Lehnert et al., 2006) is a unique identifier for samples and specimens collected from the natural environment (http://www.igsn.org/). In order to enable locating, identifying, and citing physical samples, the IGSN number was listed if available. Furthermore, entries allow for cross-linking both, the P³ as well as the IGSN database in order to ensure access to more meta-information like sampling methods, project related 25
information, etc., currently not implemented in P³. As described by Strong et al. (2016) the adoption of IGSNs will ensure compatibility and interoperability with other international databases, including the promotion of standard methods to locate, identify and cite physical samples.
2.1.5 Sample Type
Samples can have different shapes that are particularly relevant for the measurement technique. Core samples do have different characteristics than rock blocks or drill cuttings, etc. so that P³ reserves a separate column for the sample type.
2.1.6 Sample Dimensions [m]
Together with the documentation of the sample type, if available, information about its length, height, width and for cores, 5
diameter, all given in meters, are documented. If the rock property “density” is measured for any sample where the dimensions are given, sample volume and weight might be calculated as well. This additional information together with its petrography was essential to evaluate whether a sample reaches a Representative Elementary Volume (REV) or not.
2.1.7 Sample Coordinates
For several samples taken at a single sampling location (e.g. a large outcrop or quarry), eventually individual sample 10
coordinates are given (longitude, latitude and elevation). For samples from a cored well, additionally, the depth of the sample is given in measured depth (MD) and, if available, in true vertical depth (TVD) referenced to the ground level (i.e. meters below ground level, m b.g.l.). If data on the geometry of deviated wells are available, it is optional to either enter the sample location relative to the wellhead or with its exact location and elevation (with respect to the sea level).
2.2 Petrography or Rock Type 15
The petrography or rock type classification scheme is defined in a complementary database (Bär et al., 2019: P³ - Petrography, http://dx.doi.org/10.5880/GFZ.4.8.2019.P3.p) directly published together with P³. Its internal structure is based on a hierarchical subdivision of rock types, where the rock description generally becomes more detailed with increasing rank of petrographic classification (based on the well database of the Geological Survey of Hessen, Germany: Hessisches Landesamt für Umwelt, Naturschutz, Umwelt und Geologie (HLNUG)). This hierarchical subdivision is based on international 20
conventions (e.g. Bates and Jackson, 1987, Gillespie and Styles, 1999, Robertson, 1999, Hallsworth and Knox, 1999, Bas and Streckeisen, 1991, Schmid, 1981, Fisher and Smith, 1991). Furthermore, the classification corresponds to the subdivision provided by existing property data compilations such as e.g. Hantschel and Kauerauf (2009), Schön (2011), Rybach (1984) and Clauser and Huenges (1995).
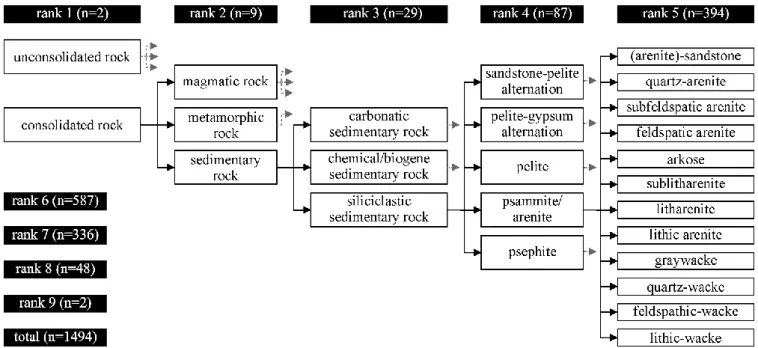
Petrographic classifications from rank 1 to rank 4 can usually be identified from macroscopic descriptions of well logs, cores 25
and geological mapping (Figure 3). The petrographic classifications from rank 5 to rank 9 require additional information on the texture or grain size, the modal composition or the geochemistry etc., which can usually only be acquired by microscopic or comparable special investigations. Overall, there are nine ranks covering a total of 1494 petrographies. The petrographic classification of a sample in P³ is based on the sample description within the original literature reference. A petrographic ID and a corresponding petrographic parental ID directly correlate the different classifications and their ranks (Table 1). This 30
allows for example, to integrate all petrographies with higher ranks to a corresponding general term of lower rank and statistically analyse the associated physical rock property values across petrographic definition boundaries (Figure 3).
Figure 3: Hierarchical system of standardised petrographic terms used for the database. White boxes are an exemplarily chosen 5
extract to illustrate the structure of the petrography classification. Black boxes document the number of rock type categories per rank for the entire classification scheme. These interconnected standardised terms allow for the connection of certain lithologies/petrographies to specific petrophysical properties and are thus the basis for statistical analysis. Black arrows show direct connections, while grey arrows indicate that there are additional terms not displayed here.
10
In P³, the petrographic ID, the petrographic parent ID and the simplified petrographic term are documented. Additionally, for each sample original petrographic descriptions of the primary references can be presented if available. Details on the texture, homogeneity, layering, consolidation state of the sample and the direction of measurement with regard to internal structural features (such as bedding etc.) as well as degree of alteration or weathering can be documented together with specific remarks.
15
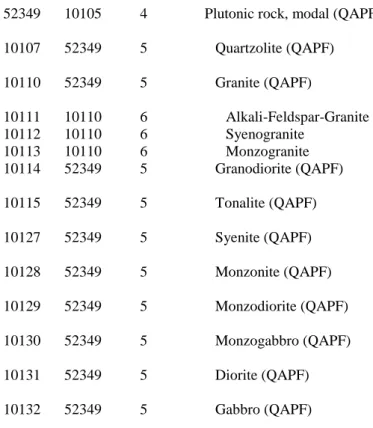
Table 1: Excerpt from the rock classification table used for P³. Different ranks and their interconnection by petrographic ID and petrographic parent ID as well as their connection to international definitions as indicated. QAPF = Quartz-Alkali feldspar- Plagioclase-Foids (Le Maitre and Streckeisen, 2003).
Petro- graphic
ID
Petro- graphic
parent ID
Rank Petrographic term Definition
10102 1 Consolidated rock
10104 10102 2 Magmatic rock Rock formed from magma
10105 10104 3 Plutonic rock Igneous rock with phaneritic texture
52349 10105 4 Plutonic rock, modal (QAPF) Intrusive igneous rock, nomenclature by QAPF- classification for plutonic rocks
10107 52349 5 Quartzolite (QAPF) QAPF-classification for plutonic rocks, field 1a, Qz > 90 vol%
10110 52349 5 Granite (QAPF) QAPF-classification for plutonic rocks, field 2, 3a, 3b, colour index < 90 %
10111 10110 6 Alkali-Feldspar-Granite QAPF- classification for plutonic rocks field 2 10112 10110 6 Syenogranite QAPF- classification for plutonic rocks field 3a 10113 10110 6 Monzogranite QAPF- classification for plutonic rocks field 3b
10114 52349 5 Granodiorite (QAPF) QAPF-classification for plutonic rocks, field 4, colour index < 90 %
10115 52349 5 Tonalite (QAPF) QAPF-classification for plutonic rocks, field 5, colour index < 90 %
10127 52349 5 Syenite (QAPF) QAPF-classification for plutonic rocks, field 7, colour index < 90 %
10128 52349 5 Monzonite (QAPF) QAPF-classification for plutonic rocks, field 8, colour index < 90 %
10129 52349 5 Monzodiorite (QAPF) QAPF-classification for plutonic rocks, field 9, An (PL) <
50 mol%, colour index < 90 %
10130 52349 5 Monzogabbro (QAPF) QAPF-classification for plutonic rocks, field 9, An (PL) >
50 mol%, colour index < 90 %
10131 52349 5 Diorite (QAPF) QAPF-classification for plutonic rocks, field 10, An (PL)
< 50 mol%, 10 % < colour index < 90 %
10132 52349 5 Gabbro (QAPF) QAPF-classification for plutonic rocks, field 10, An (PL)
> 50 mol%, 10 % < colour index < 90 %
2.3 Stratigraphy
The stratigraphy of each sample was inserted into the database in two complementary ways. The first way is to use the definitions of the international chronostratigraphic chart of the IUGS v2016/04 (Cohen et al., 2013, updated) according to international standardisation. These chronostratigraphic units are also compiled in a complementary database (Bär et al., 2019:
5
P³ - Stratigraphy, http://dx.doi.org/10.5880/GFZ.4.8.2019.P3.s) to ensure that formations of a certain age are connected to the corresponding stratigraphic epoch, period or erathem. Thus, the chronostratigraphic units are directly correlated to each other by their stratigraphic ID and stratigraphic parent ID, allowing for statistical analysis of the properties of certain stratigraphic units (Table 2). In contrast, a more detailed description of the local stratigraphic unit can also be documented if provided in the primary reference.
10
Table 2: Excerpt from the stratigraphic classification table used for P³ (based on Cohen et al., 2013, updated). Different ranks and their interconnection by stratigraphic ID and stratigraphic parental ID are indicated. Num. = numerical; SD = standard deviation;
Phan. = Phanerozoic Strati-
graphic ID
Strati- graphic
parent Eon Era Period Series /
Epoch Stage / Age
Num.
Age [Ma]
SD num.
Age
Chronostrati- graphical unit
129 102 Phan. Mesozoic Cretaceous 145 Cretaceous
130 129 Phan. Mesozoic Cretaceous Lower 145 Lower Cretaceous
131 130 Phan. Mesozoic Cretaceous Lower Berriasian 145 Berriasian
132 130 Phan. Mesozoic Cretaceous Lower Valanginian 139.8 Valanginian 133 130 Phan. Mesozoic Cretaceous Lower Hauterivian 132.8 Hauterivian
134 130 Phan. Mesozoic Cretaceous Lower Barremian 129.4 Barremian
135 130 Phan. Mesozoic Cretaceous Lower Aptian 125 Aptian
136 130 Phan. Mesozoic Cretaceous Lower Albian 113 Albian
137 129 Phan. Mesozoic Cretaceous Upper 100.5 Upper Cretaceous
138 137 Phan. Mesozoic Cretaceous Upper Cenomanian 100.5 Cenomanian
139 137 Phan. Mesozoic Cretaceous Upper Turonian 93.9 Turonian
140 137 Phan. Mesozoic Cretaceous Upper Coniacian 89.8 0.3 Coniacian 141 137 Phan. Mesozoic Cretaceous Upper Santonian 86.3 0.5 Santonian 142 137 Phan. Mesozoic Cretaceous Upper Campanian 83.6 0.2 Campanian 143 137 Phan. Mesozoic Cretaceous Upper Maastrichtian 72.1 0.2 Maastrichtian 2.4 PetroPhysical Properties
The properties included in P³ can be grouped into ‘classical’ petrophysical properties, thermophysical properties, mechanical properties as well as electrical and magnetic properties (Figure 2). Overall, 28 different rock properties are included so far and documented in separate sub-tables of the database following a similar internal structure. Based on the original reference, the measurement is given as a value, which if available is complemented by a standard deviation, a minimum and maximum value 5
and the number of measurements. Thus, it is possible to either include single measurements or mean values while still offering the opportunity of statistical evaluation by incorporating the number of measurements corresponding to a mean value.
Furthermore, the measurement method for each property value is presented by means of a common nomenclature documented in the supplementary report (Bär et al., 2019: P³ - Data Description, http://dx.doi.org/10.5880/GFZ.4.8.2019.P3). This is important for statistical analysis and comparability of the results of different methods. Particularly, the type of method might 10
have a large impact on the quality and device-specific error of any measurement. Finally, specific remarks can be made for each value separately.
2.5 Quality Control
As addition of the primary option of manual database quality control, which is by providing the information of the original data source, an automatic quality control was implemented in P³. Therefore minimum requirements for a value to be included 15
in the database were defined as already described in section 2.
To provide a quality estimate for each data entry in terms of provided meta-information, a set of key criteria is automatically analysed: (i) uncertainty of the geographic location, (ii) the rank of petrographic classification, (iii) the rank of stratigraphic classification, (iv) the completeness of information on measurement conditions and, (v) the statistical type of a value (e.g.
single value, mean value etc.). For each key criterion, four different quality classes (excellent =1, average =2, poor = 3; and 20
minimum) are defined and computed to numerical quality indices (qi, Table 3). A bulk quality index is calculated according to
the arithmetic mean of the quality indices of the different criteria, where values < 1.5 are considered excellent, values ≥ 1.5 <
2.5 are considered average and values ≥ 2.5 are considered poor and values > 3.5 only meet the minimum requirements.
2.5.1 Geographic Uncertainty
Concerning the location of the sample, a geodetic accuracy of less than 100 m is considered to be excellent quality, which should always be the case for outcrop samples or drill cores. If the information on the location only contains a description of 5
a geological unit in a certain region or area, the related size of this area is considered for the definition of the quality indices.
If the location can be constrained to a region with a radius of less than 1 km the quality is considered average whereas if the radius of uncertainty is between 1 km and 100 km, it is considered poor. Larger radius of uncertainty is considered as quality class 4.
2.5.2 Petrography or Rock Type 10
If the original petrographic or lithological description allows for the allocation of a petrographic term with a rank of 6 or higher, the quality is considered excellent, for a rank of 5 it is considered average because these petrographic terms usually allow for a distinction of petrographies as used for reservoir- or site-scale geological models. For a rank of ≤ 4 the quality is considered poor (compare Figure 3 and Table 1). To enter the database at all, the petrographic description of a sample has to allow for an allocation of a petrographic term of rank ≥2. This classification at least allows for a distinction of petrographies on a level used 15
for continental-scale geological models.
2.5.3 Stratigraphy
Concerning the stratigraphy of the sample, (i) information on the chronostratigraphic Stage or Age is considered to be excellent, (ii) information on the stratigraphic Series or Epoch is defined as average and (iii) if only the chronostratigraphic System or Period is given, it is considered poor. To enter the database, there is no minimum requirement for the information on the 20
stratigraphic age, since (i) stratigraphy does not directly control physical properties and (ii) scientific users might retrospectively derive stratigraphic information from the sampling location in combination with the petrography of the sample and additional information such as geological maps.
2.5.4 Measurement Conditions
For every data point, the measurement conditions can be entered. These are the temperature (K), pressure (Pa), saturating fluid 25
and the degree of saturation (%) as well as for the mechanical properties additional information about the ambient stress field, σ1, σ2, σ3 (MPa), and the pore pressure of the sample (MPa). For the sonic velocities (vp and vs) the frequency of the sonic pulse and, for the uniaxial compressive strength and related mechanical properties, the strain rate can be given as additional measurement conditions.
The quality assessment of the measurement conditions is based on both the measurement conditions and the measurement device, which is needed to be able to quantify the specific measurement error typical for a certain method. Excellent quality is only provided if information is available on all these points. If only the measurement device and the temperature and pressure conditions or the degree of saturation is available, the data quality is defined as average. If only the device, or the temperature and pressure conditions, or the degree of saturation is described in the original reference the quality is considered to be poor.
5
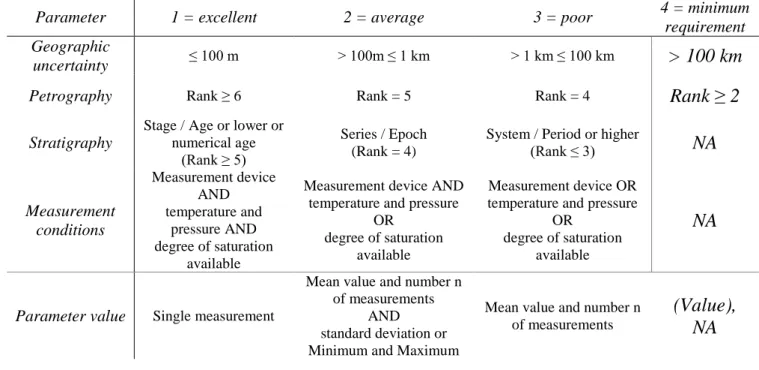
Table 3: Quality indices defined by the input data available. (n = numbers of measurements, NA = not available)
Parameter 1 = excellent 2 = average 3 = poor 4 = minimum
requirement Geographic
uncertainty ≤ 100 m > 100m ≤ 1 km > 1 km ≤ 100 km
> 100 km
Petrography Rank ≥ 6 Rank = 5 Rank = 4
Rank ≥ 2
Stratigraphy
Stage / Age or lower or numerical age
(Rank ≥ 5)
Series / Epoch (Rank = 4)
System / Period or higher
(Rank ≤ 3)
NA
Measurement conditions
Measurement device AND temperature and
pressure AND degree of saturation
available
Measurement device AND temperature and pressure
OR degree of saturation
available
Measurement device OR temperature and pressure
OR degree of saturation
available
NA
Parameter value Single measurement
Mean value and number n of measurements
AND standard deviation or Minimum and Maximum
Mean value and number n of measurements
(Value), NA
2.5.5 Measurement Parameter
The last criterion for the quality control is the type of value representing the property. In general, single measurement values 10
for a sample are ranked higher in quality than mean values of various measurements applied to a sample. Accordingly, single measurements are considered as excellent and mean values as average or poor. If the mean value is not only accompanied by the number of measurements to calculate the mean value, but also by the minimum and maximum as well as the standard deviation from this set of measurements, the quality is defined as average. In contrast, a mean value accompanied only by a number of measurements is defined as poor. Values resulting from an unspecified number of measurements are not considered 15
for quality control but still included into the database with NA (“not available”) in the respective column for number of measurements to enable the user to exclude these values in statistical analyses.
3 Status of the Database, Data Availability and Quality
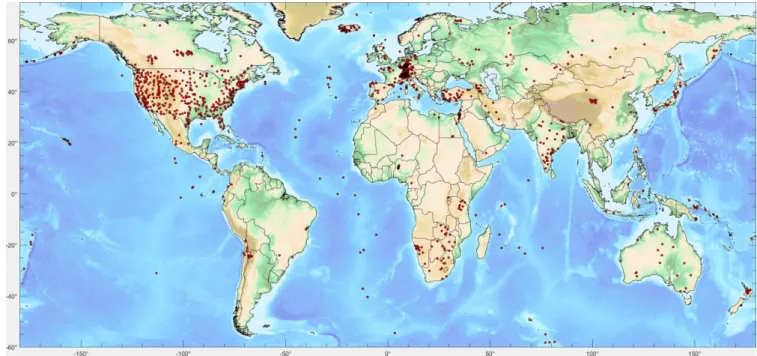
Up to now, data that entered the database are either from published data collections, scientific papers, student’s theses and scientific project or technical reports (316 references altogether, see Appendix 1). So far, 75,573 data points from all over the world (Figure 4 and Figure 5), were collected. The data are not reasonably well around the globe but rather show a strong dominance of samples sourced from central Europe and the United States. This reflects the original purpose of the IMAGE 5
project as well as public availability of existing databases. Data is only scarcely available for Africa, South America, Australia, Russia and China.
Figure 4: Locations of all data points currently included in P3 (for references see Appendix 1). Topographic map is the ETOPO1 10
map (Amante and Eakins, 2009)
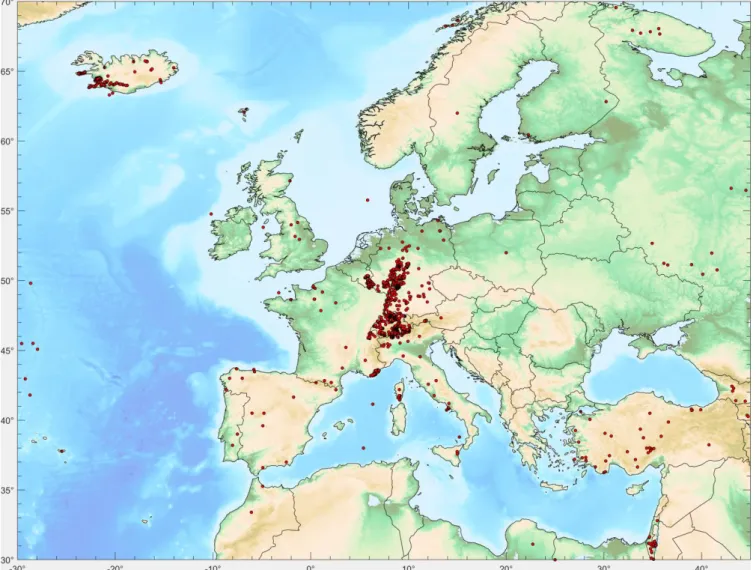
Figure 5: Locations of data points currently included in P3 for the Europe (for references see Appendix 1). Topographic map is the ETOPO1 map (Amante and Eakins, 2009)
The amount of data entries for different petrographies shows that all main consolidated rock types are well represented. With 5
38,219 property measurements from sedimentary rocks 25,261 from magmatic rocks, 9,235 from metamorphic rocks, and 1,308 from unconsolidated rocks, petrographies usually considered as reservoir rocks are dominant making up more than 75%
of the data.
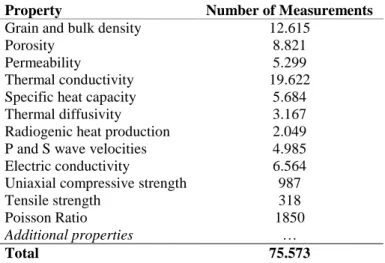
Since P³ was collected to serve the goals of the IMAGE project and will always represent work in progress, its data entries are unevenly distributed among the different properties (Table 4) as well as regions. In its current version, the entries for some 10
properties derive from only a few sources. For example, radiogenic heat production values contained in the database have mainly been derived from the compilation of Vilà et al. (2010). This compilation, which is based on many secondary references,
includes more than 2,100 representative U, Th and K concentrations from all over the world (originally published in 102 studies). Based on this chemical composition database, Vilà et al. (2010) calculated values of radiogenic heat production for a large variety of rock types. Of the original compilation (of Vilà et al., 2010), we have incorporated into the database only those values that were associated with sufficient metadata and based on actual lab investigations and not on spectral gamma ray and density data of borehole geophysical logs. Newer compilation on radiogenic heat production (e.g. Hasterock & Webb, 2017 5
and Hasterock et al., 2017) have not yet been included.
Table 4: Number of measurements of the different properties in P3.
Property Number of Measurements
Grain and bulk density 12.615
Porosity 8.821
Permeability 5.299
Thermal conductivity 19.622
Specific heat capacity 5.684
Thermal diffusivity 3.167
Radiogenic heat production 2.049
P and S wave velocities 4.985
Electric conductivity 6.564
Uniaxial compressive strength 987
Tensile strength 318
Poisson Ratio 1850
Additional properties …
Total 75.573
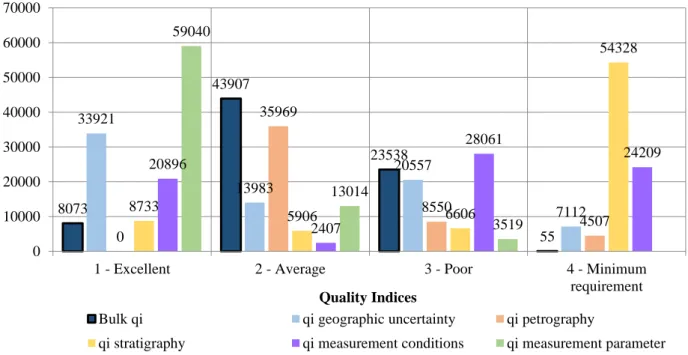
Concerning the data quality, the quality indices both for the bulk index as well as for the five indices defined in Table 3 show 10
a wide dispersion over all quality classes. The quality indices for the petrography, the geographic uncertainty and the measurement parameter show mainly quality values of 1 to 3 representing a good quality of input data documentation in average. Only the quality indices for measurement conditions and for the stratigraphy, where quality index values of 3 and 4 are dominant show that the documentation of these metadata is not satisfactory for a large share of the compiled data.
15
Figure 6: Overview of the quality indice distribution of the P³ input data quality assessment. For the definition of the quality indices see Table 3.
4. Discussion
The current status of the database already shows a lot of benefits that such a compilation has automatically brings along, but 5
also some limitations, which have to be addressed in future amendments. The defined minimum requirements for a datum to be integrated into P³ guarantee its usability in terms of statistical, spatial, petrographic and stratigraphic analyses. Since it also contains multiple properties measured on a single sample, direct correlations with other data and properties are facilitated. This may help identifying new relationships (formal, causal or statistical correlations), and contribute to a better understanding of the limitations of generalisation or possibilities for upscaling approaches. The automatic quality assessment allows for a quick 10
evaluation of a single datum within a group of selected entries. The possibility of correlating data also simplifies and accelerates the identification of key references for rock parameters in specific regions, for specific rock types, or stratigraphic units.
Furthermore, the database allows to systematically analyse the dependency of property values on the corresponding measurement conditions. Thus, the most important added value of P³ compared to existent databases is its dimension (large number of entries corresponding to a large number of petrophysical properties) as well as the documented meta-information.
15
Despite all benefits, such a database can never be complete and is always prone to uncertainties. To identify errors in original publications (in terms of property values and meta-information, e.g. sample preparation, accuracy of measurements, sampling bias, lab worker bias, measurement methods, reference standards and many more) is beyond the scope of this compilation. In addition, data-input errors, errors concerning the interpretation or the petrographic and stratigraphic classification cannot be
8073
43907
23538
55 33921
13983
20557
7112 0
35969
8550
4507
8733 5906 6606
54328
20896
2407
28061
24209 59040
13014
3519 0
10000 20000 30000 40000 50000 60000 70000
1 - Excellent 2 - Average 3 - Poor 4 - Minimum
requirement
Frequency
Quality Indices
Bulk qi qi geographic uncertainty qi petrography
qi stratigraphy qi measurement conditions qi measurement parameter
excluded. We assume that the quality check of the original publications and the data therein has already been done by skilled reviewers or editors of the corresponding scientific journals, respectively theses. In addition to that, the quality indices developed as part of P³ allow the user to quickly evaluate the quality of each data point and thus help with the decision whether the original reference should be re-assessed or not.
Additionally, P³ includes values generated with different established or newly developed measurement methods, delivering 5
data of different quality and uncertainty. Hence, data comparability is not necessarily granted and a statistic assessment can only be representative if these effects are considered. Due to the documentation of the original source, however, the related detailed information of a chosen sample set can be verified if necessary. For subsequent applications, such as modelling, the spatial distribution of the data has to be considered as well as the origin of the samples. Due to diverse effects (such as temperature, pressure, weathering, diagenetic history, etc.), properties measured from outcrop analogue samples might differ 10
considerably in quality from those of the same formation at in-situ conditions within a deep reservoir formation. It remains to the experienced user to evaluate if the tabulated datum is applicable and if sufficient meta-information is given. In case of doubt, the users are referred to the original publications.
5 Conclusions and Perspectives
We developed the P³ database of petrophysical rock properties measured on rock samples in various laboratories. P³ is designed 15
to be as transparent and useful for various purposes as possible through the integration of multiple meta-information (including the original reference) for each data point. The database already comprises a great variety of properties, petrographies, stratigraphies etc. from samples investigated all over the world. In this first release, 75.573 data points from 316 publications were included. The current compilation of samples mainly reflects the project goals of the geothermal project IMAGE (van Wees et al., 2015), while the applicability of P³ certainly can be seen in various geoscientific fields focusing on subsurface 20
utilisation (e.g. oil and gas, CCS, hydrogeology, subsurface storage of radioactive waste etc.). The collected data will help researchers and users particularly in the early stages of new geothermal or any other projects to make a first assessment of the subsurface geothermal rock properties. This will help planning future exploration needs and, in areas where the existing data density is sufficient, even support direct modelling or exploitation projects. Additionally, the database will help improving local and regional geoscientific studies with different focus on utilisation of the subsurface. A first release of this database (Bär 25
et al 2019: P³ - Database, http://dx.doi.org/10.5880/GFZ.4.8.2019.P3) including a report and a reference list of all included publications is available as supplementary data to this publication.
Compiling the data from various sources, however, has shown that the general documentation of measured petrophysical properties is very heterogeneous and often the minimum requirements defined for our P³ were not fulfilled. We therefore appeal to the reviewers and editors of scientific journals to ensure that any publication containing original measurements of 30
petrophysical properties should come along with all the helpful and necessary meta-information as described here. Only if
these requirements are fulfilled, a published dataset is of added value for the scientific community and can be used for subsequent investigations or applications.
Since a database like P³ can never be complete, a further extension based on not yet considered publications, newly published data or own measurements is foreseen. Furthermore, we both hope to collaborate with existing compilation authors in the future to combine the collations into one more useful systems but also support the use of this version of the P³ database for 5
other database initiatives as supplement of their own records. We plan to develop a publicly accessible web-based interface to facilitate external users to perform specific queries on petrophysical properties. In addition, such queries shall be feasible based on a web-based geographic information system, which may be connected to additional information such as worldwide geological maps (e.g. OneGeology, www.onegeology.org). With this system, external users shall be given the opportunity to contribute to the database and thereby simplifying the access to measurements, which may improve their visibility 10
considerably. Thus, the database will be continuously updated and at certain stages newly released by the editors. For this purposes the database will be implemented using a relational database management system (RDBMS) following the third normal form (3NF) according to Codd (1970) and Maier (1983) to reduce the volume of stored data by elimination of multiple storage of the same information for a sampling location, which will strongly increase its flexibility, durability and applicability especially for the SQL-experienced user. This will facilitate to link P³ to similar databases in the future.
15
To broaden the applicability of P³ for reservoir characterisation in the future, the integration of lab measurement or geophysical exploration methods aiming at the determination of petrophysical reservoir properties on smaller or larger scale is currently in discussion and will allow to include information on the scale-dependence of petrophysical properties (e.g. Enge et al., 2007) which are of paramount importance for understanding of reservoir behaviour. This could include properties derived from geophysical well logging (Hartmann et al., 2005, Fuchs et al., 2015), hydraulic testing in wells (Achtziger-Zupančič et al., 20
2017 and references therein) or other integrating geophysical exploration methods e.g. seismics (Gu et al., 2017), gravimetry or electromagnetic methods (e.g. Munoz et al., 2010, Meqbel and Ritter, 2015). Furthermore, additional information on the sample like their geochemical or modal composition from XRF, ICP-MS or ICP-OES analyses, point counting of thin sections or electron microscopic investigation of e.g. cementation, pore geometry or microfractures, which can all act as controlling factors of petrophysical properties would be a helpful extension of the database. Therefore existing databases could be easily 25
implemented (e.g. Lehnert et al., 2000, Mortimer et al., 2005, Strong et al., 2015 and Gard et al., 2019 and references therein).
This will extend the opportunity to also use the database to derive phenomenological constitutive models for petrophysical rock properties from their chemical or mineralogical composition (Chopra et al., 2018, Gard et al., 2019) or from their microstructure (Pimienta et al., 2014) or to develop empirical correlations between distinct properties of certain rock types (Gegenhuber and Schön, 2012, Esteban et al., 2015, Mielke et al., 2017).
30
6 Appendix 1: List of references for Figures 4 and 5
Adelinet et al. (2013), Alam et al. (2011), Altherr et al. (2000), Aretz (2015), Ashwal et al. (1987), Aswathanarayana (1986), Atal et al. (1978), Attoh (2000), Babaie et al. (2001), Bär (2008, 2012), Baker et al. (1997), Balakrishna & Ramana (1968), Ballard et al. (1987), Barrett & Aumento (1970), Bauluz et al. (2000), Bea & Montero (1999), Bemmlott (2014), Best &
Christiansen (2002), Betten (2015), Bhatia & Crook (1986), Biewer (2014, 2017), Birch & Clark (1940), Birch (1942), 5
Blackwell & Richards (2004), Brady et al. (2006), Brandt et al. (2004), Brehme et al. (2016a, b), Brettreich (2016), Bridgman (1924), Brigaud et al. (1992), Brown et al. (1981), Bullard (1939), Bultitude et al. (1978), Buntebarth (1980), Carroll (1969), Cebriá et al. (2000), Ceryan (2008), Ceryan et al. (2008), Chapman & Pollack (1977), Chappell (1999), Chung (1999), Chung et al. (1995, 2001), Clark (1957, 1961, 1966), Clauser (2001), Cocherie (1984), Cocherie et al. (1994), Condie (1993), Coster (1948), Côté & Konrad (2005), Crecraft et al. (1981), Creutzburg, H. (1965), Dahmani& Sawyer (2001), Damm et al. (1990), 10
Dickson & Scott (1997), Diment (1964), Dodge et al. (1986), Dongmo (2016), Ducea & Saleeby (1998), Dupré & Echeverría (1984), Eberhard (2005), El Dakak (2015), Ensor (1931), Esteban et al. (2015), Ewart et al. (1973, 1977), Faridfar (2010), Farmer (2003), Farmer et al. (2002), Farquharson et al. (2016a, b), Förster & Förster (2000), Fountain et al. (1987), Fourcade
& Allegre (1981), Fowler et al. (2005), Francois & Lemmet (1999), Franzson et al. (2010, 2011), Fridleifson &
Vilmundardottir (1998), Fuji-ta et al. (2004, 2007, 2011), Gärtner (2017), Galán et al. (1996), Gangadharam &
15
Aswathanarayana (1969), Gao et al. (1998), Garcia-Gutierrez & Contreras (2007), Gaunt et al. (2014), Gehlin (2002), Gehlin
& Hellstrom (2003), Geist (2011), GeORG-Projektteam (2013), Ghazi & Hassanipak (1999),Gill (1981), Gill & Whelan (1989) Glover (1989), Glover & Vine (1992, 1994, 1995), Grecksch et al. (2003), Grunert (2007), Gu (2010), Gudmundsson et al.
(1995), Gühne (2016), Guillot & Fort (1995), Guillou-Frottier et al. (1995), Gupta et al. (1991), Haack (1983), Haffen et al.
(2012, 2013), Hartmann et al. (2005), Hauff et al. (2000), Heap et al. (2009, 2011, 2012, 2014a, b, 2015a, b, c, 2016), Herrin 20
& Clark (1956), Hesse (2011), Hill et al. (1981), Hoffmann (2011, 2015), Hofmann (1988), Homuth (2014), Hooper &
Hawkesworth (1993), Huber et al. (2001), Hückel & Kappelmeyer (1966), Hurtig & Brugger (1970), Hutt & Berg (1968), Hyndman & Jessop (1971), Inger & Harris (1993), Innocent et al. (1994), Islam (2010), Iyer et al. (1984), Jaupart et al. (1982), Jaya et al. (2010), Jensen (2014), Jeong et al. (2007), Jochum et al. (1983), Jodocy & Stober (2011), Johannes et al. (2003), John & Wooden (1990), Jones (1987, 1988), Kahraman (2007), Kalsbeek et al. (2001), Kappelmeyer & Haenel (1974), Kassab 25
& Weller (2011, 2015), Kawada (1964, 1966), Kay & Kay (1994), Kay et al. (1990), Keen & Lewis (1982), Kelemen et al.
(2007), Kemp & Hawkesworth (2003), Kendrick et al. (2013a, b), Kennedy & Russell (2012), Kennedy et al. (2009), Kerr (2003), Khitarov et al. (1959), Kidder et al. (2003), Kläske (2010), Klein (2003), Klug & Cashman (1996), Klumbach (2008, 2010), Knopoff (1968), Königsberger & Weiss (1911), Kolzenburg et al. (2012), Konzack (2015), Kramers et al. (2001), Kraus (2009), Kristinsdóttir et al. (2010), Kukkonen et al. (1997), Kumar & Reddy (2004), Kumari et al. (2017), Lambert (2016), 30
Laštovičková et al. (1993), Ledesert (1993), Leonidov (1967), Leonidov et al. (1966), Lesquer et al. (1983), Leu et al. (2006), Linsel (2014), Loaiza et al. (2012), Luais & Hawkesworth (1994), Lucazeau & Mailhe (1986), Mack (2007), Mahood (1981), Maire (2014), Manghnani & Woollard (2013), Mareschal et al. (2000), Mariucci et al. (2008), Marzán Blas (2000), McDermott
et al. (1996), McDonough (1990), McKenna & Sharp (1998), McLaren et al. (1999), McLennan et al. (1990), Mengel et al.
(2001), Mielke (2009), Mielke et al. (2015), Milicevic (2015), Milord et al. (2001), Misener et al. (1951), Mitchell (1995), Moiseenko (1968), Moiseenko & Sokolova (1965, 1968), Moiseenko et al. (1965, 1967), Montanini & Tribuzio (2001), Mossop & Gafner (1951), Mottaghy et al. (2005), Müller (2014), Munck et al. (1979), Murti (1980), Nabawy et al. (2009), Nabawy et al. (2010), Narayanaswamy & Venkatasubramanian (1969), Nehler (2011), Nicolaysen et al. (1981), Noritomi &
5
Asada (1955), Nyblade et al. (1990), Oelsner (1981), Orendt (2014), Pannike et al. (2006), Pannike (2005), Parkhomenko &
Bondarenko (1972), Paslick et al. (1995), Peate (1997), Peccerillo & Taylor (1976), Pei (2009), Pereira et al. (1986), Pickett
& Saleeby (1993), Plank & Langmuir (1998), Pola et al. (2012, 2014), Popov et al. (1999), Pribnow et al. (2000), Price et al.
(1997), Priebs (2011), Rao & Rao (1979, 1983), Rao et al. (1972), Ray et al. (2015), Rebay & Spalla (2001), Reyer & Philipp (2014), Reynaud et al. (1999), Roberts et al. (2000), Rogers et al. (1998), Rolandone et al. (2002), Rosener (2007), Rudnick 10
& Fountain (1995), Rudnick et al. (1998), Rudnick (1992), Rüther (2011), Rummel (1991, 1992), Rummel & Schreiber (1993), Russell et al. (2001), Rybach et al. (2003), Sakvarelidze (1973), Salters et al. (1992), Salton (1999), Sandiford et al. (1 2002), Sandkühler (2015), Sanner & Anderson (2001), Sanner et al. (2000), Sass et al. (1971), Sawka & Chappell (1988), Schäffer (2012), Schärli & Kohl (2002), Schintgen (2015), Schön (1983, 1996, 1998), Schöpflin (2013), Schubert (2011), Schumann (2008), Schütz (2013), Schwalb (2012, 2014), Shimojuku et al. (2012), Sighinolfi et al. (1981), Sikora (2015), Sims et al.
15
(1984), Siratovich (2010), Siratovich et al. (2014, 2016), Sizun (1995), Smith & Johnson (1981), Smith et al. (2011), Stober
& Bucher (2007), Stober & Jodocy (2009), Sun & McDonough (1989), Sundberg (1988), Surma (2003), Surma & Geraud (2003), Swanberg (1972), Taylor et al. (1983, 1994), Tchameni et al. (2000), Tejada et al. (1996, 2002), Thompson et al.
(2001), Trautwein (2005), Ucok (1979), Ufondu (2012), VDI 4640 Blatt 1 (2010), Verdoya et al. (1998), Vernoux & Lambert (1993), Vernoux et al. (1995), Vilà et al. (2010), Villaseca et al. (1999), Violay et al. (2010), Violay et al. (2012a, b), Vogel 20
(2016), Volarovich (1968), Walters & Combs (1991), Wang et al. (2009), Weaver et al. (1987), Weber (2014, 2016), Weinert (2014), Welsch (2011, 2012), Welsch et al. (2015), Wenk & Wenk (1969), Weydt (2016), Whitford (1975), Wicke (2009), Wickham (1987), Wiesner (2014), Winkler (1952), Wittig (2017), Zhao et al. (2016), Zhu et al. (2011, 2016), Zilch (2011), Zoth (1986)
25
7 Copyright statement
The author(s) retain the copyright of the manuscript. Authors grant Copernicus Publications a licence to publish the article and identify itself as the original publisher. Authors grant Copernicus Publications commercial rights to produce hardcopy volumes of the journal for purchase by libraries and individuals. Authors grant any third party the right to use the article freely under the stipulation that the original authors are given credit and the appropriate citation details are mentioned.
30
8 Data availability – Supplement links
Supplement 1: Excel version of P³ Database (Bär, Kristian; Reinsch, Thomas; Bott, Judith (2019): P³ - PetroPhysical Property Database. V. 1.0. GFZ Data Services. Potsdam. http://dx.doi.org/10.5880/GFZ.4.8.2019.P3)
Supplement 2: Petrographic classification table (Petrography), included in P³ (Bär, Kristian, Mielke, Philipp, Knorz, 5
Katharina (2019): Petrographic classification table (Petrography): P³ - Petrography. V. 1.0. GFZ Data Services. Potsdam.
http://dx.doi.org/10.5880/GFZ.4.8.2019.P3.p)
Supplement 3: Stratigraphic classification table (Stratigraphy), included in P³ (Bär, Kristian, Mielke, Philipp (2019):
Stratigraphic classification table (Stratigraphy): P³ - Stratigraphy. V. 1.0. GFZ Data Services. Potsdam.
10
http://dx.doi.org/10.5880/GFZ.4.8.2019.P3.s)
9 Team list
Authors: Kristian Bär1, Thomas Reinsch2, Judith Bott2,
Contributors: Alexander Strom2, Philipp Mielke1, Jessica Freymark2,3, Peter Wiesner1, Ingo Sass1,4
A. Strom and P. Mielke, reviewed and collected the literature, transferred the data from literature or own sources into the 15
database and restructured the database where needed. A. Strom and P. Mielke J. Freymark, P. Wiesner, R. Schmidt, S.
Krombach, C. Meeßen, C. Sikora, E. Reinosch, L. Dieck, P. Knöll and Benoȋt Gibert also collected and reviewed publications for the database. I. Sass contributed to develop the general concept of such a database in early discussions.
1Department of Geothermal Science and Technology, Institute of Applied Geosciences, Technische Universität Darmstadt, Schnittspahnstr.
20
9, Darmstadt, 64287, Germany
2 GFZ German Research Centre for Geosciences , , Telegrafenberg, Potsdam, 14473, Germany
3Faculty of Georesources and Material Engineering, RWTH Aachen, Intzestr. 1, Aachen, 52056, Germany
4Darmstadt Graduate School of Excellence Energy Science and Engineering, Jovanka-Bontschits-Str. 2, Darmstadt, 64287, Germany 25
10 Author contribution
K. Bär, T. Reinsch and J. Bott defined the scope of this work, designed and structured the database and defined the criteria for the quality control. Furthermore, they collected and reviewed most of the referenced literature and supervised the team, who reviewed and collected the literature, transferred the data from literature or own sources into the database and restructured the database where needed. K. Bär did the major part of the quality control. K. Bär prepared the manuscript with significant 30
contributions from T. Reinsch and J. Bott.
10 Disclaimer
The authors declare that they have no conflict of interest.
11 Acknowledgements
The research leading to these results has received funding from the European Community’s Seventh Framework Programme under EU grant agreement No. 608553 (Project IMAGE). We thank all contributors and also our external cooperation partners 5
for their support and work to fill the database with valuable data or by providing valuable reports or publications to be included in the compilation.
12 References
Achtziger-Zupančič, P., Loew, S., Mariethoz, G.: A new global data base to improve predictions of permeability distribution in crystalline rocks at site scale, J. Geophys. Res. Solid Earth, 122(5), 3513-3539, http://dx.doi.org/10.1002/2017JB014106, 10
2017.
Adelinet, M., Fortin, J., Schubnel, A. and Guéguen, Y.: Deformation modes in an Icelandic basalt: From brittle failure to localized deformation bands. Journal of Volcanology and Geothermal Research, 255, 15-25.
doi:10.1016/j.jvolgeores.2013.01.011, 2013.
Alam, M. M., Fabricius, I. L. and Prasad, M.: Permeability prediction in chalks. AAPG Bulletin, 95, 1991-2014.
15
doi:10.1306/03011110172, 2011.
Altherr, R., Holl, A., Hegner, E., Langer, C. and Kreuzer, H.: High-potassium, calc-alkaline I-type plutonism in the European Variscides: northern Vosges (France) and northern Schwarzwald (Germany). Lithos, 50, 51-73. doi:10.1016/S0024- 4937(99)00052-3, 2000.
Amante, C., Eakins, B.W.: ETOPO1 1 Arc-Minute Global Relief Model: Procedures, Data Sources and Analysis. NOAA 20
Technical Memorandum NESDIS NGDC-24. National Geophysical Data Center, NOAA.
http://dx.doi.org/10.7289/V5C8276M [2019/03/04]. 2009.
Aretz, A., Bär, K., Götz, A.E., Sass, I.: Outcrop analogue study of Permocarboniferous geothermal sandstone reservoir formations (northern Upper Rhine Graben, Germany): Impact of mineral content, depositional environment and diagenesis on petrophysical properties, Int. J. Earth Sci. (Geol. Rundsch.), 135, 1431–1452, http://dx.doi.org/10.1007/s00531-015-1263- 25
2, 2015.
Aretz, A.: Aufschlussanalogstudie zur geothermischen Reservoircharakterisierung des Permokarbons im nördlichen Oberrheingraben. PhD Thesis, TU Darmstadt. available at: http://nbn-resolving.de/urn:nbn:de:tuda-tuprints-52485, 2015.
Ashwal, L. D., Morgan, P., Kelley, S. A. and Percival, J. A.: Heat production in an Archean crustal profile and implications for heat flow and mobilization of heat-producing elements. Earth and Planetary Science Letters, 85, 439-450.
doi:10.1016/0012-821X(87)90139-7, 1987.
Aswathanarayana, U.: Principles of Nuclear Geology. Balkema Rotterdam. ISBN 90-619-1572-4, available at:
https://inis.iaea.org/search/search.aspx?orig_q=RN:19076043, 1986.
5
Atal, B. S., Bhalla, N. S., Lall, Y., Mahadevan, T. M. and Udas, G. R.: Padioactive Elemental Distribution in the Granjlite Terrains and Dearwar Schist Belis of Peninsular India. In B. F. Windley and S. M. Naqvi (Eds.), Archaean Geochemistry (Bd. 1, S. 205-220). Elsevier. doi:10.1016/S0166-2635(08)70099-9, 1978.
Attoh, K.: Contrasting Metamorphic Record of Heat Production Anomalies in the Penokean Orogen of Northern Michigan.
The Journal of Geology, 108, 353-361. doi:10.1086/314406, 2000.
10
Australian Government – Geoscience Australia: Rock Properties Explorer Version 2.0.5: http://www.ga.gov.au/explorer- web/rock-properties.html, last access: 26 February 2020.
Babaie, H. A., Ghazi, A. M., Babaei, A., Tour, T. E. and Hassanipak, A. A.: Geochemistry of arc volcanic rocks of the Zagros Crush Zone, Neyriz, Iran. Journal of Asian Earth Sciences, 19, 61-76. doi:10.1016/S1367-9120(00)00012-2, 2001.
Bär, K. M.: 3D-Modellierung des tiefengeothermischen Potenzials des nördlichen Oberrheingrabens und Untersuchung der 15
geothermischen Eigenschaften des Rotliegend. Diplomathesis, TU Darmstadt, 2008.
Bär, K. M.: Untersuchung der tiefengeothermischen Potenziale von Hessen. PhD Thesis, TU Darmstadt. available at:
http://nbn-resolving.de/urn:nbn:de:tuda-tuprints-30671, 2012.
Bär, K., Reinsch, T., Bott, J. (2019): P³ - PetroPhysical Property Database. V. 1.0. GFZ Data Services. Potsdam.
http://dx.doi.org/10.5880/GFZ.4.8.2019.P3 20
Bär, K., Mielke, P., Knorz, K. (2019): Petrographic classification table (Petrography): P³ - Petrography. V. 1.0. GFZ Data Services. Potsdam. http://dx.doi.org/10.5880/GFZ.4.8.2019.P3.p
Bär, K., Mielke, P. (2019): Stratigraphic classification table (Stratigraphy): P³ - Stratigraphy. V. 1.0. GFZ Data Services.
Potsdam. http://dx.doi.org/10.5880/GFZ.4.8.2019.P3.s
Baker, J. A., Menzies, M. A., Thirlwall, M. F. and MacPherson, C. G.: Petrogenesis of Quaternary Intraplate Volcanism, 25
Sana'a, Yemen: Implications for Plume-Lithosphere Interaction and Polybaric Melt Hybridization. Journal of Petrology, 38, 1359-1390. doi:10.1093/petroj/38.10.1359, 1997.
Balakrishna, S. and Ramana, Y. V.: Integrated Studies of the Elastic Properties of Some Indian Rocks. In L. Knopoff, C. L.
Drake and P. J. Heart (Hrsg.), Geophysical Monograph 12: The Crust and Upper Mantle of the Pacific Area (Bd. 12, S. 489- 500). American Geophysical Union. doi:10.1029/GM012p0489, 1968.
30
Ballard, S., Pollack, H. N. and Skinner, N. J.: Terrestrial heat flow in Botswana and Namibia. Journal of Geophysical Research:
Solid Earth, 92, 6291-6300. doi:10.1029/JB092iB07p06291, 1987.
Barrett, D. L. and Aumento, F.: The Mid-Atlantic Ridge near 45 N. XI. Seismic velocity, density, and layering of the crust.
Bates, R. L., Jackson, J. A.: Glossary of geology, Third Edition, American Geological Institute, Alexandria, Virginia, USA, 1987.
Bauluz, B., Mayayo, M. J., Fernandez-Nieto, C. and Lopez, J. M.: Geochemistry of Precambrian and Paleozoic siliciclastic rocks from the Iberian Range (NE Spain): implications for source-area weathering, sorting, provenance, and tectonic setting.
Chemical Geology, 168, 135-150. doi:10.1016/S0009-2541(00)00192-3, 2000.
5
Bea, F. and Montero, P.: Behavior of accessory phases and redistribution of Zr, REE, Y, Th, and U during metamorphism and partial melting of metapelites in the lower crust: an example from the Kinzigite Formation of Ivrea-Verbano, NW Italy.
Geochimica et Cosmochimica Acta, 63, 1133-1153. doi:10.1016/S0016-7037(98)00292-0, 1999.
Bemmlott, J.: Untersuchung der geothermischen Gesteinskennwerte von Kulmgrauwacke (Oberharz) und Tanner Grauwacke (Nordhessen). Masterthesis, TU Darmstadt, 2014.
10
Best, M. G. and Christiansen, E. H.: Igneous Petrology. Blackwell Science. doi: 10.1017/S0016756802216507, 2002.
Betten, I.: 3D-Laserscanning, DFN-Modellierung und Aufschlussaufnahme im Rotliegend des östlichen Saar-Nahe-Beckens.
Masterthesis, TU Darmstadt, 2015.
Bhatia, M. R. and Crook, K. A.: Trace element characteristics of graywackes and tectonic setting discrimination of sedimentary basins. Contributions to Mineralogy and Petrology, 92, 181-193. doi:10.1007/BF00375292, 1986.
15
Biewer, H.: Bestimmung der Temperaturabhängigkeit der Wärmekapazität und Wärmeleitfähigkeit von Karbonatgesteinen der Schwäbischen und Fränkischen Alb. Bachelorthesis, TU Darmstadt, 2014.
Biewer, H.: Vergleich von Eigenschaften petrothermaler Reservoirgesteine des Gonghe- Beckens und Tromm-Granits / Weschnitz-Plutons. Masterthesis, TU Darmstadt, 2017.
Birch, A. F. and Clark, H.: The thermal conductivity of rocks and its dependence upon temperature and composition. American 20
Journal of Science, 238, 529-558. doi:10.2475/ajs.238.8.529, 1940.
Birch, F.: Handbook of physical constants. In F. Birch, J. F. Schairer and H. C. Spicer (Hrsg.). Geological Society of America.
doi: 10.1130/SPE36, 1942.
Blackwell, D. D. and Richards, M. C.: Geothermal Map of North America: American Association of Petroleum Geologists.
Tulsa, Oklahoma, scale, 1. available at: https://www.smu.edu/-/media/Site/Dedman/Academics/Programs/Geothermal- 25
Lab/Graphics/Geothermal_MapNA_7x10in.gif?la=en, 2004.
Brady, R. J., Ducea, M. N., Kidder, S. B. and Saleeby, J. B.: The distribution of radiogenic heat production as a function of depth in the Sierra Nevada Batholith, California. Lithos, 86, 229-244. doi:10.1016/j.lithos.2005.06.003, 2006.
Brandt, W., Hanschke, T. and Kaiser, H.: Zum Stand der Nutzung der oberflächennahen Geothermie in Norddeutschland.
Proceedings 8. Geothermische Fachtagung, 2004.
30
Brehme, M., Blöcher, G., Cacace, M., Kamah, Y., Sauter, M. and Zimmermann, G.: Permeability distribution in the Lahendong geothermal field: A blind fault captured by thermal–hydraulic simulation. Environmental Earth Sciences, 75.
doi:10.1007/s12665-016-5878-9, 2016a.