Chemical Impurities and Physical Properties of Polar Ice
D
ISSERTATIONder Mathematisch-Naturwissenschaftlichen Fakultät der Eberhard Karls Universität Tübingen
zur Erlangung des Grades eines Doktors der Naturwissenschaften
(Dr. rer. nat.)
vorgelegt von
J
ANE
ICHLER aus Cheb / TschechienTübingen 2019
Tag der mündlichen Qualifikation: 26. April 2019
Dekan: Prof. Dr. Wolfgang Rosenstiel
1. Berichterstatter: Jun.-Prof. Dr. Ilka Weikusat 2. Berichterstatter: Prof. Dr. Paul D. Bons
iii
v
EBERHARD KARLS UNIVERSITÄT TÜBINGEN Mathematisch-Naturwissenschaftliche Fakultät
Geowissenschaften
Chemical Impurities and Physical Properties of Polar Ice Dissertation
von Jan EICHLER
Zusammenfassung
Der Grönländische und der Antarktische Eisschild sind die größten Süßwasserreser- voirs unseres Planeten. Das darin enthaltene Eis bildete sich über Jahrtausende aus dem Niederschlag und durch natürliche Verdichtung von Schnee, und stellt damit ein einzigartiges Klimaarchiv dar. Die großen Eismassen fließen unter ihrem eigenen Gewicht und verfrachten so Eis vom Landesinneren in die Ozeane. Die Eisdynamik wird mithilfe von numerischen Fließmodellen simuliert, u. a. um den zukünftigen Beitrag von Eisschilden zum Meeresspiegelanstieg zu prognostizieren. Die visko- plastische Verformung von Eis auf der Mikroskala involviert ähnliche Mechanis- men wie die Deformation anderer polykristalliner Materialen. Die Scherung einzel- ner Kristalle wird durch Rekristallisation und Bildung bestimmter Mikrostrukturen begleitet. Daher können Konzepte und Vorgehensweisen der Strukturgeologie auf natürliche Eisproben angewandt werden, um ihren Deformationsstatus und die dar- an beteiligten Prozesse zu studieren.
Chemische Spurenstoffe im Schnee und Eis setzen sich mit dem Niederschlag ab und spiegeln die Zusammensetzung der in der Atmosphäre enthaltenen Aerosole wider. Als solche spielen sie eine wichtige Rolle für paläoklimatische Rekonstruktio- nen. Trotz ihrer extrem niedrigen Konzentrationen beeinflussen Spurenstoffe viele physikalischen Eigenschaften von Eis, insbesondere auch das Deformationsvermö- gen. Konzentrationschwankungen diverser Spurenstoffkomponenten mit der Tie- fe korrelieren mit Heterogenitäten im Fließgeschwindigkeitsprofil und scheinen die Bildung von lokalisierten Scherzonen zu begünstigen. Ein besseres Verständnis die- ser Zusammenhänge und der dahinterstehenden Mechanismen ist notwendig um den Effekt von Spurenstoffen realistisch in Fließmodelle implementieren zu können.
Die vorgelegte Arbeit befasst sich mit dem Zusammenhang zwischen chemi- schen Spurenstoffen und physikalischen Eigenschaften von polarem Eis. Eine zen- trale Herausforderung ist es zu verstehen, in welcher Form und wo Spurenstoffe in der Eismatrix integriert sind, bzw. wie sie mit ihr während der Deformation und Rekristallisation interagieren. Natürliches Eismaterial aus Eiskernbohrungen wur- de mittels einer Kombination verschiedener Methoden zur Mikrostrukturanalyse untersucht. Die Verteilungen und Zusammensetzungen von Spurenstoffen wurden mittels eines konfokalen Kryo-Raman-Mikroskops analysiert. Im Rahmen dieser Ar- beit wurden neue Routinen zur Messung und Datenerfassung entwickelt.
Die Ergebnisse zeigen ein komplexes Zusammenspiel zwischen Spurenstoffen, Kristallstruktur und lokalisierter Deformation von Eis. Einerseits verursachen hohe Spurenstoffkonzentrationen höhere Deformationsraten, die von feinkörniger Kris- tallstruktur begleitet werden. Andererseits wird die Verteilung und möglicherweise Zusammensetzung der Spurenstoffe durch die Deformation des Eises beeinflusst.
Der Anteil dissoziirter Stoffe im Eis konnte nur qualitativ und indirekt durch den Vergleich der Ramananalyise mit den Ergebnissen einer chemischer Analyse von Schmelzwasser geschätzt werden. Die Ramanspektroskopischen Messungen deu- ten allerdings klar darauf hin, dass mikroskopische Einschlüsse sekundärer Pha- sen im Eis einen erheblich höheren Anteil bilden, als im flüssigen Wasser. Das Mi- schen von Spurenstoffen und chemische Reaktionen zwischen ihnen werden durch die Eisdeformation begünstigt. Unser Bild von “Eis als gefrorenes Archiv” könn- te durch “Eis als effektiver Reaktor” ersetzt werden, je nachdem welche zeitlichen und räumlichen Spannen gemeint sind. Die darausfolgende Auswirkung auf die chrono-stratigraphische Integrität von Eiskerndaten ist insgesamt jedoch positiv, da die Reaktionsprodukte oft niedrigere Diffusionsraten besitzen. Ein universeller Me- chanismus für die Auswirkung von Spurenstoffen auf die Eisdeformation konnte nicht vollständig aufgedekt werden. Vielmehr scheint Deformationslokalisierung als Folge der mechanischen Anisotropie eine intrinsische Eigenschaft von Eis zu sein, die durch die Variation in Spurenstoffkonzentrationen getriggert wird. Viele Fragen hinsichtlich der Form und Wirkung von Spurenstoffen im Eis stehen allerdings noch offen für zukünftige Forschungsprojekte.
vii
EBERHARD KARLS UNIVERSITÄT TÜBINGEN Mathematisch-Naturwissenschaftliche Fakultät
Geowissenschaften
Chemical Impurities and Physical Properties of Polar Ice Doctoral Thesis
by Jan EICHLER
Abstract
The Greenland Ice Sheet and the Antarctic Ice Sheet are the largest reservoirs of freshwater on our planet. They consist of ice which formed over thousands of years out of the precipitation and due to natural densification of snow. As such, polar ice represents a unique archive of the past climate. The large ice masses flow under their own weight causing a transport of ice from the inlands towards the oceans. Nu- merical flow models are used to simulate the ice dynamics, i. a., in order to project future contributions of the ice sheets to the rising sea level. The viscoplastic defor- mation of ice on the micro-scale involves similar mechanisms as the deformation of other poly-crystalline materials. The shear of individual crystals is accompanied by recrystallization and the development of characteristic microstructures. Thus, structural-geological concepts and methods can be applied to natural ice samples in order to study their deformation state and active physical processes.
Chemical impurities are deposited in snow and ice during the precipitation and reflect the aerosol composition of the atmosphere. As such they play an important role for the reconstructions of the climate of the past. Despite their extremely low concentrations, impurities influence many physical properties of ice, in particular also the deformation rate. The concentrations of the different impurities vary with depth and these variations are correlated with heterogeneities in the flow-velocity profile. This results in the development of localized shear zones in ice. A better understanding of the mechanisms is necessary in order to implement the effect of impurities into the flow models.
The presented thesis addresses the relationship between the chemical impurities and the physical properties of polar ice. A central challenge of the project is to un- derstand in which form impurities integrate in ice and where they are located in the bulk, respectively how they interact with it during deformation and recrystal- lization. A combination of methods for the microstructural analysis was applied to natural ice material from ice cores. The distribution and composition of impurities was analyzed using a confocal cryo-Raman microscope. Within the scope of this thesis, new routines for the acquisition and data processing were developed.
The results reveal a complex interplay between impurities, crystal structure and localized deformation in ice. On the one hand, high impurity concentrations cause higher strain rates occurring together with small grain sizes. On the other hand, the deforming ice matrix affects the distribution of impurities and possibly also their chemical composition. The portion of dissociated components in ice could be esti- mated only qualitatively and through the comparison to the chemical analysis of the meltwater. However, the Raman-spectroscopy data clearly suggest that microscopic inclusions of second phase are present in solid ice in significantly higher concen- trations, compared to liquid water. Mixing and chemical reactions of impurities is
promoted through the deforming ice matrix. Our image of “ice as a frozen archive”
could be replaced by “ice as an effective reactor”, depending on the spatial scales and time spans referred to. The resulting implication for the chrono-stratigraphic integrity of ice-core records may still be positive, because the reaction products of- ten posses lower diffusion rates. A universal mechanism for the impurity effect on ice deformation could not be identified. The localized deformation seems to be in fact an intrinsic property of ice produced by the mechanical anisotropy and trig- gered by the varying impurity concentrations. However, many questions regarding the form and effect of impurities in ice remain open for future investigations.
ix
Contents
Zusammenfassung v
Abstract vii
Contents ix
Contribution to scientific publications xiii
1 Introduction 1
1.1 Why study ice? . . . 1
1.1.1 Ice – A Material Full of Curiosities . . . 1
1.1.2 Ice Sheets I: Archives of the Past Atmosphere. . . 3
1.1.3 Ice Sheets II: Their Role in (a Changing) Climate . . . 4
1.2 Deformation Macro Scale (Fluid) . . . 5
1.2.1 Ice Creep . . . 6
1.2.2 Glen’s Flow Law . . . 6
1.3 Deformation Micro Scale (Solid). . . 7
1.3.1 Single Crystal . . . 7
1.3.2 Polycrystal. . . 8
1.3.3 Dynamic Recrystallization. . . 8
1.3.4 Crystal-Preferred Orientations (CPO) . . . 9
1.3.5 Strain Localization . . . 10
1.4 Impurities . . . 10
2 Motivation and Objectives 13 2.1 Why is ice-age ice sometimes soft? . . . 13
2.2 The Chicken or the Egg Problem . . . 14
2.3 How Do Impurities Integrate and Distribute in Ice? . . . 15
3 Methods 17 3.1 Ice Cores . . . 17
3.1.1 EDML . . . 17
3.1.2 NEEM . . . 18
3.2 Measuring Ice Microstructure . . . 18
3.2.1 Optical Microscopy. . . 18
3.2.2 Fabric Analyser . . . 20
3.2.3 LASM . . . 20
3.3 Raman Spectroscopy . . . 21
4 Synthesis 25 4.1 Main Outcome. . . 25
4.2 Results Sorted by Papers . . . 26
4.3 Concluding Remarks . . . 28
4.4 Future Perspectives . . . 28
5 Paper I 31
5.1 Introduction . . . 32
5.2 Methods and sample material . . . 34
5.2.1 Impurity maps . . . 36
5.2.2 Raman spectroscopy . . . 36
5.3 Results . . . 36
5.3.1 Raman spectroscopy . . . 38
5.3.2 Concentration . . . 38
5.3.3 Distribution . . . 38
General spatial distribution . . . 38
Distribution with respect to microstructure . . . 39
5.4 Discussion . . . 40
5.4.1 Impurities in the form of µ-inclusions . . . 40
5.4.2 Zener pinning . . . 42
5.4.3 Grain size controlling mechanisms . . . 47
5.5 Summary . . . 49
6 Paper II 51 6.1 Introduction . . . 52
6.2 Material and methods . . . 54
6.2.1 Sample material. . . 54
6.2.2 Sample preparation. . . 55
6.2.3 Micro-inclusions . . . 55
6.2.4 Cryo-Raman. . . 56
6.2.5 DEP, CFA and IC . . . 57
6.3 Results . . . 58
6.3.1 IC, CFA and DEP . . . 58
6.3.2 Raman results . . . 60
6.3.3 Impurity distribution. . . 62
6.4 Discussion . . . 62
6.4.1 Raman analysis . . . 62
6.4.2 Ion balance . . . 64
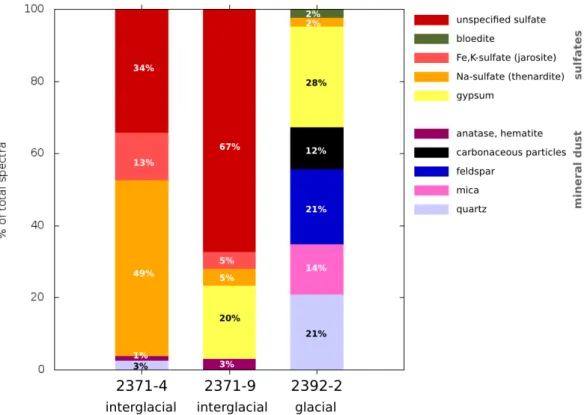
6.4.3 Sulfate . . . 66
6.4.4 Nitrate . . . 67
6.4.5 Chloride . . . 67
6.4.6 Solid solution . . . 68
6.4.7 Transport, mixing and reactions . . . 68
6.4.8 Deformation of ice . . . 70
6.5 Summary . . . 71
6.6 Supplementary material . . . 73
7 Paper III 75 7.1 Introduction . . . 76
7.2 Methods . . . 78
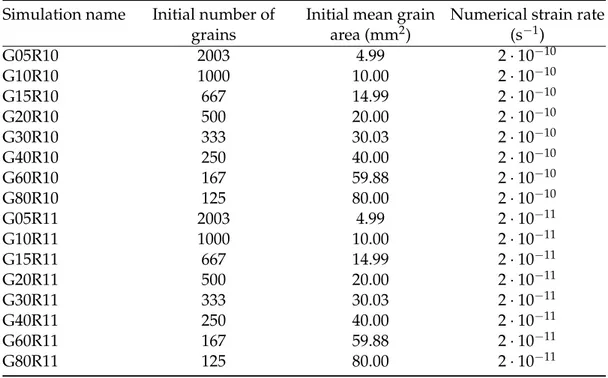
7.2.1 Microstructural Modeling . . . 78
7.2.2 Microstructure characterisation of NEEM ice core samples . . . 83
7.3 Results . . . 85
7.3.1 Numerical simulation results . . . 85
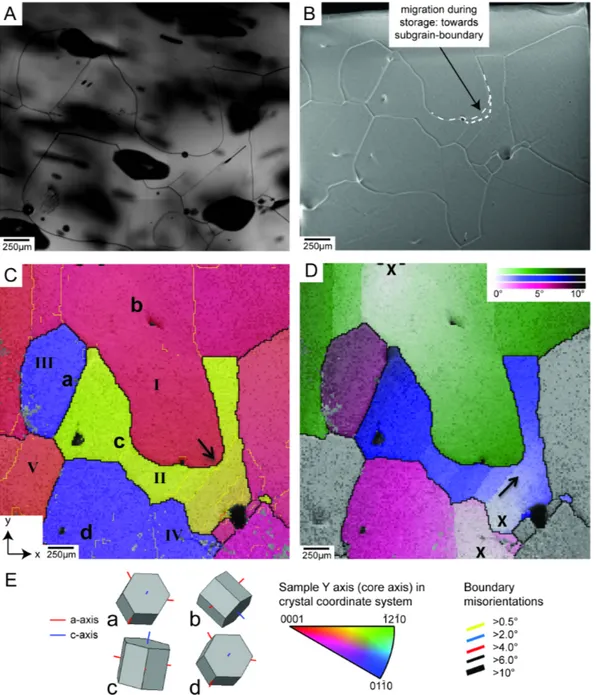
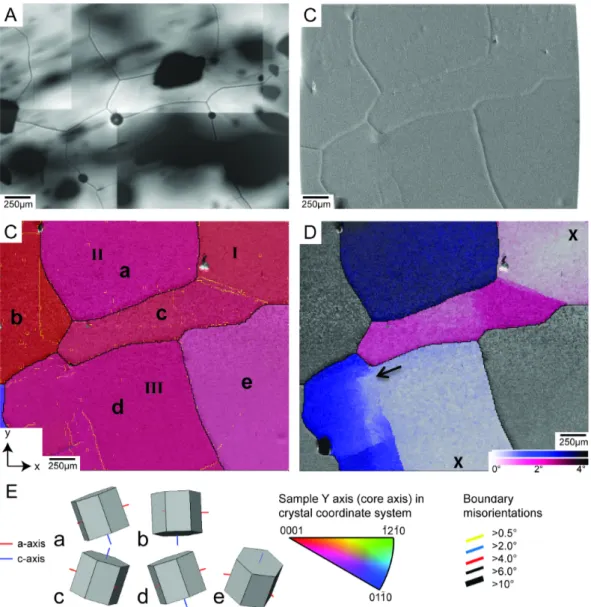
7.3.2 EBSD and Fabric Analyser results from NEEM ice core . . . 90
7.4 Discussion . . . 93
xi 7.4.1 Time-resolved numerical microstructure evolution under the
influence of grain dissection. . . 93
7.4.2 Grain dissection along NEEM ice core . . . 94
7.4.3 Characteristics of grain dissection in simulation and nature . . 96
7.5 Conclusions . . . 98
8 Paper IV 101 8.1 Introduction . . . 102
8.1.1 Introduction—EDML ice core . . . 103
8.2 Methods . . . 105
8.2.1 Fabric analysis . . . 105
8.2.2 Grain size and shape characteristics by light-microscopy mi- crostructure mapping in plain and polarized light . . . 105
8.2.3 Visual stratigraphy line scanning . . . 108
8.2.4 Borehole logging . . . 108
8.2.5 Strain rate estimations from the ice flow model . . . 108
8.3 Results and data . . . 112
8.3.1 Lattice-preferred orientation . . . 112
8.3.2 Grain size . . . 113
8.3.3 Grain shapes . . . 113
8.3.4 Visual stratigraphy . . . 114
8.3.5 Borehole data . . . 115
8.3.6 Strain rate estimates from the model . . . 116
8.4 Discussion . . . 118
8.4.1 Region 1 (approx. uppermost 450 m). . . 119
8.4.2 Region 2 (approx. 450–1700 m depth) . . . 120
8.4.3 Region 3 (approx. 1700–2030 m depth). . . 121
8.4.4 Region 4 (approx. 2030–2385 m depth). . . 121
8.4.5 Region 5 (greater than approx. 2385 m depth) . . . 123
8.5 Conclusion . . . 124
9 Paper V 127 9.1 Introduction . . . 128
9.2 Study site. . . 129
9.3 Laboratory measurements and processing . . . 131
9.4 Results . . . 132
9.4.1 Physical properties profile . . . 132
9.4.2 Visual stratigraphy . . . 133
9.4.3 High-resolution physical properties . . . 135
9.5 Discussion . . . 137
9.5.1 Depth-evolution of crystal anisotropy . . . 137
9.5.2 Short-scale variability . . . 138
9.5.3 Do we need a new statistical approach? . . . 140
9.6 Conclusions . . . 141
9.7 Supplementary material . . . 142
A Programs and Scripts 147 A.1 Microstructure Mapping . . . 147
A.1.1 Running a Microscope Scan . . . 147
A.1.2 Image Stitching (Manual) . . . 147
A.2 Remote Control of the Raman System . . . 150
Bibliography 157
Acknowledgements 189
xiii
Contribution to scientific publications
Paper I
Jan Eichler, Ina Kleitz, Maddalena Bayer-Giraldi, Daniela Jansen, Sepp Kipfstuhl, Wataru Shigeyama, Christian Weikusat, and Ilka Weikusat (2017). “Location and distribution of micro-inclusions in the EDML and NEEM ice cores using optical mi- croscopy and in situ Raman spectroscopy.” In: The Cryosphere 11.3, pp. 1075–1090.
DOI: 10.5194/tc-11-1075-2017. URL: https://www.the-cryosphere.net/11/
1075/2017/tc-11-1075-2017.pdf
Scientific ideas Data generation Analysis and interpretation
Paper writing Full develop-
ment of the
scientific idea of mapping of micro-inclusions over large areas.
Initial idea of impurity imaging by SK and IW.
Measurements and generation of raw data partly with assistance of IK and WS.
All analysis and interpretation with contribution of all co-authors.
All paper writing.
Proof-reading and comments by all co-authors.
Paper II
Jan Eichler, Christian Weikusat, Anna Wegner, Birthe Twarloh, Melanie Behrens, Hubertus Fischer, Maria Hörhold, Daniela Jansen, Sepp Kipfstuhl, Urs Ruth, Frank Wilhelms, and Ilka Weikusat (2019). “Impurity Analysis and Microstructure Along the Climatic Transition From MIS 6 Into 5e in the EDML Ice Core Using Cryo-Raman Microscopy.” In:Frontiers in Earth Science7. DOI:10.3389/feart.2019.00020
Scientific ideas Data generation Analysis and interpretation
Paper writing Full development
of the scientific idea of acquiring Raman spectra of micro-inclusions using previously created impurity maps. Devel- opment of the half-automatic Raman measure- ments.
Generation of all Raman data with assistance of CW. Ion chro- matography data generated by BT.
Continuous flow analysis data by AW, MB, HB, MH and UR. Dielectric profiling by FW.
All analysis and interpretation with contribution of all co-authors.
All paper writing.
Proof-reading and comments by all co-authors.
Paper III
Florian Steinbach, Ernst-Jan N. Kuiper, Jan Eichler, Paul D. Bons, Martyn R. Drury, Albert Griera, Gill M. Pennock, and Ilka Weikusat (2017). “The Relevance of Grain Dissection for Grain Size Reduction in Polar Ice: Insights from Numerical Models and Ice Core Microstructure Analysis.” In: Frontiers in Earth Science5, p. 66. ISSN: 2296-6463.DOI:10.3389/feart.2017.00066. URL: https://www.frontiersin.org/
article/10.3389/feart.2017.00066
Scientific ideas Data generation Analysis and interpretation
Paper writing Discussion and
support for FS.
Ideas regarding 3D effects in Fabric Analyser images.
Processing of Fab- ric Analyser data, generation and se- lection of fabric images.
Analysis and interpretation of ice sample data together with FS and ENK.
Contribution to the paper writing providing text parts and figures related to the Fabric Analyser data.
xv
Paper IV
Ilka Weikusat, Daniela Jansen, Tobias Binder, Jan Eichler, Sérgio H. Faria, Frank Wil- helms, Sepp Kipfstuhl, Simon Sheldon, Heinrich Miller, Dorthe Dahl-Jensen, and Thomas Kleiner (2017b). “Physical analysis of an Antarctic ice core–towards an integration of micro- and macrodynamics of polar ice.” In: Philosophical Transac- tions of the Royal Society A: Mathematical, Physical and Engineering Sciences375.2086, p. 20150347.DOI:10.1098/rsta.2015.0347. URL: http://doi.org/10.1098/rsta.
2015.0347
Scientific ideas Data generation Analysis and interpretation
Paper writing Assistance with
development of the main idea by IW, by continued discussion of the EDML dataset.
Contribution
to the mea-
surements and processing of the crystal-preferred orientations.
Contribution in form of discus- sions with IW and DJ regarding grain size and crystal-preferred orientations.
Contribution to paper writing by commenting and proof-reading.
Paper V
Johanna Kerch, Olaf Eisen, Jan Eichler, Tobias Binder, Pascal Bohleber, Johannes Fre- itag, Paul Bons and Ilka Weikusat (2019). “Short-scale variations in high-resolution crystal-preferred orientation data in an alpine ice core – do we need a new statistical approach?”. Submitted toJournal of Geophysical Research.
Scientific ideas Data generation Analysis and interpretation
Paper writing Contribution to
the scientific idea discussing corre- lations between grain sizes and lattice orienta- tions.
Contribution to the generation and processing of microstructure data. Assistance and support in the laboratory and during data processing.
Support dur- ing analysis of microstructure data.
Contribution to paper writ- ing in form of proof-reading and comments.
1
Chapter 1
Introduction
This chapter introduces basic concepts and terminology. It is intended for a broader audience not necessarily familiar with the subject of glaciology. However, the scope of this thesis and the complexity of this particular field of research do not always allow for an instructive ap- proach. Interested readers are recommended to resort to the relevant textbooks on the physics of ice by Hobbs (1974), Petrenko and Whitworth (1999), and Cuffey and Paterson (2010).
1.1 Why study ice?
1.1.1 Ice – A Material Full of Curiosities
Ice – the frozen phase of water – is a fascinating medium for multiple reasons. The fact that ice floats on water likely offered a friendly environment for the evolution of life on Earth and its preservation in polar regions and during very cold climatic epochs (e. g., “Snowball Earth”, Hoffman,1998). For a few millions years, during the current ’icehouse‘ climate, ice sheets – large masses of permanent ice on the poles – have played an important role for the energy budget and climatic stability of our planet (Summerhayes,2015). For humans, ice represents a practical resource on the one hand (snow and ice as means of transportation, construction, cooling, winter sports, etc.), and an object of struggle on the other hand.
From the physicist’s point of view, ice is a material of extraordinary characteris- tics. Water distinguishes itself from other materials through a long list of anomalous properties – some authors count up to 74 anomalies (Chaplin: Water Structure and Science; Brovchenko and Oleinikova,2008). For the most part, the public is familiar with the density anomalies at the transition between liquid water and ice. During freezing at atmospheric pressure and 0◦C, the volume increases by approximately 9% after the water is completely frozen to ice. Hence, ice floats on water – and lakes and oceans freeze from the surface. Water density exhibits a maximum at about 4◦C, the density of ice around 70 K (≈ −203◦C). Also, the melting, boiling and critical point are unusually high compared to similar compounds (e. g., H2S). Water thus coexists in the solid, liquid and gaseous phase in nature. Ice is ductile and brittle at the same time even at its melting point and its surface is slippery and sticky at the same time even far below its melting point. Many of the unique characteristics of H2O can be explained through the nearly tetrahedral shape of the sp3-hybridized water molecule and its ability to form hydrogen bonds (Petrenko and Whitworth, 1999). Hydrogen bonds are also responsible for the spatial arrangement of water molecules in the ice crystal.
Hexagonal ice (denoted as ice Ih) is the only phase among the 18 (and more) poly- morphs of solid H2O discovered so far (Fuentes-Landete et al.,2015) which is stable under the thermodynamic conditions encountered on the Earth’s surface (Bartels- Rausch et al.,2012). An account of its structure has been proposed by Pauling,1935.
FIGURE1.1: The structure of ice Ih. Oxygens appear as red spheres, hydrogens in white. Left: View parallel to the basal plane with visible planes of densely packed molecules. Right: View perpendicular to the basal plane. The hexagonal ordering of the water molecules is visible. Plotted usingPyMOL.
The arrangement of water molecules in ice Ih follows two simple rules, the Bernal–
Fowler rules:
1. each oxygen is covalently bonded to two hydrogens so that the entity of the water molecule is preserved.
2. there is only one hydrogen atom participating in each bond between oxygens (the hydrogen bond).
The lattice structure of ice is identical with the hexagonal form of ZnS (Wurtzite, Pe- trenko and Whitworth,1999). The rather large dimensions of the hexagonal-prism- shaped unit cell (a ≈ 4.52 Å and c ≈ 7.26 Å, Hobbs, 1974) are responsible for the low density of hexagonal ice. Ice features planes with densely packed molecules, alternating with planes of wide spacing between the molecules (Figure1.1) These planes are oriented parallel to the basal crystallographic plane (0001) and normal to the main symmetry axis (the c-axis). This structure is the underlying cause for the highly anisotropic behavior of ice which is reflected in its mechanical, electri- cal, and optical properties (Petrenko and Whitworth, 1999). The basal plane and the c-axis are important measures indicating the direction of this anisotropy. The Bernal–Fowler ice rules do not fully determine the positions of the hydrogens (pro- tons) and a number of different arrangements are possible. Thus, hydrogens in ice do not posses a long-range translational symmetry and the ice Ihlattice is inherently proton-disordered (Petrenko and Whitworth,1999).
The ice-covered part of the Earth’s surface –the cryosphere– presently accounts for ca. 20 % of the total surface area of our planet (IPCC,2013, Table 4.1 therein). 68.7 % of the Earth’s fresh water is stored in frozen reservoirs, in particular ice sheets, ice caps, glaciers, sea ice, lake and river ice, and seasonal snow cover (Shiklomanov, 2000). The two present-day ice sheets – the Antarctic Ice Sheet with 25.71·106km3 and the Greenland Ice Sheet with 2.85·106km3 – represent by far the largest ice masses with a total sea level equivalent (SLE) of approximately 66 m (IPCC,2013).
Among the manifold scientific goals of ice-sheet research, two main goals can be
1.1. Why study ice? 3 distinguished: (I) the reconstruction of past climates and (II) the analysis of the in- fluence of ice sheets on the present climate and the clarification of its role to im- prove future projections. These differing goals have led to the establishment of two branches of research with different temporal foci. The following two sections com- ment on these two not completely independent perspectives of glaciology in more detail.
1.1.2 Ice Sheets I: Archives of the Past Atmosphere
Ice sheets, ice caps, and glaciers consist of meteoric ice, i. e., ice that originates from the precipitation of snow. Due to permanent accumulation of fresh snow, older lay- ers are compacted and buried deeper in the snow column. Originally separated snow grains sinter together, forming a solid porous ice–air aggregate, referred to as firn(Blackford,2007; Colbeck,1983; Fierz et al.,2009; Wilkinson and Ashby,1975).
Further firn compaction causes an increase of density with depth, until pores are gradually closed off and the air remains trapped in separate bubble-like inclusions (Schwander and Stauffer,1984; Stauffer et al.,1985). Pore close-off occurs at densities around 830 kg m−3and defines the transition zone between firn and ice. The burial depth of the firn–ice transition can vary significantly from site to site, depending on the accumulation rate, temperature, and the thinning rate (Cuffey and Paterson, 2010). However, recent studies have shown that the exact depth of the firn–ice also depends on more complex micro-structural processes occurring during firn densifi- cation (Freitag et al.,2013; Hörhold et al.,2012; Schaller et al.,2017).
In geological terms, glacial ice is a sedimentary mono–mineralic rock of very high purity. Depending on the amount of site-specific precipitation, the annual layer thickness can vary from millimeters to up to a meter or more (Cuffey and Paterson, 2010) and it decreases with depth due to progressive thinning by compression and ice-flow divergence. Since all the components – i. e. the ice itself as well as its gas content and other impurities – originate from precipitation, ice sheets represent the most direct archives of the past atmosphere. Analysis of the air trapped inside the ice can directly reveal the history of atmospheric composition, e. g., the concentration of greenhouse gases (CO2, CH4, N2O) over time, etc. (Etheridge et al.,1996; Loulergue et al.,2008; Wolff,2011). Other palaeo-climatic parameters can be measured in the form of so-calledclimate proxies(Grinsted et al.,2010; Mayewski et al.,2009; Ruth et al.,2008; Schüpbach et al.,2013), i. e., quantities which are linked to certain climatic or atmospheric conditions through more or less complex processes. Probably the most prominent climate proxies obtained from snow and ice are the compositions of stable water isotopes, in particular the18O/16O and D/H ratios (Galewsky et al., 2016). Dansgaard (1953, 1964) discovered that their variations (expressed as δ18O andδD) are closely linked to atmospheric temperature. Since the first long record was measured on the Camp Century ice core (Dansgaard et al.,1969), stable water isotopes have been established as the basis for global and local temperature recon- structions (Galewsky et al., 2016; Johnsen et al., 2001; Lorius et al., 1979; Vinther et al.,2009). However, the detailed mechanisms of isotopic signal formation (e. g., fractionation during water-vapor transport, precipitation and snow metamorphism) still remain partly unknown and are the object of ongoing investigations (e. g., Ebner et al.,2017; Freitag et al.,2013; Galewsky et al.,2016).
The chronology of climatic signals in ice depends on a number of site-specific factors, in particular total ice thickness, annual layer thickness, thinning rate and flow behavior. Ice in the central regions of Antarctica can reach a thickness of more than 3 km and contain ice which was formed several hundreds of millennia ago. The
deepest part of the EPICA Dome C ice core – the oldest continuous ice-core record so far – provided a stable-water-isotopic signal dated 800 000 years back in the past (EPICA community members,2004). A new European ice-core project in Antarctica, called “Beyond EPICA – Oldest Ice”, is currently taking off with the goal to retrieve a continuous record of the past 1.5 million years (Fischer et al.,2013; Karlsson et al., 2018; Liefferinge et al.,2018; Parrenin et al.,2017; Young et al.,2017).
In palaeo-glaciology, the dating of an ice core – i. e., assigning a time scale to the depth – is a key task for chronological reconstructions of climate records (Blunier and Brook,2001; Rasmussen et al.,2013; Ruth et al.,2007). However, this task becomes more difficult with increasing depth (ergo with the age of the ice). In shallow depths, a number of complementary dating methods can be combined, such as the counting of individual annual layers (Svensson et al.,2011), the matching of absolute markers ,e. g., referenced volcanic events (Gow and Meese,2007; Moore et al.,1991; Sigl et al., 2015), or isotopic methods (). In contrast, the dating of deep ice is restricted to only a few absolute markers. The application of thinning models represents the main tool for dating deep ice (Huybrechts et al.,2007; Parrenin et al.,2007; Rasmussen et al., 2013; Veres et al.,2013). Furthermore, ice close to the bedrock is in general subject to increased shearing and deformation which can disturb the original stratigraphy on multiple scales (strain localization, folding and other types disruptions Faria et al., 2010; Hudleston,2015; NEEM community members,2013). Thus, a more profound understanding of the ice flow is necessary in order to reliably assess the impact of deformation on the chronology of deep ice and, eventually, design methods for the reconstruction of climate signals even from depths where the stratigraphy has been clearly disrupted.
1.1.3 Ice Sheets II: Their Role in (a Changing) Climate
Ice sheets are in continuous movement driven by their own weight, similar to the flow of a highly viscous fluid under the influence of gravitation (Petrenko and Whit- worth,1999). Ice flows from sites with high altitudes down the slope towards low altitudes (Fig. 1.2). This ice flow causes a mass transport from the central parts of Antarctica and Greenland towards the coastal areas. There, the ice forms out- flow glaciers and, eventually, reaches the oceans and transforms into floating ice (ice shelves, icebergs). This process is fed by snow accumulation on the surface in high latitude and altitude regions (accumulation zones) and the progressive trans- formation of snow into new ice. Hence, the flow of ice is a self-containing part of the Earth’s water cycle. Under stable boundary conditions, the accumulation of new snow and the ice loss due to melting and glacier discharge are at equilibrium – zero ice mass balance. However, this is not the case anymore under changing climatic conditions such as a rising global temperature.
During the last decades, the Antarctic Ice Sheet and the Greenland Ice Sheet have been losing mass due to global warming and have contributed to the global sea level rise. The global sea level has been rising at an averaged rate of 3.1 mm yr−1SLE be- tween 1993 and 2018 and has been accelerating about 0.1 mm yr−2over this period (WCRP Global Sea Level Budget Group,2018). The estimated present contributions to global sea level rise are: 42% ocean thermal expansion, 21% glaciers, 15% Green- land Ice Sheet and 8% Antarctic Ice Sheet. The average ice loss in Greenland over the period 1993–2016 contributed with≈ 0.47 mm yr−1 SLE and was accelerating towards ≈ 0.75 mm yr−1 SLE for the period 2005–2016 (WCRP Global Sea Level Budget Group,2018). The accelerating trend has been observed also in Antarctica
1.2. Deformation Macro Scale (Fluid) 5
FIGURE1.2: Cross section of an ice sheet, modified after Oerter (2009). Snow accumulates on the surface of the ice sheet (accumulation zone) and transforms to ice due to compaction and densification. Annual layers are progressively thinned on they way down through the ice column. The flowlines indicate the movement of individual ice particles from the inland towards the ablation zone and the ocean.
where ice loss in recent years reached about≈0.55 mm yr−1SLE. However, in com- parison to Greenland, the current Antarctic contribution to the sea level rise is min- imal considering the huge amounts of ice stored in Antarctica. Nevertheless, future response of the Antarctic Ice Sheet to further climatic pressure is uncertain. Accord- ing to the Fifth Assessment Report (AR5) of the Intergovernmental Panel on Climate Change (IPCC,2013), future contributions of ice sheets represent major uncertainties in projections of global sea level rise. While during the 20th century most meltwater discharge into the oceans was provided by retreating glaciers, future development of the sea level will most likely be determined by the response of ice sheets to changing climate conditions.
Predictions of future ice discharge into the ocean are based on numerical ice sheet models which simulate the development of ice sheets on multiple scales and under different scenarios. Ice sheet models have evolved rapidly over last years parallel to the increase in computational power (Greve and Blatter,2009). Recent approaches allow to integrate many relevant physical processes (ice flow, ice-bedrock interac- tion, surface melting, subglacial hydrology, ice-ocean interaction, etc.). However, the physics of ice flow that have been implemented in these models were estab- lished six decades ago (Glen’s flow law,1.2.2). This flow law does not always suit recent field and laboratory observations, as explained in more detail further below.
In order to improve the flow law and thus the projections of the sea level, a better understanding of mechanisms governing the ice flow is necessary.
1.2 Deformation Macro Scale (Fluid)
While the fast movement of glaciers is to a large extent realized through the gliding of whole ice masses over bedrock, most of the flow in the interior of ice sheets is a product of visco-plastic deformation –ice creep(Budd and Jacka, 1989). On large
spatial scales and over long time spans, the behavior of ice is similar to the flow of a highly viscous fluid.
1.2.1 Ice Creep
Creep occurs in most solids under the application of mechanical stress over long time spans. Creep rates generally depend on temperature, exposure time, load, and material properties (Frost and Ashby,1982; Haasen,1994; Karato,2008). The activa- tion energy for ice creep ranges between 60 and 80 kJ mol−1(Mellor and Testa,1969;
Schulson and Duval,2009). Ice deforms relatively easily compared to other miner- als (Hobbs,1974). A substantial number of laboratory creep experiments have been carried out with the aim to describe the deformation of ice under controlled tem- peratures and stress–strain configurations (Azuma, 1995; Dahl-Jensen et al., 1997;
Journaux et al.,2018; Qi et al.,2018; Weertman,1973,1983; Wilson and Zhang,1994).
Deformation tests on artificial polycrystalline ice under constant stresses were initi- ated by Glen in the 1950s (e. g., Glen,1952, 1955). The strain (or strain rate) under constant load was recorded as a function of time. The creep curvesobtained from theses measurements show that the process is characterized by three stages (Budd and Jacka,1989; Steinemann, 1954; Treverrow et al., 2012). After an initial elastic response, the specimens undergo irreversible plastic deformation (primary creep).
The strain rate decreases with time as short-range internal stresses build up due to incompatibilities in shapes and orientations of the deforming adjacent grains (Sec- tion1.3.2). After a certain deformation time depending on stress and temperature a minimum strain rate is reached, called thesecondarycreep. Experiments by Jacka (1984) show that independent of load and temperature the minimum strain rate oc- curs after reaching a total octahedral shear strain of about 0.6 %. Many deforma- tion experiments terminate after reaching the secondary stage of creep, mainly due to time limitations. Perhaps this is the reason why secondary creep is sometimes (incorrectly) referred to as a steady state. However, after some time with progress- ing deformation, the strain rate starts to increase again and eventually reaches an accelerated (true) steady state. Thistertiary creep stage (Treverrow et al., 2012) is associated with the onset of dynamic recrystallization (Sect. 1.3.3) and the release of accumulated internal stresses. While in ice sheets the creep has enough time to reach its tertiary state, it can hardly be achieved in laboratory tests under realistic stress–temperature–time constraints.
1.2.2 Glen’s Flow Law
In order to derive the ‘viscosity’ of ice, Glen (1952, 1955) performed creep experi- ments with different stress magnitudes and recorded strain rates for the secondary creep phase. The results show that the relationship between stress and strain rate is highly non-linear and can be described sufficiently well with an exponential func- tion. This power law has been established as Glen’s Flow Law:
˙
ϵ= Aτn (1.1)
with the strain rate ϵ˙ and the dominant stress τ. The creep factor A and thestress exponent n are fitting parameters to be determined. A can vary across several or- ders of magnitude (Cuffey and Paterson, 2010, p. 64) depending on other factors and boundary conditions. It can be split into a temperature-independent prefactor
1.3. Deformation Micro Scale (Solid) 7 A0and a temperature-dependent term of the Arrhenius type:
A= A0e(−Q/RT) (1.2)
with the Kelvin temperatureT, the universal gas constant Rand the activation en- ergy for creepQ ≈ 60 kJ mol−1(Paterson,1977). The stress exponentn is assumed to be an ice-specific material constant. The values forn, derived from creep experi- ments, field data and theoretical considerations range from 1.4 to 4.2 (Gillet-Chaulet et al., 2011; Glen, 1952, 1955; Goldsby et al., 2001; Hooke, 1981) with an average aroundn≈3. Although this value has been widely established and implemented in numerical ice-flow models, the universality ofn = 3 for ice sheets is challenged by an increasing number of studies which propose other stress exponents suitable for different stress configurations, e. g.,n<2 at low stresses by Goldsby et al. (2001) or n=4 for the Greenland Ice Sheet by Bons et al. (2018).
1.3 Deformation Micro Scale (Solid)
The description of ice as a highly viscous fluid serves as a first approximation and is relatively useful for an implementation in numerical flow models (Greve and Blatter, 2009; Huybrechts,2007; Pattyn et al.,2008). However, it is only sufficient on a certain level of abstraction. A number of solid-specific characteristics of ice cannot be easily described by the fluid model. This is illustrated e. g. by the need to include mechan- ical anisotropy into the flow models (Durand et al.,2007; Martin et al.,2009; Pettit et al., 2007) or the composite flow law suggested by Goldsby et al. (2001). Other solid-specific features not represented in the model are shear localization, folding, the effect of impurities, and grain size. In order to incorporate these features into large-scale ice models, a more detailed understanding of the mechanisms on the mi- crometer and sub-micrometer scale is necessary.
1.3.1 Single Crystal
As it is the case for metals or other crystalline materials, plastic deformation of ice is realized on the molecular level through the creation of linear lattice discontinuities – dislocations– and their propagation through the crystal (Hirth and Tullis,1992; Read, 1953; Weertman and Weertman,1992). This so-calleddislocation creep(Pimienta and Duval, 1987; Shoji and Higashi, 1978) is more effective and energy-efficient than the shifting of whole crystallographic planes against each other, since only a small number of molecular bonds need to be disconnected at once (namely the ones along the dislocation line).
The plasticity of the ice crystal is highly anisotropic. Dislocations in ice glide much easier through the basal plane than through other crystallographic planes (Du- val et al.,1983; Nakaya,1958). As a result, the stress needed to achieve a given strain rate is up to 80 times lower for the shear along the basal plane than for other crys- tallographic planes (Duval et al.,1983). The slip along the basal plane is therefore calledeasy slip. This anisotropic behavior is comparable to a deck of cards which will easily slide over each other, but hardly deform under compression perpendicular to the slip plane.
1.3.2 Polycrystal
Large ice bodies such as polar ice sheets form polycrystals, i. e., aggregates of many single crystals (grains) with different lattice orientations, shapes, and volumes. Typi- cal grain diameters range from few millimeters to several centimeters. The interfaces between grains are calledgrain boundariesand are characterized by a discontinuity in lattice orientation. Grain boundaries represent planar lattice defects with higher energy and finite interface tension.
The creep of polycrystalline ice involves the deformation of many adjacent grains with different orientations. Grains which are oriented favorably to the shear direc- tion will activate easy slip first (Section1.3.1). However, their basal slip systems are generally not compatible with the orientations of their neighbors which will block further shearing by easy slip. This results in the development of complex internal stress fields (Ashby and Duval,1985; Castelnau et al.,2008; Duval et al.,1983,2010) which govern further deformation on the sub-grain scale. The amount of strain en- ergy stored in the lattice grows with the density of dislocations in the crystal. In creep experiments, this stage is called secondary creep and it is characterized by a minimum in the strain rate (Section 1.2.1). While the main part of the strain is still realized trough the basal slip system, the deformation rate is determined by mechanisms which are able to accommodate intergranular stresses at grain bound- aries. Depending on the applied stresses, several accommodating mechanisms have been proposed, such as diffusional flow, grain boundary sliding, dislocation climb (Goldsby et al., 2001) or the activation of dynamic recrystallization (Schulson and Duval,2009).
1.3.3 Dynamic Recrystallization
When the internal strain energy stored in dislocations reaches a critical level, it can be released by the activation of recrystallization. Recrystallization refers to processes in which the structure of the polycrystal changes over time. This is mainly realized through migration of grain boundaries or through creation of new grains and grain boundaries (Drury and Urai,1990). Such mechanisms, which are driven by the re- duction of internal strain energy are collectively called dynamic recrystallization.
Rotation recrystallization (RRX) refers to a process in which dislocations of the same type arrange themselves in planar configurations which serve as seeds for the creation of new low-angle grain boundaries. These arrangements of dislocations produce a localized lattice distortion called subgrain boundary with a misorienta- tion angle of a few degrees. The parent grain is divided into areas with slightly different orientations – subgrains. This first step of RRX is also referred to asrecovery orpolygonization(Alley et al.,1995; De La Chapelle et al.,1998; Passchier and Trouw, 2005; Urai et al.,1986; White,1977). Its energetic benefit arises from the lower energy of the generated subgrain boundary compared to randomly dispersed dislocations.
In continuation, subgrains can progressively rotate and increase the misorientation angles between them so that a regular high-angle grain boundary is formed (Drury and Pennock,2007). Since RRX involves the splitting of grains, its footprint in the polycrystalline structure is the reduction of the average grain size and the establish- ment of straight grain boundaries.
Strain-induced grain boundary migration(SIBM) is another recrystallization mech- anism which contributes to the reduction of dislocation density by migrating grain boundaries Passchier and Trouw,2005. The driving force for SIBM is a difference in dislocation density between two adjacent grains across the grain boundary
1.3. Deformation Micro Scale (Solid) 9 (Humphreys and Hatherly, 2004). The grain boundary is attracted by the region with a higher density of lattice defects (Means,1981). After the passage of the grain boundary, the crystal is virtually free of dislocations. The evidences for SIBM being active are highly curved grain boundaries and irregular grain shapes (Jessell,1986;
Passchier and Trouw,2005).
1.3.4 Crystal-Preferred Orientations (CPO)
Grains in polycrystalline ice under deformation develop a crystal-preferred orienta- tion (CPO)1. This is produced by the rotation of deforming crystals as a consequence of deformation mainly through easy dislocation slip. Inuniaxial compression(pure shear) the c-axis (normal to the basal plane) rotates towards the axis of maximum compression (Alley, 1988; Azuma and Higashi, 1985; Faria et al., 2014c; Gow and Williamson,1976). As a result, initially randomly oriented grains develop a nearly unimodal preferred orientation of their c-axes which all align in the same direction parallel to the shortening direction (single maximum orientation distribution). A similar effect is produced by simple shear, i. e., the translation of parallel planes rela- tive to each other. With increasing shear strain, the direction of maximum shortening progressively rotates from an initial angle of 45◦ towards an almost perpendicular orientation to the shear plane (e. g., Alley,1988; Gow and Williamson, 1976; Jun et al.,2000; Llorens et al.,2016b; Montagnat et al.,2012,2014; Treverrow et al.,2012).
Hence, the c-axes also develop a single maximum CPO in simple shear. In the in- verse case ofuniaxial extension, the c-axes rotate away from the axis of maximum elongation and distribute in a plane normal to it, forming a girdle-type orientation distribution.
The development of CPO has been observed in natural samples from ice cores (Durand et al.,2009; Eichler,2013; Faria et al.,2014a; Lipenkov et al.,1989; Weikusat et al., 2017b) as well as in laboratory-deformed ice (Jacka and Maccagnan, 1984;
Treverrow et al.,2012). The mechanisms of its formation have been extensively stud- ied with the help of computer simulations (Llorens et al.,2016a,b). The gross evolu- tion of CPO with depth in ice cores is consistent with our general understanding of the strain configuration at the usual drilling sites.2 In shallow depths, the predomi- nant deformation mode is pure shear due to the thinning under the load of new ice layers. The CPO, starting with nearly random (uniform) distribution at the surface, develops with increasing depth towards a single maximum in the vertical direction (e. g., the North Greenland Eemian Ice Drilling (NEEM) ice core: Montagnat et al., 2014). At sites located on an ice divide, an additional component of extensional strain contributes to the CPO, causing the development of a girdle fabric or a mix of girdle and single maximum (e. g., the EPICA3Dronning Maud Land (EDML) ice core: see Chapter8). With increasing depth and decreasing distance to the bedrock, the horizontal shear strain component becomes more dominant and typically drives the development of a strong vertical single maximum CPO in the deeper parts of ice cores.
1also referred to as lattice-preferred orientation (LPO), fabric, or texture in relevant literature.
2Most deep ice cores are drilled at ice domes or ice divides, i. e., at sites with simple strain configu- rations and low flow velocities. The East Greenland Ice-Core Project (EGRIP) is an exception.
3European Project for Ice Coring in Antarctica
1.3.5 Strain Localization
CPO is associated with mechanical anisotropy on the macroscopic scale (Budd and Jacka,1989; Gao and Jacka,1987). Its variations with depth can result in differences in the stress–strain relationship of the deforming ice. For instance, a vertical single maximum produced by vertical compression (pure shear) rotates most of the grains with their slip systems in an unfavorable arrangement for further compression. Pure shear thus causes ahardeningof the material. In contrast, a vertical single maximum produced by horizontal shear offers a favorable arrangement of the c-axes for further shearing. Thus, simple shear causes the development ofsoftlayers for further shear- ing in the ice column. Variations in mechanical anisotropy can lead to a localization of strain.
Inhomogeneous strain distributions in ice have been observed on multiple scales in the field (Talalay and Hooke,2007) as well as in laboratory experiments (Golding et al.,2012). Localized shear bands are often correlate with characteristic changes in the CPO, grain size and/or impurity content (see Sections2.1 and 2.2). However, recent numerical modeling studies of the deformation of polycrystalline ice suggest that strain localization is an intrinsic property of ice (Lebensohn et al.,2009; Llorens et al.,2016a,b; Riese et al.,2019, in review; Steinbach et al.,2016).
1.4 Impurities
In the scope of this thesis, the term ice impurities refers to chemical compounds or other extrinsic materials which originate from the atmosphere and were deposited at the ice-sheet (glacier) surface during or after the accumulation of new snow lay- ers. Material which originates from the interaction with the glacier bedrock is not included in this consideration. Also air bubbles and other gas inclusions are usually treated separately and are not considered impurities in the narrower sense. A very useful review on glaciochemistry was written by Legrand and Mayewski (1997a).
Glacial polar ice is one of the purest materials on the Earth’s surface. Mass con- centrations of impurities in the Antarctic Ice Sheet vary between 10−9during warm periods and 10−6in the most dusty layers during glacial periods (Faria et al., 2010;
Legrand and Mayewski,1997a). Impurity concentrations in the Greenland Ice Sheet are roughly ten times higher due to its lower distance from continental sources.
Ice impurities resemble the composition of aerosols in air masses above the pre- cipitation site. Concentrations of individual impurity components show local and seasonal variations depending on the distance from their sources, transport paths, and types of deposition (Legrand and Mayewski, 1997a). Relevant literature dis- tinguishes betweenwetanddrydeposition, depending on whether precipitation is involved or not. During wet deposition, hygroscopic aerosols serve as condensation nuclei which, after having accumulated a sufficient amount of water molecules, fall down in the form of ice crystals, snow flakes, or rain drops (“rain out”). On their way down through the air column, occasional collisions with other aerosols result in a further “wash out” of aerosols from the atmosphere. Dry deposition refers to a direct trapping of aerosols out of the moving air due to their collision with the snow surface. The following overview lists major aerosol components found as impurities in polar snow and ice:
• Mineral dust in the atmosphere originates mainly from desert regions where large areas of eroded earth-crust material are exposed to blowing winds. Collisions between initially horizontally moving dust particles result
1.4. Impurities 11 in vertical impulse causing further dispersion of the particles by wind. The size of mineral-dust particles deposited in the ice is typically in the range between hundreds of nanometers and a few micrometers (Wegner et al.,2015).
The residence time of larger particles in the atmosphere is too short due to their heavy weight. They are typically deposited closer to their sources before they can reach the polar regions. The Chemical composition of mineral dust reflects the composition of the Earth’s crust with Si, Al and Fe being the most abundant elements. Mineral dust also contains a substantial portion of Ca, mainly in the form of Ca-carbonate and Ca-plagioclase.
• Marine aerosols are salt particles created through dispersion of seawater droplets into the air, followed by evaporation of the water content. The ionic composition resembles the ionic ratios in seawater with major ions being Cl−, SO24−, Na+, Mg2+, Ca2+ and K+. NaCl is by far the most abundant salt in marine aerosol(Warneck,1988).
• Sulfate is the most common sulfur-containing aerosol. Chemical analy- ses of ice cores distinguish between sulfate originating from seasalt (ss SO24−) and non-seasalt sulfate (nss SO24−). The main nss sources are (a) the oxidation of natural or anthropogenic SO2 in the higher troposphere (major contribu- tion) and (b) marine biogenic sulfate as a product of the oxidation of dimethyl sulfide (DMS, mainly in Antarctica, Kaufmann et al., 2010). Strong temporal peaks in sulfate concentration are caused by volcanic eruptions. They serve as absolute chronological markers for ice core dating (section1.1.2).
• Nitrate is another major acidic impurity. NO−3 is formed in the troposphere by the oxidation of nitrogen oxides (NOX). The many possible sources of (NOX) include soil exhalation, biomass burning, lightning, cosmic radiation, oxidation of N2O, and dissociation of N2(Legrand and Mayewski,1997a). Al- though many ice-core records of nitrate exist, the interpretation of concentra- tion variations remains challenging (Röthlisberger et al., 2000b; Wolff, 1995) and is further complicated by the high diffusion rates of NO−3, reported by Thibert and Dominé (1998).
• Ammonium is another nitrogen-containing aerosol component. It is pro- duced and emitted to the atmosphere during bio-activity. In Greenland Ice Sheet, the ammonium concentration varies with the season and peaks in sum- mer (Legrand and Mayewski,1997a). NH3reacts with acidic aerosols (mainly H2SO4and HNO3), forming ammonium salts(NH4)2SO4and NH4NO3.
• Black carbon or soot is a product of an incomplete combustion of organic matter. During the 19th and 20th century, burning of fossil fuels caused an increase of black-carbon concentrations in the atmosphere (Wang et al.,2015).
Higher concentrations of black carbon on snow and ice surfaces increase the absorption of solar energy (decrease albedo) and possibly contributed to the warming trend in the 20th century (McConnell et al.,2007).
Ice impurities play a central role in this thesis. Beside their key relevance as cli- matic proxies, their varying concentrations seem to affect the mechanical properties of ice. Consequently, they trigger inhomogeneities in the flow of ice sheets.
13
Chapter 2
Motivation and Objectives
The principal motivation for this thesis is elucidated in the first two sections of this chapter.
Concrete objectives are defined in the last section (2.3).
2.1 Why is ice-age ice sometimes soft?
The title of a paper by Paterson (1991): “Why is ice-age ice sometimes soft?” ex- presses the observation reported already in prevous studies (e. g., Fisher and Ko- erner,1986), that ice formed during glacial periods often deforms more readily than interglacial ice. Paterson (1991) reviewed the available data of borehole deforma- tion rates at several drilling sites as well as laboratory creep experiments on natural ice samples. He concluded that “ice-age ice” deforms on average 2.5 times faster in simple shear compared to interglacial ice under the same stress and temperature conditions and argued that ice-flow models have to be modified to take in account these effects.
The enhanced creep of glacial ice was attributed to its inherently high impu- rity content compared to interglacial ice. The impurity concentrations in glacial ice are up to 2–3 orders of magnitude higher than in interglacial ice (Faria et al.,2010;
Legrand and Mayewski,1997b). In search for the responsible mechanism, (Paterson, 1991) reviewed microstructure data – grain sizes and c-axis preferred orientations (CPO) – and found that the high impurity concentration in glacial ice often correlates with a strong near-vertical single maximum CPO and significantly smaller grain sizes. Paterson’s conclusions were the following: (1) High impurity concentrations in glacial ice (possibly chloride and sulfate) slow down grain boundary migration and grain growth resulting in reduced grain sizes. (2) Fine grains in simple shear rotate faster and develop strong single maximum CPO. (3) Ice with a pronounced vertical CPO deforms easier in simple shear parallel to the bedrock.
The basis of data grew significantly in the last decades due to the drilling of new ice cores and improvements of the analytical techniques. The efficiency of microstructure measurements grew with the development of fast automatic instru- ments (Review by Faria et al.,2014c; LASM: Krischke et al.,2015; Fabric Analyser:
Peternell et al., 2010; Wilson et al., 2003) and the application of computer-based digital-image-processing algorithms for data analysis (Binder et al., 2013; Eichler, 2013). Thus, the grain size and CPO profiles along the EDML (Antarctica) and NEEM (Greenland) ice cores now exist at much higher spacial resolution and sta- tistical significance than in previous ice cores (see chapter8for the EDML ice core and Montagnat et al.,2014for the NEEM ice core). Recent data confirm correlations between impurity concentration, small grains, strong CPO and enhanced deforma- tion also on smaller scales. Repeated logging of the NEEM borehole has revealed that strong fluctuations of impurity concentrations on the scale of several meters –
FIGURE2.1: The chicken or the egg problem: High deformation rate, small grain size and strong CPO often characterize ice with high concentration of impurities. However, to distin- guish between the main cause and its effects is not so straight forward. Different causality chains were proposed by Cuffey et al. (2000b), Glen (1968), Goldsby and Kohlstedt (1997b), Jones and Glen (1969), and Paterson (1991).
an effect of Dansgaard–Oeschger events – were reflected in a local reduction of the borehole diameter (Dahl-Jensen, pers. comm.). Also the EDML borehole shows lo- calized deformations which correlate to abrupt changes of impurity concentrations in the ice core (chapter8).
However, as will be addressed in the next section, the sense of causalities be- tween the correlating observables is not resolved yet. To accomplish this quest is crucial to properly model the effect of impurities on the ice flow.
2.2 The Chicken or the Egg Problem
Paterson (1991) pointed out that enhanced shear deformation which is favored by a strong CPO further strengthens the CPO and keeps the grains small – i. e., there is a positive feedback between strain rate and CPO. In fact, the causality chain hy- pothesized by Paterson (impurities⇒small grains⇒strong CPO⇒enhanced de- formation) is only one of the possibilities and the implication relations between the observables need to be verified one by one. In the classical view for instance, CPO is typically understood as a product of strain (Azuma and Higashi,1985; Veen and Whillans,1994). Similarly, finer grain sizes are usually interpreted as a product of higher strain rates (Faria et al.,2014c). Hence, a direct control of the strain rate (im- purities⇒enhanced deformation) could also produce finer grain sizes and stronger CPO in the affected layers. Indeed, some impurities have been reported to enhance the dislocation activity, which directly controls the creep rate of ice (Glen,1968; Jones and Glen,1969; Whitworth et al.,1976). Another causality chain arises from the in- vestigations by Cuffey et al. (2000b), Goldsby and Kohlstedt (1997b), and Goldsby et al. (2001) who found a direct dependence of strain rate on grain size (impurities
⇒small grains⇒enhanced deformation⇒strong CPO). According to the authors,
2.3. How Do Impurities Integrate and Distribute in Ice? 15 grain-size-sensitive mechanisms such as grain boundary sliding (GBS) or diffusion along grain boundaries would play an important role for the flow of ice.
While the assumption that impurities act as the initial driver for different ice behavior seems to be justified, the relation between an enhanced strain rate and the characteristic microstructure (small grains and strong CPO) brings to mind the dilemma of the chicken or the egg (Fig. 2.1). In principle, the causality chain can only be resolved if concrete mechanisms behind the multiple correlations can be for- mulated and confirmed. Share the same motivation as Paterson (1991), our strategy is to confine the initial principal question “Why is impurity-rich ice soft?” to a more specific problem: How do different impurities integrate and distribute in ice? Ad- dressing this question would not only help to resolve the causality dilemma stated above, but is also of great relevance for our understanding and interpretation of the palaeo-climatic records in ice.
2.3 How Do Impurities Integrate and Distribute in Ice?
The main objective of this thesis is to answeir the question “How do impurities in- tegrage and distribute in natural ice?”. In fact, this problem includes a number of subquestions, in particular: How do impurities interact with grain boundaries? Do grain boundaries and triple junctions contain higher concentrations of some impu- rities? Which components dissociate in ice and which form a second phase?
Liquid water is a relatively good solvent due to the electric dipole of the water molecule. In contrast, solid ice rejects most extrinsic substances from the crystal (Pe- trenko and Whitworth,1999). This is caused by the dimensions and the geometry of the ice Ih lattice as well as the nature of the hydrogen bonds. The relevant the- ory predicts a few exceptions which – based on their ionic radii – could in principle substitute oxygens in the lattice (F−, Cl−) or fill interstitial sites (NH4+, Petrenko and Whitworth,1999). However, most chemical compounds are in general not able to properly incorporate in ice. Thus, they introduce some kind of distortion or local disorder which is associated with an increase of free energy. The amount of energy is defined by the amount of lattice distortion which again depends on the concentra- tion and form of impurities – e. g., individual ions, molecules, clusters or condensed phases (droplets and micro-particles). Furthermore, additional (chemical) effects can occur which can lower the eutectic point and lead to local melting (Bartels-Rausch et al.,2012; Dash et al.,2006).
Being planar lattice defects, grain boundaries also posses a finite energy ex- pressed as interface tension (γ ≈ 65 mJ m−2, Hobbs, 1974). During recrystalliza- tion, migrating grain boundaries occasionally cross impurities, so that the lattice- disordered areas merge, resulting in a release of energy. Vice versa, the separation of impurities from a grain boundary requires an extra work. The attraction between grain boundaries and second-phase inclusions is known from material sciences as theZener pinning (in Smith, 1948). The Zener force has a reducing effect on grain boundary migration and grain growth (Humphreys and Hatherly,2004). Thus grain boundary pinning on dust particles has been suggested as the main grain-size reduc- ing effect of impurities in glacial ice (Fisher and Koerner,1986). Alley et al.,1986a,b reviewed the Zener theory and concluded that particle concentrations in ice sheets are in general too low to significantly affect normal grain growth. However, dis- solved molecules or molecular clusters (nano-particles) are mobile enough to even- tually stick to the migrating grain boundary. With time and increasing amount of recrystallization, the concentration of impurities dragged with the migrating grain
boundary would grow causing a decrease of the grain boundary mobility. Thus observations of accumulations of impurities in grain boundaries would be a direct evidence for the grain-size reducing effect of impurities.
Measured data on the distribution and form of impurities in natural ice are rare and difficult to obtain due to the extremely low concentrations which require very sensitive analytical techniques. Among all, the three most suitable tools proved to be: Raman spectroscopy, energy-dispersive X-ray spectroscopy (EDX) and laser ablation inductively coupled plasma mass spectrometry (LA-ICPMS). Wolff and Paren (1984) suggested that acids like HCl, HNO3and H2SO4would concentrate at grain boundaries and triple junctions, lowering the eutectic point and forming liq- uid veins. This hypothesis was supported by Mulvaney et al. (1988) who used EDX to detect sulfur at three triple junctions in ice. Furthermore, Fukazawa et al. (1998b) detected sulfate in one triple junction using Raman spectroscopy. However, other Raman analyses by Ohno et al. (2005,2006) and Sakurai et al. (2011) found most (or all) sulfates forming salt particles without any correlation with grain boundaries or triple junctions. In contrast, EDX experiments by Baker et al. (2003), Barnes (2003), Barnes et al. (2002), and Cullen and Baker (2001) and Iliescu and Baker (2008) demonstrated traces of sodium, chlorine, and sulfur in filaments which would grow out of grain boundaries after controlled surface sublimation of natural ice samples.
Della Lunga et al. (2014) used UV-LA-ICPMS to analyze the spatial distribution of different elements in discrete samples from the glacial part of the NGRIP ice core. No correlation was found between impurities and grain boundaries in cloudy bands. However, the authors observed concentration peaks at grain boundaries in the cleaner parts of the ice. Particulate impurities (micro-inclusions) accumulated along grain boundaries were reported by Durand et al., 2006bwho used the dust concentrations to model grain size evolution along the Dome Concordia ice core.
However, other studies could not confirm such accumulations of micro-particles along grain boundaries (Faria et al.,2010).
A review of relevant literature shows that the results differ significantly from study to study. The way in which different impurities integrate in ice may in fact depend on various factors, e. g., the sample origin, temperature, deformation and recrystallization state, absolute impurity concentration and relative concentrations between different chemical compounds. In order to assess the questions stated at the beginning of this section, a more complex information is needed. Attaining this information requires a combination of complementary methods across different spa- tial scales and resolutions.