doi: 10.3389/feart.2021.674842
Edited by:
Min-Te Chen, National Taiwan Ocean University, Taiwan
Reviewed by:
Huang Huang, Sun Yat-sen University, China Yuan-Pin Chang, National Sun Yat-sen University, Taiwan
*Correspondence:
Jianjun Zou zoujianjun@fio.org.cn Xuefa Shi xfshi@fio.org.cn
Specialty section:
This article was submitted to Quaternary Science, Geomorphology and Paleoenvironment, a section of the journal Frontiers in Earth Science
Received:02 March 2021 Accepted:07 April 2021 Published:30 April 2021
Citation:
Chen J, Zou J, Zhu A, Shi X, Nürnberg D, Lembke-Jene L, Tiedemann R, Wang K, Wu Y, Dong Z, Liu J and Dou R (2021) Geochemistry of Surface Sediments From the Emperor Seamount Chain, North Pacific. Front. Earth Sci. 9:674842.
doi: 10.3389/feart.2021.674842
Geochemistry of Surface Sediments From the Emperor Seamount Chain, North Pacific
Jie Chen1, Jianjun Zou1,2* , Aimei Zhu1,2, Xuefa Shi1,2* , Dirk Nürnberg3,
Lester Lembke-Jene4, Ralf Tiedemann4, Kunshan Wang1,2, Yonghua Wu1,2, Zhi Dong1,2, Jianxing Liu1,2and Ruxi Dou1
1Key Laboratory of Marine Geology and Metallogeny, First Institute of Oceanography, Ministry of Natural Resources, Qingdao, China,2Laboratory for Marine Geology and Environment, Pilot National Oceanography Laboratory for Marine Science and Technology, Qingdao, China,3GEOMAR Helmholtz Centre for Ocean Research Kiel, Kiel, Germany,
4Alfred-Wegener-Institute, Helmholtz-Zentrum für Polar- und Meeresforschung, Bremerhaven, Germany
Investigating the composition and distribution of pelagic marine sediments is fundamental in the field of marine sedimentology. The spatial distributions of surface sediment are unclear due to limited investigation along the Emperor Seamount Chain of the North Pacific. In this study, a suite of sedimentological and geochemical proxies were analyzed, including the sediment grain size, organic carbon, CaCO3, major and rare earth elements of 50 surface sediment samples from the Emperor Seamount Chain, spanning from∼33◦N to∼52◦N. On the basis of sedimentary components, we divide them into three Zones (I, II, and III) spatially with distinct features. Sediments in Zone I (∼33◦N–44◦N) and Zone III (49.8◦N–53◦N) are dominated by clayey silt, and mainly consist of sand and silty sand in Zone II. The mean grain size of the sortable silt shows that the hydrodynamic condition in the study area is significantly stronger than that of the abyssal plain, especially at the water depth of 1,000–2,500 m. The CaCO3 contents in sediments above 4,000 m range from 20 to 84% but decrease sharply to less than 1.5% below 4,000 m, confirming that the water depth of 4,000 m is the carbonate compensation depth of the study area. Strong positive correlations between Al2O3 and Fe2O3, TiO2, MgO, and K2O (R > 0.9) in the bulk sediments indicate pronounced contributions of terrigenous materials from surrounding continent mass to the study area. Furthermore, the eolian dust makes contributions to the composition of bulk sediments as confirmed by rare earth elements. There is no significant correlation between grain size and major and minor elements, which indicates that the sedimentary grain size does not exert important effects on terrigenous components. There is significant negativeδCe and positiveδEu anomalies at all stations.
The negative Ce anomaly mainly exists in carbonate-rich sediments, inheriting the signal of seawater. The positive Eu anomaly indicates widespread volcanism contributions to the study area from active volcanic islands arcs around the North Pacific. The relative contributions of terrestrial, volcanic, and biogenic materials vary with latitude and water depth in the study area.
Keywords: sediment grain size, spatial distribution of sediment, Ce negative anomaly, sediment provenance, Emperor Seamount Chain
feart-09-674842 April 26, 2021 Time: 15:53 # 2
Chen et al. Surface Sediments – Emperor Seamount Chain
INTRODUCTION
The geochemical composition of marine sediments, including the contributions of terrestrial, volcanic and biogenic materials, reveals abundant information about ocean current circulation, ecosystem community structure, tectonic movement, and climate change, etc. (Ding et al., 1994;Liu et al., 2009;Hu et al., 2012;
Franzese and Hemming, 2013). Determining the composition and distribution of pelagic sediments is fundamental to marine sedimentology, as well as the basis for studying marine ecological assessment, resource exploitation, the reconstruction of past oceanic environment and climatic evolution, etc.
The seamounts are widespread and prominent features of the world’s underwater topography. More and more studies suggest that their biological communities, benthic biodiversity, marine
biogeography, marine fisheries, hydrodynamic conditions, mineral resources, and climate change are all vital (Clark et al., 2010). In recent years, some studies have greatly improved our understanding of seamount ecology (Mcclain, 2007), especially the vulnerability of seamount communities to human impacts. With progresses in seamount research, it is necessary to reveal some basic characteristics of seamounts, including the composition of sediments deposited on seamount evolution of ecosystems and the development of resources (Mcclain, 2007).
The Emperor Seamount Chain is located in the North Pacific Ocean, extending from∼20◦N to∼50◦N, with a length of more than 6,000 km, which varies greatly in topography. It extends from the point of junction between the Aleutian Trench and the Kuril Trench to Hawaii Island (Jiang et al., 2019). The formation mechanism of the Emperor Seamount Chain is related to hot
FIGURE 1 |The map of sites locations, schematic of ocean circulation(A)(Wang et al., 2016) and the sectional view of dissolved oxygen concentration(B)of SO264 surface sediments from the Emperor Seamount Chain in North Pacific Ocean. The study sites are marked with red, blue, and green dots in panels(A,B).
Blue dots, red dots and green dots represent samples in zone I, II, and III, respectively. Black arrows and yellow dashed lines denote surface ocean circulation and Subarctic Front (Aydin et al., 2004), respectively. EKC = East Kamchatka Current, KC = Kuroshio Current, KE = Kuroshio Extension, NPC = North Pacific Current, OC = Oyashio Current. Map drawn with Ocean Data View (Schlitzer, 2002). NPIW = North Pacific Intermediate Water, NPDW = North Pacific Deep Water, LCDW = Lower Circumpolar Deep Water.
spot, and the tectonic plate beneath most parts of the Pacific Ocean are constantly moving to the northwest, while hot spot remains stationary, forming a chain slowly (Wilson, 1973). Due to the existence of seamounts, atolls, shoals, ridges, and submerged reefs, the study area is a hot area for geophysicists to investigate plate tectonics and models (Moore, 1970; Suzanne and David, 2000). However, there is little research on the sedimentology, paleoclimate, and paleoenvironment in this area.
To reveal the spatial distributions of sediment compositions, here a suite of proxies were measured on 50 surface sediments from the Emperor Seamount Chain, including the grain size, major elements, rare earth elements, and CaCO3.
OCEANOGRAPHY BACKGROUND
The North Pacific Ocean is divided into the Subarctic Gyre and the Subtropical Gyre by the Subarctic Front (Qiu, 2002;Wang et al., 2016). The surface circulation to the south of the Subarctic Front includes the North Pacific Current, the Kuroshio Current, and the Kuroshio Extension. The Subarctic Gyre contains the Alaska Gyre in the east and the Western Subarctic Gyre in the west respectively (Ren et al., 2014). The ventilation of the Western Subarctic Gyre flows into the subtropical sea along the western boundary, which may be created by the invasion of Oyashio Current. Along the west subarctic region, the southward Oyashio Current deflects eastward at about 40◦N and enters the open North Pacific Ocean. In the Aleutian forearc area, the surface circulation is mainly composed by the Alaskan Current, and the part extending northward to the Bering Sea (Figure 1A).
There is no formation of deep water in the modern Pacific Ocean, but the North Pacific Intermediate Water (NPIW) is developed (Warner et al., 1996), mainly from the Sea of Okhotsk (Talley, 1993) and the Gulf of Alaska (Van Scoy and Druffel, 1993;
You, 2003). The NPIW is mainly transported to 150◦W in the east of about 40◦N, then to∼20◦N in the south, and partially returns to the west, forming a clockwise cycle. At present, the NPIW is characterized by low salt, rich oxygen, and low density (water depth of 300–800 m, salinity of 33.3–33.4, content of dissolved oxygen is 50–150µmol/kg and density is 26.6–27.0σθ) (Talley, 1993). There is also much debate about the formation of deep water masses in the North Pacific Ocean. The water mass with a depth of more than 3,500 m is mainly transported northward by the lower circumpolar deep water (LCDW), which is characterized by higher salinity and lower silicate (Kawabe and Fujio, 2010), and deep water in the North Pacific is developed between NPIW and LCDW and transported southward.
The open Subarctic Pacific is mainly fed by two types of terrestrial sediments: aeolian dust and clastic deposits carried by ocean currents (Wang et al., 2016). Eolian dust accounts for 90% of the open Subarctic Pacific sediments, but the volcanic contribution increased significantly and the eolian dust contribution decreased in the Kuril Islands and the Aleutian Arc region (Serno et al., 2014). Up to now, we have not paid enough attention to the geochemical composition and sediments provenance in the Emperor Seamount Chain of North Pacific.
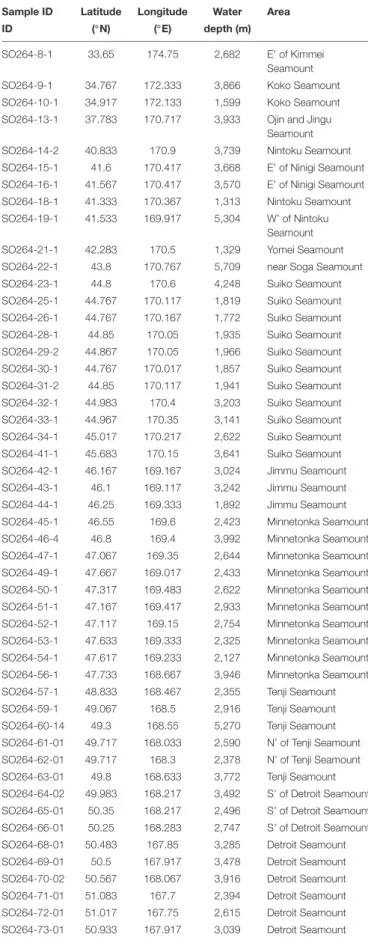
TABLE 1 |All samples of surface sediment information are mentioned in this article.
Sample ID Latitude Longitude Water Area
ID (◦N) (◦E) depth (m)
SO264-8-1 33.65 174.75 2,682 E’ of Kimmei
Seamount
SO264-9-1 34.767 172.333 3,866 Koko Seamount
SO264-10-1 34.917 172.133 1,599 Koko Seamount SO264-13-1 37.783 170.717 3,933 Ojin and Jingu
Seamount
SO264-14-2 40.833 170.9 3,739 Nintoku Seamount
SO264-15-1 41.6 170.417 3,668 E’ of Ninigi Seamount SO264-16-1 41.567 170.417 3,570 E’ of Ninigi Seamount SO264-18-1 41.333 170.367 1,313 Nintoku Seamount SO264-19-1 41.533 169.917 5,304 W’ of Nintoku
Seamount
SO264-21-1 42.283 170.5 1,329 Yomei Seamount
SO264-22-1 43.8 170.767 5,709 near Soga Seamount
SO264-23-1 44.8 170.6 4,248 Suiko Seamount
SO264-25-1 44.767 170.117 1,819 Suiko Seamount SO264-26-1 44.767 170.167 1,772 Suiko Seamount
SO264-28-1 44.85 170.05 1,935 Suiko Seamount
SO264-29-2 44.867 170.05 1,966 Suiko Seamount SO264-30-1 44.767 170.017 1,857 Suiko Seamount SO264-31-2 44.85 170.117 1,941 Suiko Seamount
SO264-32-1 44.983 170.4 3,203 Suiko Seamount
SO264-33-1 44.967 170.35 3,141 Suiko Seamount SO264-34-1 45.017 170.217 2,622 Suiko Seamount SO264-41-1 45.683 170.15 3,641 Suiko Seamount SO264-42-1 46.167 169.167 3,024 Jimmu Seamount
SO264-43-1 46.1 169.117 3,242 Jimmu Seamount
SO264-44-1 46.25 169.333 1,892 Jimmu Seamount
SO264-45-1 46.55 169.6 2,423 Minnetonka Seamount
SO264-46-4 46.8 169.4 3,992 Minnetonka Seamount
SO264-47-1 47.067 169.35 2,644 Minnetonka Seamount SO264-49-1 47.667 169.017 2,433 Minnetonka Seamount SO264-50-1 47.317 169.483 2,622 Minnetonka Seamount SO264-51-1 47.167 169.417 2,933 Minnetonka Seamount SO264-52-1 47.117 169.15 2,754 Minnetonka Seamount SO264-53-1 47.633 169.333 2,325 Minnetonka Seamount SO264-54-1 47.617 169.233 2,127 Minnetonka Seamount SO264-56-1 47.733 168.667 3,946 Minnetonka Seamount SO264-57-1 48.833 168.467 2,355 Tenji Seamount
SO264-59-1 49.067 168.5 2,916 Tenji Seamount
SO264-60-14 49.3 168.55 5,270 Tenji Seamount
SO264-61-01 49.717 168.033 2,590 N’ of Tenji Seamount SO264-62-01 49.717 168.3 2,378 N’ of Tenji Seamount SO264-63-01 49.8 168.633 3,772 Tenji Seamount SO264-64-02 49.983 168.217 3,492 S’ of Detroit Seamount SO264-65-01 50.35 168.217 2,496 S’ of Detroit Seamount SO264-66-01 50.25 168.283 2,747 S’ of Detroit Seamount SO264-68-01 50.483 167.85 3,285 Detroit Seamount SO264-69-01 50.5 167.917 3,478 Detroit Seamount SO264-70-02 50.567 168.067 3,916 Detroit Seamount SO264-71-01 51.083 167.7 2,394 Detroit Seamount SO264-72-01 51.017 167.75 2,615 Detroit Seamount SO264-73-01 50.933 167.917 3,039 Detroit Seamount
feart-09-674842 April 26, 2021 Time: 15:53 # 4
Chen et al. Surface Sediments – Emperor Seamount Chain
FIGURE 2 |The distribution diagrams of parameters related to grain size of surface sediments. The triangular diagram of grain size(A), the distribution curves of grain size-volumic content(B–D), the graph of linear correlation of end members(E), and the distribution curves of grain size-frequency of modeled end members(F).
Studies of sediments on core ODP 882A in Detroit Seamount, which is located in the northernmost part of ESC, show that terrestrial sediments of core ODP 882A mainly consist of ice raft debris in the high latitude regions and Asian eolian dust brought by westerly jet (Jiang and Liu, 2011). The environment magnetism index recognizes that the degree of drought in the source region of terrigenous clastic material increases obviously, which is consistent with the change record of the aggravation of drought in the Inner Asian and the prevalence of monsoon in East Asia recorded by the loess in East Asia (Jiang and Liu, 2011).
MATERIALS AND METHODS Sediments Samples
Surface multicorers (MUC) sediments were investigated, which were collected during SO264 Expedition in 2018 (Nürnberg, 2018), and all stations information are reported inTable 1. These cores were sampled in 1 cm slice at the onboard laboratory, and then stored in the sample cabin at 4◦C. The sampling stations are
TABLE 2 |The grain-size modeled end members of SO264 surface sediments from the Emperor Seamount Chain in the North Pacific Ocean.
End member Grain size (µm) Sort coefficient (σ) Skewness Peakedness
EM1 9.12 3.60 0.57 3.08
EM2 64.95 1.90 −0.18 2.81
EM3 157.67 1.59 −0.44 3.15
located along the Emperor Seamount Chain shown inFigure 1A, between ∼167◦E–175◦E and 33.5◦N–52◦N. The water depth ranges from 1,313 to 5,709 m, covering with intermediate water (200–1,500 m), deep water (1,500–4,000 m) and bottom water (>4,000 m) in the North Pacific Ocean. And all the surface sediment samples are collected from the multicores, which has been dated on the basis of planktic foraminiferal AMS14C. The dating results support that the age of surface sediments belonged to the Holocene interval.
The surface sediments (0–1 cm) from 50 stations were used to determine grain size, major elements, and rare earth elements. The contents of organic carbon, total carbon (TC), and total nitrogen (TN) of the bulk samples were analyzed. All experiment processing and analysis tests were done at the Key Laboratory of Marine Geology and Metallogeny, First Institute of Oceanography, Ministry of Natural Resources, China.
Sediment Grain Size Analysis
The organic matter, carbonate fractions and biogenic silica of all samples were removed with 5 mL H2O2 (30%), 5 mL HCl (10%), and excessive NaOH (0.2 M), respectively. After adding different reagents, the water bath was heated in the above three steps for 1, 1, and 2 h, respectively. Then they were rinsed with deionized water for three times, and the pH value of supernatant was neutral. Grain-size measurements were conducted by laser diffraction particle size analysis using a Malvern Mastersizer 3000. The grain-size range of measurement by the Malvern Mastersizer 3000 is 0.01–3,500 µm, and the relative error of
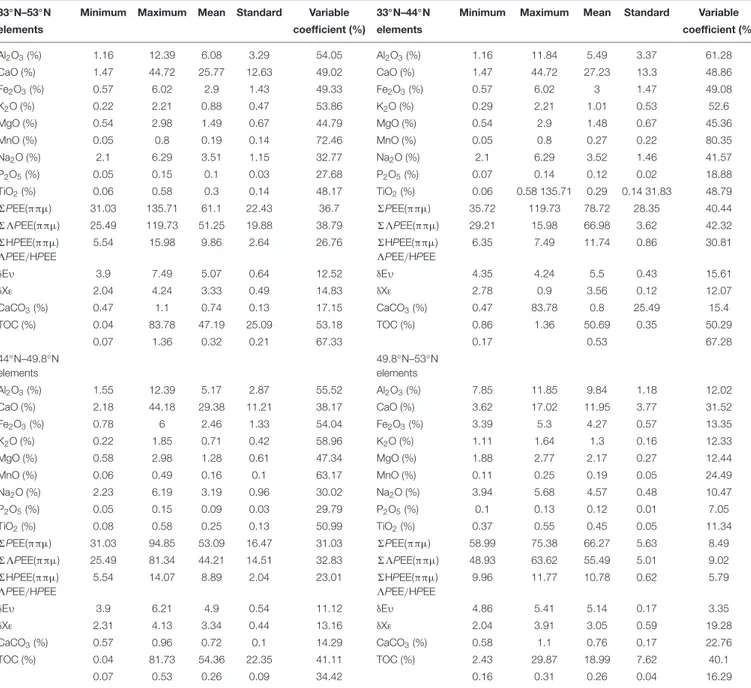
TABLE 3 |Statistical results of elemental concentrations of surface sediments in the study area.
33◦N–53◦N Minimum Maximum Mean Standard Variable 33◦N–44◦N Minimum Maximum Mean Standard Variable
elements coefficient (%) elements coefficient (%)
Al2O3(%) 1.16 12.39 6.08 3.29 54.05 Al2O3(%) 1.16 11.84 5.49 3.37 61.28
CaO (%) 1.47 44.72 25.77 12.63 49.02 CaO (%) 1.47 44.72 27.23 13.3 48.86
Fe2O3(%) 0.57 6.02 2.9 1.43 49.33 Fe2O3(%) 0.57 6.02 3 1.47 49.08
K2O (%) 0.22 2.21 0.88 0.47 53.86 K2O (%) 0.29 2.21 1.01 0.53 52.6
MgO (%) 0.54 2.98 1.49 0.67 44.79 MgO (%) 0.54 2.9 1.48 0.67 45.36
MnO (%) 0.05 0.8 0.19 0.14 72.46 MnO (%) 0.05 0.8 0.27 0.22 80.35
Na2O (%) 2.1 6.29 3.51 1.15 32.77 Na2O (%) 2.1 6.29 3.52 1.46 41.57
P2O5(%) 0.05 0.15 0.1 0.03 27.68 P2O5(%) 0.07 0.14 0.12 0.02 18.88
TiO2(%) 0.06 0.58 0.3 0.14 48.17 TiO2(%) 0.06 0.58 135.71 0.29 0.14 31.83 48.79
6PEE(ππµ) 31.03 135.71 61.1 22.43 36.7 6PEE(ππµ) 35.72 119.73 78.72 28.35 40.44
63PEE(ππµ) 25.49 119.73 51.25 19.88 38.79 63PEE(ππµ) 29.21 15.98 66.98 3.62 42.32
6HPEE(ππµ) 3PEE/HPEE
5.54 15.98 9.86 2.64 26.76 6HPEE(ππµ)
3PEE/HPEE
6.35 7.49 11.74 0.86 30.81
δEυ 3.9 7.49 5.07 0.64 12.52 δEυ 4.35 4.24 5.5 0.43 15.61
δXε 2.04 4.24 3.33 0.49 14.83 δXε 2.78 0.9 3.56 0.12 12.07
CaCO3(%) 0.47 1.1 0.74 0.13 17.15 CaCO3(%) 0.47 83.78 0.8 25.49 15.4
TOC (%) 0.04 83.78 47.19 25.09 53.18 TOC (%) 0.86 1.36 50.69 0.35 50.29
0.07 1.36 0.32 0.21 67.33 0.17 0.53 67.28
44◦N–49.8◦N elements
49.8◦N–53◦N elements
Al2O3(%) 1.55 12.39 5.17 2.87 55.52 Al2O3(%) 7.85 11.85 9.84 1.18 12.02
CaO (%) 2.18 44.18 29.38 11.21 38.17 CaO (%) 3.62 17.02 11.95 3.77 31.52
Fe2O3(%) 0.78 6 2.46 1.33 54.04 Fe2O3(%) 3.39 5.3 4.27 0.57 13.35
K2O (%) 0.22 1.85 0.71 0.42 58.96 K2O (%) 1.11 1.64 1.3 0.16 12.33
MgO (%) 0.58 2.98 1.28 0.61 47.34 MgO (%) 1.88 2.77 2.17 0.27 12.44
MnO (%) 0.06 0.49 0.16 0.1 63.17 MnO (%) 0.11 0.25 0.19 0.05 24.49
Na2O (%) 2.23 6.19 3.19 0.96 30.02 Na2O (%) 3.94 5.68 4.57 0.48 10.47
P2O5(%) 0.05 0.15 0.09 0.03 29.79 P2O5(%) 0.1 0.13 0.12 0.01 7.05
TiO2(%) 0.08 0.58 0.25 0.13 50.99 TiO2(%) 0.37 0.55 0.45 0.05 11.34
6PEE(ππµ) 31.03 94.85 53.09 16.47 31.03 6PEE(ππµ) 58.99 75.38 66.27 5.63 8.49
63PEE(ππµ) 25.49 81.34 44.21 14.51 32.83 63PEE(ππµ) 48.93 63.62 55.49 5.01 9.02
6HPEE(ππµ) 3PEE/HPEE
5.54 14.07 8.89 2.04 23.01 6HPEE(ππµ)
3PEE/HPEE
9.96 11.77 10.78 0.62 5.79
δEυ 3.9 6.21 4.9 0.54 11.12 δEυ 4.86 5.41 5.14 0.17 3.35
δXε 2.31 4.13 3.34 0.44 13.16 δXε 2.04 3.91 3.05 0.59 19.28
CaCO3(%) 0.57 0.96 0.72 0.1 14.29 CaCO3(%) 0.58 1.1 0.76 0.17 22.76
TOC (%) 0.04 81.73 54.36 22.35 41.11 TOC (%) 2.43 29.87 18.99 7.62 40.1
0.07 0.53 0.26 0.09 34.42 0.16 0.31 0.26 0.04 16.29
repeated measurement is less than 3%. According to Weltje (1997) andWeltje and Prins (2003), sediments are composed of components from different provenance or dynamic processes, and different end members (EM) can be separated by multi- peak morphology of grain size data. Therefore, the end-member analysis model is proposed to distinguish different provenance or transport mechanisms (Weltje, 1997;Weltje and Prins, 2003).
Paterson and Heslop (2015)improved the analysis model ofEM based onMATLAB(Paterson and Heslop, 2015), and we utilize the modeling algorithm to analyze grain size end-member of surface sediments, with using the meanEMof sediment was fitted by Gen.Webibull function.
Total Organic Carbon, TN, and CaCO
3Analysis
About 50.00 mg of sample was weighted, freeze-dried and ground to less than 200 mesh by agate mortar, which was directly used for determination of the content of TC and TN. The manually powdered samples of ∼1 g were placed in the centrifuge tube, dissolved by HCl (1M) to remove carbonate, and then they were dried to determine the contents of total organic carbon (TOC).
Acetailide (ACET) was used as the standard sample and GSD- 9 was used as the quality control standard reference materials during the measurement. The contents of TOC, TC, TN were tested by Elemental Vario EL III (Bai et al., 2013).
feart-09-674842 April 26, 2021 Time: 15:53 # 6
Chen et al. Surface Sediments – Emperor Seamount Chain
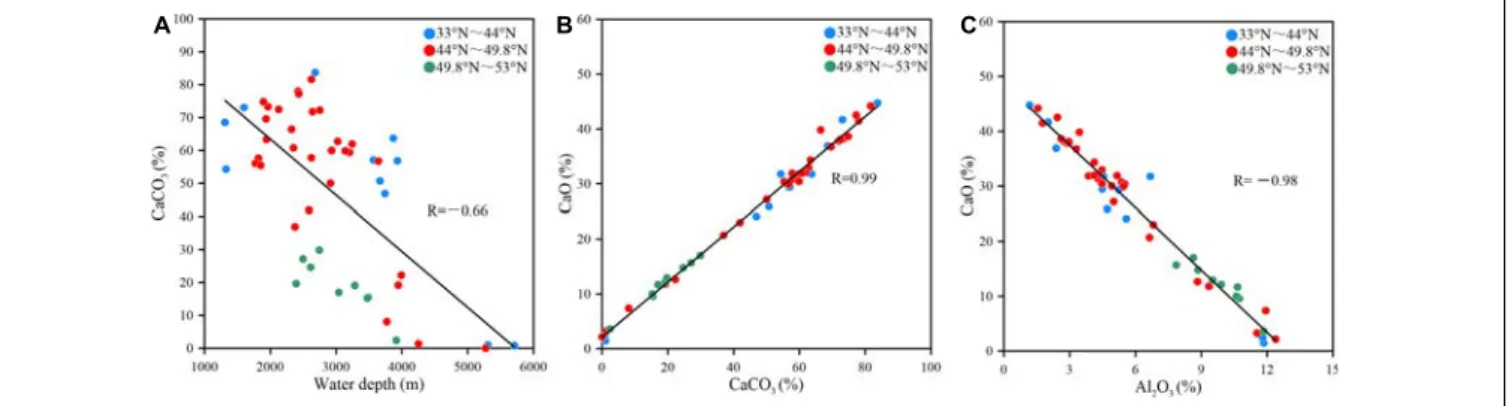
FIGURE 3 |The scatter plots between CaCO3and water depth(A)and between CaO and CaCO3(B)and between CaO and Al2O3(C).
The content of CaCO3is calculated according to the following formula:
CaCO3= (TC–TOC)×8.33
Major and Minor Elements
About 50.00 mg of powdered sample was placed in the centrifuge tube. And high-purity HNO3, HF and concentrated HCl were used to completely digest sediments. Major elements (Al2O3, Fe2O3, K2O, MgO, MnO, P2O5, CaO, and TiO2) were analyzed on Thermal iCAP 6300 ICP-OES. Rare earth elements were analyzed on a Thermal series II ICP-MS. GSD-9, duplicate samples and blank samples were used for quality control during the measurement. The analytical results of blank samples were all below the detection limit. The results show that relative standard deviation of major elements is less than 2.2%, and that of rare earth elements is less than 5.1%.
RESULTS
The Grain-Size Distribution
The grain size and sorting coefficient of sediments in the study area range from 7.74 to 192.71 µm and 0.64 to 2.61, with an average value of 42.91µm and 1.66, respectively. The frequency distribution curves of sediments grain size have different modes (Figures 2B–D), and these curves show the left trailing of some stations, indicating that they are affected by various factors.
According to distinct features of grain size-related parameters, including the sediment types and grain size characteristics, the study area was divided into three areas: Zone I (33◦N–
44◦N), Zone II (44◦N–49.8◦N), and Zone III (49.8◦N–53◦N) (Figure 2A). Sediments in Zone I and in Zone III are dominated by clayey silt with higher value of sorting coefficient (>1.66).
The grain size-frequency distribution curves are characterized by usually double peaks, which are concentrated between 5 and 8 µm and 140–150µm in Zone I, respectively (Figure 2B). This indicates that the sediments may have different provenance or poor sorting coefficient. In zone III, the curves are dominated by single peaks, with the peak value between 7 and 64 µm (Figure 2D). In Zone II (44◦N–49.8◦N), the sediments are mainly composed of sand and silty sand, with lower sorting coefficient.
The stations with grain size of less than 42.91 µm are mainly located in this zone, and curves consist of single and double peaks. Most of curves are single peaks, and vary between 120 and 170µm, indicating that the sediment has a single provenance or is well sorted.
The calculation results of grain size data shows that when the end-member number is 1–6, the R2 is 0.6517, 0.9485, 0.9875, 0.9925, 0.9960, and 0.9979 (Figure 2E), respectively.
From the point of view of the degree of data fitting, three end- member numbers are selected to analyze the grain size in this paper because it can well represent the overall characteristics of the grain size. End-member analysis of sediment grain-size distribution has an optimal model with three EM, all of which are single peaks and close to Gaussian distribution (Figure 2F andTable 2). These peaks appear at 2.54–17.1, 48.40–96.75, and 136.85–230.1 µm, with mean grain size of 9.12µm, 64.95µm and 157.67µm, respectively. The abundance of EM is 0–100, 0–
75.33, and 0–100%, with average abundances of 37.85, 24.73, and 37.42% respectively.
Contents of CaCO
3and TOC
The content of calcium carbonate in surface sediments in the study area ranges between 0.04 and 83.78%, with a mean value of about ∼47.19% (Table 3). The calcium carbonate content in marine sediments is mainly affected by production, dissolution and dilution effect. Generally, the content of CaCO3 is less than 2% at stations with water depth of more than 4,000 m (Figure 3A). According toFarrell and Warren (1989), 10% calcium carbonate in the Pacific Ocean is defined as the carbonate compensation depth (Farrell and Warren, 1989).
Therefore, the calcium carbonate content in this area indicates that the water depth of 4,000 m is the carbonate compensation depth of this area. There is no significant relationship between the content of CaCO3 and water depth of above 4,000 m.
At similar water depth to the north of 49.8◦N, the content of CaCO3 is obviously lower than that to the south of 49.8◦N in the study area. In the range of 33◦N–49.8◦N, the content of CaCO3 in most stations is more than 30%.
The mean content of CaCO3 in the zone of 33◦N–44◦N is about 50.69%, and which decreases gradually from south to north on the whole.
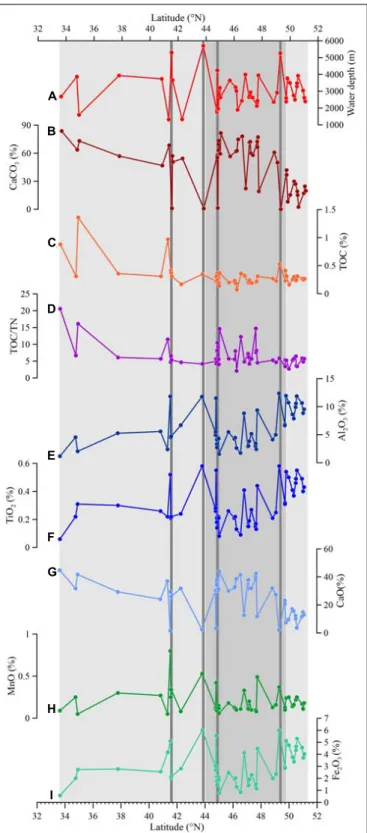
FIGURE 4 |Spatial variations in the contents of major elements in the study area. The dark black vertical lines indicate stations with water depth greater than 4,000 m. The spatial variation of water depth(A), spatial variation in the content of CaCO3(B), spatial variation in the content of TOC(C), spatial variation in the content of TOC/TN(D), spatial variation in the content of Al2O3
(E), spatial variation in the content of TiO2(F), spatial variation in the content of CaO(G), spatial variation in the content of MnO(H)and spatial variation in the content of Fe2O3(I).
The content of TOC in sediments varies between 0.07 and 1.36%, averaging about 0.32% (Table 3). In general, the stations with higher contents of TOC mainly are located between 33◦N–
44◦N (Figure 4). The correlation coefficient between TOC and TN is insignificant (R = 0.48). The ratio of TOC/TN varies between 2.45 and 24.0, with a mean value of 7.68. Besides the supply from surface primary productivity, the content of organic matter is also affected by aerobic respiration and denitrification (Wang et al., 2018). The ratio of TOC/TN of terrestrial organic matter is generally greater than 15, as well as between 5 and 7 for marine organic matter (Fry and Sherr, 1984;Meyers, 1997). We noted that the ratio of TOC/TN of 6 stations is more than 12, although the study area is far from land, indicating a potential supply of terrestrial organic matter to the study area, or that nitrogen loss caused by early diagenesis, leading to an increase of TOC/TN ratio.
Major Elements
The content of CaO in surface sediments is dominant with a range of 1.47–44.72% and a mean value of 25.77% (Table 3).
There is a strong positive correlation between CaO and CaCO3 on the whole (R= 0.99) (Figure 3B), thus mainly reflects the contribution of biogenic materials. Within the latitudinal range of 33◦N–44◦N, 44◦N–49.8◦N, and 49.8◦N–53◦N, the mean content of CaO is 27.23, 29.38 and 11.95%, respectively. The lower values mainly appears between around 44◦N and 49.8◦N, and the highest value is found around 33.65◦N (Figure 3).
The content of Al2O3 ranges between 1.16 and 12.39% with an average value of 6.08% (Table 3). As a whole the variation of Al2O3 with latitude is opposite to that of CaO, the high value of Al2O3 in the northern region of 49.8◦N and deeper than 4,000 m. The mean content of Fe2O3, K2O, MgO and TiO2 is 2.95, 0.89, 1.51, and 0.30%, respectively, which is similar to the spatial distribution pattern of Al2O3. Correlation analysis shows that there are significant positive correlations among Al- Fe, Al-K, Al-Mg and Al-Ti, with correlation coefficients of 0.93, 0.93, 0.98, and 0.97, respectively (Figure 6). There is positive correlations between Al2O3–MnO and Al2O3–P2O5, and the correlation coefficient is 0.65 and 0.82, respectively (Figure 6).
Rare Earth Elements
The content of rare earth elements (6REE) of surface sediments varies between∼31 and 136µg/g, with a mean value of∼61µg/g, and the coefficient of variation is 36.70% (Table 3), indicating that there are significant differences in content of different stations.
The contents of light rare earth elements (6LREE: La, Ce, Pr, Nd, Sm, and Eu) and heavy rare earth elements (6HREE: Gd, Tb, Td, Dy, Ho, Er, Tm, Yb, and Lu) range between 25.49–119.73 and 5.54–15.98µg/g, with a mean value of 51.25µg/g and 9.86 µg/g, respectively. LREE/HREE ranges from 4.60 to 7.50, with an average value of 5.20. There is a significant positive correlation between rare elements with correlation coefficient of more than 0.98. Also significant positive correlation is observed between Al2O3 and6REE (R= 0.65). Overall, the patterns of 6REE, 6LREE, and6HREE are similar along the latitudinal zone, with higher values at around 44◦N and 49.8◦N (Figure 7).
feart-09-674842 April 26, 2021 Time: 15:53 # 8
Chen et al. Surface Sediments – Emperor Seamount Chain
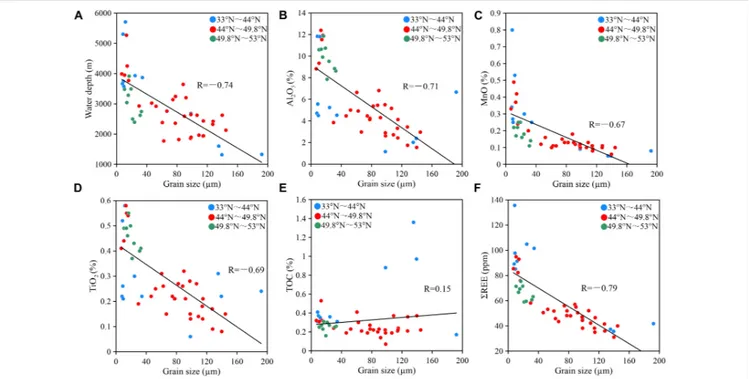
FIGURE 5 |The scatter plots between grain size and contents of major elements. The correlation between water depth and grain size (R=−0.74,A), the correlation between Al2O3and grain size (R=−0.71,B), the correlation between MnO and grain size (R=−0.67,C), the correlation between TiO2and grain size (R=−0.69, D), the correlation between TOC and grain size (R= 0.15,E) and the correlation between6REE and grain size (R=−0.79,F).
FIGURE 6 |The scatter plots between Al2O3and other elements. The correlation between CaCO3and Al2O3(R=−0.99,A), the correlation between Fe2O3and Al2O3(R= 0.93,B), the correlation between K2O and Al2O3(R= 0.93,C), the correlation between TiO2and Al2O3(R= 0.97,D), the correlation between MnO and Al2O3(R= 0.65,E), the correlation between MgO and Al2O3(R= 0.98,F), the correlation between P2O5and Al2O3(R= 0.82,G) and the correlation between 6REE and Al2O3(R= 0.65,H).
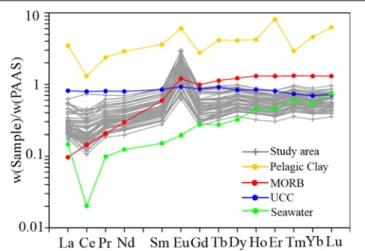
We used the Post-Archean Average Shale (PAAS) to normalize the rare earth elements in the study area as shown inFigure 8.
The distribution patterns of curves show obvious characteristics of enrichment of HREE. The analysis shows that both Ce and
Eu range between 0.47–1.10 and 2.04–4.24, with average values of 0.74 and 3.33, respectively. Although the contents of6REE at different stations in the study area are quite variable, the distribution patterns of REE in surface sediments are roughly
FIGURE 7 |Spatial trends of rare earth elements and related proxies. The spatial variation of water depth(A), spatial variation in the content of6REE (B), spatial variation in the content of6LREE(C), spatial variation in the content of6HREE(D), spatial variation ofδCe(E)and spatial variation ofδEu(F).
identical, and the sediments totally appear Ce negative anomaly and Eu positive anomaly (Figure 7).
DISCUSSION
Sediment Dynamics in the Emperor Seamount Chain
The grain size of sediments is affected by mineral composition, process of weathering transport and sedimentary dynamic conditions, and the grain size and morphology of sediments in different regions are obviously different. Negative correlation between water depth and grain size (R= −0.74,Figure 5A) in the study area suggests that the deeper the water depth is, the finer the grain size of sediments is. In order to further reveal the relationship between hydrodynamic condition and water depth,
FIGURE 8 |Comparisons of PAAS-normalized rare earth elements patterns of surface sediments of the Emperor Seamount Chain, the content of REE of pelagic clay (Kato et al., 2011), MORB (Klein, 2003), UCC (Taylor and Mclennan, 1995), and seawater (Zhang and Nozaki, 1998).
we calculated the mean grain size of the sortable silt, a proxy for deep current intensity (Mccave et al., 1995). Mean grain size of sortable silt shows strong positive correlation with the contents of sortable silt in the study area, suggesting that it can be used to indicate the relative change of bottom current strength (Mccave et al., 2020). As shown inFigure 9, there is a negative correlation between grain size of sortable silt and water depth (R=−0.73), and grain size of sortable silt increases significantly, indicating strong hydrodynamic conditions. Modern observations have shown that there are strong hydrodynamic conditions at the water depth of∼2,000 m in the study area (Ueno, 2003), and the results of grain size further confirmed the observation results of deep flow field. It can be seen fromFigures 5A, 9 that the range of water depth in different zones is discrepant, the water depth of all sediment collected in zone II is no deeper than 4,000 m.
Therefore, the water depth could affect the geochemical proxies variation in the study area. And we only discuss the relationship between the overall water depth and the grain size and the mean grain size of the sortable silt due to the lack of samples in different water depth of discussion section, such as the lack of samples in the 1,500–3,000 m of zone I.
Also, we conducted the sediment grain size end-member simulations using MATLAB (Paterson and Heslop, 2015).
According to the grain size analysis of simulated EM, there are three EM with mean grain size of 9.12 µm (EM1), 64.95µm (EM2), and 157.67µm (EM3), representing fine silt, fine sand and medium sand, respectively. Furthermore, using the same simulation method of EM analysis, we compared our data with the results of the SO202 Expedition from the open subarctic Pacific Ocean (Serno et al., 2014), and found that mean grain size was about 5.33 µm. This indicates that there are great differences in hydrodynamic conditions between seamounts and deep plain of the open subarctic Pacific Ocean. It has previously been observed that vortex is easily to occur around seamount under the combined influence of
feart-09-674842 April 26, 2021 Time: 15:53 # 10
Chen et al. Surface Sediments – Emperor Seamount Chain
FIGURE 9 |The correlation plot between grain size of sortable silt and water depth.
tide and topography (Oka and Niwa, 2013), and hydrodynamic condition is significantly enhanced, causing the sediment being severely winnowed.
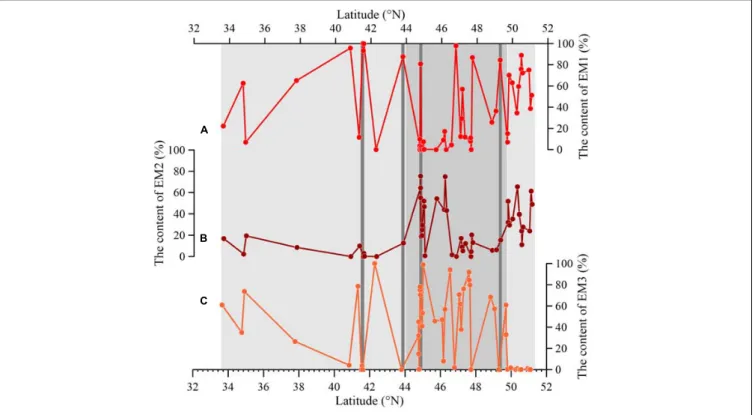
The higher contents of EM1 mainly appear at stations of 33◦N–44◦N and deeper than 4,000 m (Figure 10), which may represent the input of terrestrial and volcanic sources by wind, and also correspond to the westerly path of the modern Northern Hemisphere. In this context, it is reasonable to speculate that EM1 mainly reflects the contribution of eolian dust, including dust of Central Asia and volcanic materials by wind-transported.
The grain sizes of EM2 and EM3 are coarser and cannot be transported by wind over long distances, so they cannot be explained by dust input. The content of EM3 decreases to the north of 49.8◦N and increases to the south of 49.8◦N, which may reflect that sediments in the study area are reworked after deposition by strong hydrodynamic conditions.
As shown inFigure 5A and end member analysis, coarser sediment grain size can be seen in Zone II, relative to Zone I and III, we argue that this is mainly related to strong mid-depth and deep-depth circulation in Zone II as mentioned above. And the mean grain size of sortable silt (Figure 9), which shows higher SS values, corroborating our interference. Some coarser sediment grain size in zone II at the water depth of 3,000–4,000 m in comparison with those of zone I and III also can be observed in Figure 9, which may be caused by additional factors, such as the input of volcanic materials, proximal erosion of seamount, etc.
There is significant relationship between composition of sediment and grain size, which is especially obvious in the coastal sediments (Zhao et al., 2002;Gao et al., 2003;Jiang et al., 2008;
Miao et al., 2008). Through the correlation analysis, we find the grain size in the study area is negatively correlated with Al2O3 (R = −0.71, Figure 5B) and TiO2 (R = −0.69, Figure 5D),
indicating that the finer the grain size is, the higher the contents of Al2O3 and TiO2 are. Rare earth elements are negatively correlated with grain size (R = −0.79, Figure 5F), arguing that rare earth elements are mainly enriches in fine-grained sediments and depleted in coarse-grained sediments. There is no significant correlation between grain size and MnO and TOC (Figures 5C,E), and the coefficient of variation is higher, reaching 67.33 and 72.46%, respectively, which demonstrates that the grain size is not the main factor controlling the composition and distribution of MnO and TOC in surface sediments.
Negative Ce Anomaly
The δCe of surface sediments in the study area ranges from 0.5 to 1.1, with a significant negative Ce anomaly. The factors causing Ce anomaly are very complex, involving sedimentary environment, diagenesis, content of oxygen of bottom water and other factors (Pattan et al., 2005). Therefore, the interpretation and application of index of Ce anomaly must be careful. REE analysis of different types of sediments in the Indian Ocean reveals that there are positive Ce anomaly in siliceous ooze and negative Ce anomaly in calcareous sediments (Nath et al., 1992). The rare earth elements in different types of sediments in the open Pacific Ocean showed that there is clear negative Ce anomaly in sediments enrich in calcareous ooze. Toyoda et al.
(1990) suggested that the negative Ce anomaly in calcareous ooze mainly is related to the enrichment of phosphorus. No Ce anomaly was observed in the bulk sediments mainly composed of silicate (Zou et al., 2010;Zhu et al., 2012). The analysis of leaching experiment found that the positive Ce anomaly mainly occurred in Fe-Mn phase of sediments (Toyoda and Masuda, 1991), which indicated that the enrichment of Ce was closely related to Fe-Mn oxide. In general, it is believed that Ce is easily adsorbed on the surface of Fe-Mn oxide and subsequently result in Ce enrichment in Fe-Mn oxides. Under anoxic condition, Ce can be removed from the Fe-Mn oxides due to the desorption along with the dissolution of particulate Fe-Mn oxides, leading to negative Ce anomaly in sediments (Tachikawa et al., 1999).
Our REE data shows that there is strong positive correlation between CaCO3 and δCe (R = −0.90), which suggests that higher the content of CaCO3, the greater the depletion of Ce (Figure11A). The pattern of negative Ce anomaly is consistent with distribution pattern of REE in seawater (Figure 8), suggesting that the negative Ce anomaly in sediments in the study area mainly inherits the signal from seawater. No negative Ce anomaly is observed at the depth of more than 4,000 m, which proves that the contribution of calcareous materials decreases significantly and is mainly composed of terrigenous materials.
As mentioned above, the change of oxidation-reduction in sediments also has potential effects on δCe. The Mn/Fe ratio could be used to indicate the sedimentary redox condition changes. The main reason is that both these two elements have contrasting geochemical behaviors under changing redox conditions. The lower correlation coefficient between bulk sedimentary Fe2O3 and MnO (R = 0.65, Figure 11C) further corroborates this inference. The correlation analysis of MnO/Fe2O3 andδCe reveals that there is no obvious positive correlation (R=−0.10) (Figure 11B). Hence, we argue that the
FIGURE 10 |The changing trend graph of content of three modeled grain-size end members. The spatial variation in the content of EM1(A), spatial variation in the content of EM2(B)and spatial variation in the content of EM3(C).
FIGURE 11 |The scatter plots between CaCO3andδCe(A)and between MnO/Fe2O3ratio of Fe-Mn phase andδCe of bulk sediments(B)and between Fe2O3and MnO(C).
oxidation-reduction changes in surface sediments in the study area have no distinct effects onδCe.
Provenance of Sediments
The study area is far away from surrounding continents, therefore lots of terrigenous materials deposited in the open northwest Pacific Ocean mainly are delivered by eolian dust, volcanic materials, ice raft debris, and debris carried by ocean currents.
The eolian dust mainly comes from Central Asia, and the volcanism materials are mainly sourced from the surrounding island arcs, including the Kuril Islands, the Aleutian Islands, the Kamchatka Peninsula, and the volcanic arc of Alaska and Japan. The clastic components transported by sea ice and ocean
currents may also have potential contributions to the sediments in the study area.
In general, the provenance and composition of surface sediments are closely related to the characteristics of parent rocks.
The large ion lithophile elements such as Al, Fe, Ti, K, and Mg are rock forming elements, and rare earth elements are also enriched in silicate minerals. These elements are mainly concentrated in the upper crust with good symbiotic relationships, similar geochemical behavior and active geochemical properties (Wang, 2014), and as shown inFigure 6, the correlation analysis shows that there is strong positive correlation between Al2O3 and Fe2O3, TiO2, MgO, K2O, and REE (R= 0.93, 0.97, 0.98, and 0.93), respectively, which suggests that sediments in the study area contribute significantly to terrigenous detritus.
feart-09-674842 April 26, 2021 Time: 15:53 # 12
Chen et al. Surface Sediments – Emperor Seamount Chain
FIGURE 12 |Discrimination plot of the nature of parental rock of sediment provenance(A)and the scatter plot of (LREE/REE)Nand (HREE/REE)N(B), east Asian dust sources and volcanic sources refer toSerno et al. (2014).
There are multiple sources for Ca, such as aeolian dust, volcanic and biogenic contributions in bulk sediments. The content of CaCO3in the surface sediments of study area is about 47.2%, which is negatively correlated with the representative element Al (R = −0.99, Figure 6A) of terrigenous detritus, indicating that it is mainly contributed by biogenic material. As shown inFigure 3B, there is strong positive correlation between CaO and CaCO3 (R = 0.99, Figure 3B), indicating potential biogenic input. Also a strong negative correlation (R=−0.98, Figure 3C) can be observed between CaO and Al2O3, a lithogenic element, indicating little contributions of detrital materials. In terms of spatial distribution, the content of CaCO3 is less than 2% at water depth of deeper than 4,000 m, and with similar water depth, the content of CaCO3 in sediments to the north of 49.8◦N is significantly lower than that to the south of 49.8◦N.
This implies that the conditions to the south of 49.8◦N are more conducive to the preservation of calcareous organisms.
The sources of P2O5 in sediments are various, mainly consisting of rivers, atmospheric deposition and volcanic activities (Paytan and McLaughlin, 2007). Studies over the past years have suggested that the contribution of volcanic materials to phosphorus is much higher than that of input of atmospheric precipitation (Wang, 2014). Meanwhile, phosphorus from seawater is also absorbed by organisms in seawater and related to biogenic carbonate (Wang and Chen, 2011). There is a positive correlation between P2O5 and Al2O3 (R = 0.64, Figure 6G), but lower than the correlation between Fe2O3 and TiO2 and Al2O3, while the negative correlation between CaCO3and P2O5
indicates that the contribution of biogenic phosphorus may be small, mainly clastic phosphorus.
The content of MnO in sediments is affected by both redox conditions and terrestrial input. Correlation analysis of MnO and Al2O3 shows positive correlation (R= 0.67,Figure 6E), which indicates that MnO has significant terrestrial contributions in surface sediments of study area. There is also a significant positive correlation between MnO and water depth (R= 0.83), and the lower content of stations is mainly located in which is affected by
the NPIW. Modern observations have shown that the dissolved oxygen at this depth is low (Figure 1B), and therefore a part of manganese oxide may be dissolved due to lower oxygenation.
In the study area, Eu generally has significant positive anomaly with range of 1.5–4, confirming that there are significant volcanic input. The clastic surface sediments near the Emperor Seamount Chain is characterized by sediment with more radiogenic εNd values (averaging−4.4±4.3) that reflect inputs from volcanic ash (Jones et al., 2000). The content of smectite at stations near the Emperor Seamount Chain increased significantly, indicating large input of volcanic materials (Wang et al., 2016). Positive Eu anomaly occurred not only in the open Northwest Pacific Ocean, but also in the Sea of Okhotsk and the Bering Sea (Wang et al., 2016;Zhu et al., 2019). Therefore volcanic debris makes a significant contribution for marine sediments in the northwestern Pacific Ocean and its marginal seas.
The geochemical behavior of major elements can be used to trace the characteristics of parent rocks of the sediment provenance, which has been widely used in the study of determined provenance signatures (Zhu et al., 2015, 2019).
In this paper, we employ the sediments source discriminant function proposed by Roser and Korsch (1988)to identify the characteristics of provenance (Figure 12A) (Roser and Korsch, 1988). The formulation is as follows, and DF1 and DF2 mainly represent the component of felsic igneous rock source and mafic igneous rock source, respectively:
DF1=30.638w(TiO2)/w(Al2O3)−12.541w(Fe2O3)/w(Al2O3) +7.329w(MgO)/w(Al2O3)+12.031w(Na2O)/w(Al2O3) +35.402w(K2O)/w(Al2O3)−6.382
DF2=56.500w(TiO2)/w(Al2O3)−10.879w(TFe2O3)/
w(Al2O3)+ 30.875w(MgO)/w(Al2O3) − 5.404w(Na2O)/
w(Al2O3)+ 11.112w(K2O)/w(Al2O3)−3.89
The results suggest that the clastic materials in the study area are mainly volcanic materials and small amount of quartzose sediments, while the magma composition is mainly felsic magma, which is consistent with the results based on positive Eu anomaly.
On the other hand, rare earth elements have been also widely used as proxies for tracing sediment provenance, especially in the open North Pacific Ocean, where rare earth elements are considered as an effective indicator for tracing changes of eolian dust (Serno et al., 2014). Serno et al. (2014)confirmed the effectiveness of rare earth elements in tracing the dust contribution in the Subarctic Pacific Ocean based on the three independent indexes of4He,230Thxsand rare earth elements. The scatter plot of (LREE/REE)N and (HREE/REE)N (Figure 12B) shows that the composition of the surface sediments of the Emperor Seamount Chain falls into the range of two EM: volcanic and terrigenous dust, which can be regarded as a mixture of two EM. Our data further reveals that the eolian dust contribution is higher between 33◦N and 44◦N, while the volcanic materials contribution is relatively higher between 44◦N and 49.8◦N, as shown inFigure 12B.
IMPLICATIONS
At present, the main challenge in the study of paleoclimate in the Subarctic Pacific is to establish a reliable and accurate age model, which is mainly due to the lack of calcareous biogenic shells in relation with dissolution in the sediments. Our data shows that the depth of carbonate compensation is ∼4,000 m in the northwestern Pacific Ocean, and the content of CaCO3increases significantly in the sea area south of 49.8◦N. These information provides a useful reference for sampling implementation in the subarctic open Pacific Ocean.
For one thing, understanding the evolution of climate and desertification in the Asian interior and verifying the hypothesis of eolian dust and iron fertilization have been a matter of debate in paleoceanography and paleoclimate. The Emperor Seamount Chain is far away from the land, and it receives continuous deposition of large amount of eolian dust, which is a key area for reconstructing the climate and environment of Asian interior. Our research discovered that the current contribution of eolian dust to Zone I is relative higher, consistent with the present pathway of the northern westerly. For another thing, significant input of volcanic material is also prevalent in the study area. Effectively discriminating the sources from eolian dust and volcanic detrital is crucial for above research. Here, we find that some parameters related to rare earth elements are reliable proxies for distinguishing eolian dust and volcanic materials, which provides a useful tool for tracing environment and climate changes in the Asian interior.
CONCLUSION
In this study, we investigate the compositions and spatial distribution of surface sediments along the Emperor Seamount Chain with a suite of proxies, including the grain size, organic
matter, CaCO3, major and rare earth elements. The main findings can be drawn as follows:
The sediment composition varies with latitude and there are significant differences in the types and composition of sediments between 33◦N–44◦N (Zone I), 44◦N–49.8◦N (Zone II), and 49.8◦N–53◦N (Zone III) in study area. Sediments are dominated by clayey silt in Zone I and Zone III and mainly consist of sand and silty sand in Zone II. The mean grain size of sortable silt shows that the hydrodynamic condition in sea mountain area is significantly stronger than that of the abyssal plain, especially at the water depth of 1,000–2,500 m in study area. The sediments in the study area mainly include three components: terrestrial, volcanic and biogenic materials. There are evident positive correlation between Al2O3and Fe2O3, TiO2, MgO, K2O, MnO, and REE, indicating that sediments in the study area have significant contribution of terrigenous debris.
Obvious negative correlations between the content of CaCO3 and Al2O3 and positive Eu anomaly indicate contribution of biogenic and volcanic materials, respectively. The index of rare earth elements further shows that the contribution of eolian dust is higher between 33◦N and 44◦N, while the contribution of volcanic materials is higher between 44◦N and 49.8◦N. The relative contributions of terrestrial, biogenic and volcanic sources vary with latitude and water depth.
There are visible negative Ce anomalies in surface sediments of the study area, which mainly occur in areas where calcareous ooze develops. The distribution pattern of negative Ce anomaly is the same as that of REE in seawater, and has weak negative correlation with Mn/Fe. Therefore, we conclude that the negative Ce anomaly in the study area mainly inherits signal of seawater, and redox change of sediments has weak influence on negative Ce anomaly.
DATA AVAILABILITY STATEMENT
The original contributions presented in the study are included in the article/supplementary material, further inquiries can be directed to the corresponding authors.
AUTHOR CONTRIBUTIONS
XS and JZ conceived the study. JZ, ZD, KW, YW, JL, DN, and LL-J collected the samples. JC and AZ completed the experiments. JC and JZ analyzed the data and wrote the manuscript with contribution from all co-authors. All authors contributed to the article and approved the submitted version.
FUNDING
This work was supported by the National Natural Science Foundation of China (Grant Nos. 41876065 and 41476056), the National Program on Global Change and Air-Sea Interaction (GASI-GEOGE-04), and the Taishan Scholars Program of Shandong (TSQN20182117).