Crustal structure of the Kermadec arc from MANGO seismic refraction profiles
Dan Bassett1, Heidrun Kopp2, Rupert Sutherland3, Stuart Henrys4, Anthony B. Watts5, Christian Timm4, Martin Scherwath2,6, Ingo Grevemeyer2, and Cornel E. J. de Ronde4
1Scripps Institution of Oceanography, University of California, San Diego, La Jolla, California, USA,2GEOMAR Helmholz Center for Ocean Research, Kiel, Germany,3School of Geography, Environment and Earth Science, Victoria University of Wellington, Wellington, New Zealand,4GNS Science, Lower Hutt, New Zealand,5Department of Earth Sciences, University of Oxford, Oxford, UK,6Now at Ocean Networks Canada, University of Victoria, Victoria, British Columbia, Canada
Abstract
Three active-source seismic refraction profiles are integrated with morphological and potential field data to place thefirst regional constraints on the structure of the Kermadec subduction zone. These observations are used to test contrasting tectonic models for an along-strike transition in margin structure previously known as the 32°S boundary. We use residual bathymetry to constrain the geometry of this boundary and propose the name Central Kermadec Discontinuity (CKD). North of the CKD, the buried Tonga Ridge occupies the fore-arc withVP6.5–7.3 km s 1and residual free-air gravity anomalies constrain its latitudinal extent (north of 30.5°S), width (110 ± 20 km), and strike (~005° south of 25°S). South of the CKD the fore-arc is structurally homogeneous downdip withVP5.7–7.3 km s 1. In the Havre Trough back-arc, crustal thickness south of the CKD is 8–9 km, which is up to 4 km thinner than the northern Havre Trough and at least 1 km thinner than the southern Havre Trough. We suggest that the Eocene arc did not extend along the current length of the Tonga-Kermadec trench. The Eocene arc was originally connected to the Three Kings Ridge, and the CKD was likely formed during separation and easterly translation of an Eocene arc substrate during the early Oligocene. We suggest that thefirst-order crustal thickness variations along the Kermadec arc were inherited from before the Neogene and reflect Mesozoic crustal structure, the Cenozoic evolution of the Tonga-Kermadec-Hikurangi margin and along-strike variations in the duration of arc volcanism.1. Introduction
The Tonga-Kermadec subduction zone is the most linear, fastest converging [Isacks et al., 1968;Bevis et al., 1995], and most seismically active [Sykes, 1966] subduction zone with the highest density of arc-volcanic cen- ters on Earth [de Ronde et al., 2003]. In contrast to the apparent structural homogeneity of the Tonga arc [Lonsdale, 1986;Austin et al., 1989;W.C.Crawford et al., 2003;Contreras-Reyes et al., 2011], marine geophysical and geochemical data have demonstrated systematic along-strike transitions in the structure of Kermadec fore-arc [Collot and Davy, 1998;Davy and Collot, 2000], back-arc [Delteil et al., 2002;Wright et al., 2006], and the location, character, and chemistry of the volcanic arc [de Ronde et al., 2001, 2007;Timm et al., 2014].
One well studied boundary occurs midway along the Kermadec margin at 32°S [Pelletier and Dupont, 1990]
where, from north to south, the remnant Lau-Colville and active Kermadec arc ridges narrow by>50%, the back-arc and fore-arc deepen by ~1 km, and the active volcanic arc is deflected west into the deepest known back-arc basin (Figure 1). The origin and direction of causality between these coincident transitions is not clear and a relevant question considered in this study is: Do transitions in margin structure reflect; (a) the recent (<~5 Ma) mechanical behavior of the subduction interface, (b) the Cenozoic tectonic evolution of the Tonga-Kermadec subduction zone, and/or (c) the influence of variable subducting Pacific plate structure on shallow subduction mechanics, tectonics, and arc volcanism? We address this question by integrating three seismic refraction profiles with morphological and potential-field data to place the first regional constraints on crustal structure along the Kermadec arc.
Convergence between the Pacific and Australian plates began at circa 45 Ma [Sutherland, 1999;Meffre et al., 2012] and since at least 5 Ma the plate boundary has been close to its present position along the Hikurangi- Kermadec-Tonga trench (Figure 1). Tectonic models of the intervening period are generally characterized by the eastward rollback of the Pacific plate creating a series of extensional basins, plateaus, and remnant or extinct volcanic arcs [Kroenke and Rodda, 1984;Schellart et al., 2006;Mortimer et al., 2007;Herzer et al., 2011].
One prominent structure, the Tonga Ridge, is strongly expressed in the bathymetry of the Tonga fore-arc and
Journal of Geophysical Research: Solid Earth
RESEARCH ARTICLE
10.1002/2016JB013194
Key Points:
•Three seismic refraction profiles constrain the crustal structure along the Kermadec arc
•The north Kermadec fore-arc hosts the Eocene Tonga arc. Back-arc crustal thickness is 4 km thinner south of the Central Kermadec Discontinuity
•Along-strike transitions in crustal structure are inherited and reflect the Cenozoic evolution of the Tonga- Kermadec margin
Supporting Information:
•Supporting Information S1
Correspondence to:
D. Bassett, dbassett@ucsd.edu
Citation:
Bassett, D., H. Kopp, R. Sutherland, S. Henrys, A. B. Watts, C. Timm, M. Scherwath, I. Grevemeyer, and C. E. J. de Ronde (2016), Crustal structure of the Kermadec arc from MANGO seismic refraction profiles, J. Geophys. Res. Solid Earth, 121, 7514–7546, doi:10.1002/2016JB013194.
Received 19 MAY 2016 Accepted 23 AUG 2016
Accepted article online 26 AUG 2016 Published online 10 OCT 2016
©2016. American Geophysical Union.
All Rights Reserved.
Figure 1.Bathymetric map displaying the regional tectonic setting of the Tonga-Kermadec subduction zone [IOC et al., 2003]. Arrows show long-term motion of the Pacific plate relative to afixed Australian plate [DeMets et al., 2010].
Louisville Ridge seamount ages are fromKoppers et al. [2012]. Red triangles show known locations of Holocene volcanic centers [Wright et al., 1996;de Ronde et al., 2001;Simkin and Siebert, 2002;Wright et al., 2006;de Ronde et al., 2007]. Lines (labeled in grey) show seismic reflection/refraction profiles with Black signifying the MANGO profiles analyzed in this study.
The South Fiji Basin is west of the Lau/Colville Ridge and is structurally subdivided by a rougher and shallower Central Ridge into the Minerva and Kupe Abyssal Plains. Annotations: NP = Northland Plateau; RR = Raukumara Ranges; RB = Raukumara Basin; ECR = East Cape Ridge; TVZ = Taupo Volcanic Zone; R = Mt Ruapehu, SD = Scholl Deep; and HD = Horizon Deep.
Journal of Geophysical Research: Solid Earth
10.1002/2016JB013194gravity data derived during the Geosat altimeter mission suggest its buried southward extension may extend into the northern Kermadec fore-arc (Figure 1). There is no evidence for the Tonga Ridge (buried or other- wise) south of 31°S, but it is not clear whether this latitudinal extent reflects the tectonic evolution of the arc and back-arc or more recent mechanical processes influencing its preservation within the fore-arc.
Pacific plate structure clearly influences subduction dynamics along the Hikurangi margin and at the junc- tion of the Kermadec and Tonga segments of the arc [Collot and Davy, 1998;Davy and Collot, 2000]. The early Cretaceous Hikurangi Plateau is a large igneous province (LIP) with crustal thickness of 10–23 km [Reyners et al., 1999;Henrys et al., 2006;Davy et al., 2008;Scherwath et al., 2010], and subduction of this anomalously thick crust along the Hikurangi margin has been causally related with subaerial exposure of the fore-arc along the East Coast of North Island, New Zealand [Davy and Wood, 1994;Davy et al., 2008].
Farther north near 26°S, the margin is impacted by the Louisville Ridge seamount chain. [Timm et al., 2013;Bassett and Watts, 2015a;Stratford et al., 2015]. Assuming the unsubducted ridge geometry is main- tained, the zone of seamount subduction has been suggested to migrate south at rates up to 180 km Myr 1 [Lonsdale, 1986] and modulate a range of geological and tectonic phenomena including the rates and directions of tilting, subsidence and erosion of fore-arc crust [Clift, 1994; MacLeod, 1994; Clift and MacLeod, 1999], and the transition in the kinematics of back-arc extension between the Havre Trough and Lau Basin [Ruellan et al., 2003]. Previous interpretations have proposed that variable subducting plate structure during the Neogene is the key factor producing along-strike variations in crustal structure [Collot and Davy, 1998;de Ronde et al., 2007;Timm et al., 2014].
This manuscript describes the structure of the Kermadec subduction margin as constrained by three wide- angle seismic refraction profiles and the application of spectral averaging routines to regional grids and bathymetry and free-air gravity anomalies. We constrain the latitudinal extent of the Tonga Ridge, the geo- metry of the 32°S boundary, and place potential-field constraints on the density structure of the mantle wedge. These observations allow us to discriminate between the evolutionary models described above.
2. Geological Setting
The Hikurangi-Kermadec-Tonga subduction zone marks the boundary between the Australian and Pacific plates (Figure 1). Relative plate motion, according to the MORVEL model [DeMets et al., 1994, 2010], increases from highly oblique convergence at 42 mm/yr in the South Hikurangi margin to less oblique convergence at 82 mm/yr in North Tonga. Rates of back-arc rifting/spreading increase south to north from ~0 mm/yr near Mount Ruapehu at the southern tip of the Taupo Volcanic Zone (TVZ) to ~50 mm/yr in the Southern Havre Trough and ~160 mm/yr in the northern Lau Basin, contributing to the fastest subduction rates on Earth [Karig, 1970;Bevis et al., 1995].
2.1. Structure of the Fore-Arc and Subducting Pacific Plate
The northern Hikurangi margin is characterized by margin parallel transitions in crustal structure in both the Australian fore-arc and subducting Pacific plates (Figure 1). In the fore-arc, the anomalously high topography of the Raukumara Ranges (RR) [Walcott, 1987] transforms northeast along strike into the deep (<10 km sedi- ment thickness,>2 km water depth) Raukumara Basin (RB) [Sutherland et al., 2009]. Moho depth beneath the western Raukumara Peninsula is>25 km [Reyners et al., 1999]. By contrast, the Raukumara Basin isfloored by 5–8 km thick crust and the fore-arc Moho shallows from ~17 km within the central basin to<12.5 km within the Havre Trough,<15 km within the northern Raukumara Plain and 10–15 km near the East Cape Ridge [Bassett et al., 2010].
The structure and seismic stratigraphy of the Raukumara Basin is described and correlated with onshore geol- ogy bySutherland et al. [2009]. The basin contains one of the thickest (i.e., 5–8 km) sequences of Late Cretaceous and Paleogene passive margin sediments in New Zealand (Megasequence X), a ~10,000 km3sub- marine landslide emplaced west or northwestward (Megasequence Y) and a Neogene subduction margin megasequence (Megasequence Z).Sutherland et al. [2009] interpret the basin stratigraphy as an east verging thrust wedge and suggest that the western part of Raukumara basin preserves the Cretaceous Gondwana trench slope. Paleomagnetic declination anomalies show that the Raukumara Peninsula has rotated with the Australian plate since 22–19 Ma [Roberts, 1992;Rowan and Roberts, 2005, 2008].
On the subducting Pacific plate, the Rapuhia Scarp (Figure 1) marks the northern boundary of the Hikurangi Plateau LIP and a transition to Mesozoic oceanic crust [Davy and Wood, 1994;Davy et al., 2008]. Immediately north of this scarp, the Kermadec trench deepens from<6.0 to>8.0 km and the trench slope break migrates 20–35 km nearer the Kermadec Ridge (Figures 2a and 2b) [Davy and Collot, 2000]. The shallow near-trench gra- dient (~1.5°), greater fore-arc water depth between 35°S and 32°S, and a ~40 km wide lower slope terrace extend- ing to ~31°S have all been linked to tectonic erosion associated with Hikurangi plateau subduction [Davy and Collot, 2000]. The Kermadec trench is deepest near 32°S and reaches ~10 km at Scholl Deep (Figure 2b).
Between 31°S and 25°S, the trench is ~9 km deep, the fore-arc is ~150 km wide and has a mean trench-slope gradient of ~7° within 35 km of the trench-axis and<2° east of the Kermadec Ridge. Regional gravity grids derived from satellite altimetry [Sandwell and Smith, 2009] show the Tonga Ridge occupying the inner fore-arc. The gravity anomaly associated with the Tonga Ridge has not been recognized south of ~31°S and the increase in fore-arc water depth near this latitude is interpreted byCollot and Davy[1998] as marking the northern boundary of tectonic erosion associated with Hikurangi Plateau subduction (Figure 2b).
The Louisville Ridge collision zone (27°S–24.5°S) is characterized by a 3 km reduction in trench depth, a 15°
anticlockwise rotation of the trench-axis, a 20% reduction in the width of extensional bend faulting in the Figure 2.Along-strike variations in margin structure. (a) Map showing the simplified physiography of the Kermadec margin. Red triangles and dashed line show arc volcanoes and the arc front respectively. Solid red line outlines Raukumara Basin (RB). RR = Raukumara Ranges and East Cape R = East Cape Ridge. (b) Water depth along the trench (Black) and fore-arc trench-slope equidistant between the trench and arc (Grey). (c) Water depth along the Lau/Colville (grey) and Kermadec (black) ridges. Horizontal bars show ridge width. (d) Water depth in the Havre Trough back-arc basin. (e) Mean spacing (black) [de Ronde et al., 2007] and basal water depths (grey) [Wright et al., 2006] of arc volcanic centers.
Journal of Geophysical Research: Solid Earth
10.1002/2016JB013194subducting Pacific plate and a rough, hummocky fore-arc on the overthrusting Australian plate [Bassett and Watts, 2015a;Stratford et al., 2015]. 250 kilometers north of the contemporary collision zone, Horizon Deep (water depth ~10.8 km) has been associated with tectonic erosion and extensional collapse of the fore-arc in the wake of seamount subduction (Figure 1) [Lonsdale, 1986;Ballance et al., 1989].
In contrast to the segmented character of the Kermadec fore-arc, the Tonga fore-arc appears from available data to be largely homogeneous along strike and is occupied by the Tonga Ridge at least as far north as 18.5°S (Figure 1) [Lonsdale, 1986;Austin et al., 1989; W.C.Crawford et al., 2003; Contreras- Reyes et al., 2011].
2.2. Structure and Character of the Kermadec Arc and Back-Arc
Along the Kermadec margin, systematic changes in the location, character, and chemistry of the volcanic arc have been recognized and correlated with coincident changes in margin structure [Wright, 1997;Ballance et al., 1999;Wright et al., 2006;Timm et al., 2013, 2014]. South of 35°S and west of the Raukumara Basin, the Havre Trough is ~150 km wide. Average water depth is between 2 and 2.5 km but locally exceeds 3 km in the Ngatoro Rifts (Figure 2d). The bounding Kermadec and Colville Ridges are generally weakly expressed,
≤30 km wide with elevations<1 km relative to the Havre Trough (Figures 2c and 2d). Swath mapping has revealed at least 13 volcanic edifices, which have a mean spacing of 30 km and include basaltic-andesitic stra- tovolcanoes and silicic calderas with basal water depths typically≤2.5 km (Figure 2e) [Gamble and Wright, 1995;Wright and Gamble, 1999;de Ronde et al., 2007].
Between ~32°S and 34°S, the Colville and Kermadec Ridges remain narrow (width<40 km) but increase in mean elevation to 1.5–2.0 km above the Havre Trough. This is the deepest segment of the Havre Trough (Figure 2d).
Mean water depth is>3.0 km and locally exceeds 3.7 km in sediment starved rift basins [Delteil et al., 2002].
Back-arc extension is distributed across the Havre Trough, but shallow seismicity [Pelletier and Louat, 1989] and volcanism [Wright, 1994] suggest that recent tectonism is focused near the contemporary volcanic arc. Rift fabric is oblique (~20° clockwise) to the back-arc basin axis [Wright et al., 1996;Delteil et al., 2002]. Arc volcanic centers have a mean spacing of 45 km, basement elevations>3.0 km below sea level (Figure 2e), and are predominately stratovolcanic cones of low-K series basalt and basaltic andesite [Wright et al., 2006;de Ronde et al., 2007].
At 32°S the arc front is offset 15–25 km toward the trench, coincident with a>1 km shoaling in the mean back-arc water depth and a factor of ~2 increase in the width of remnant and active arc ridges (Figure 2) [Pelletier and Dupont, 1990;Collot and Davy, 1998;Wright et al., 2006;de Ronde et al., 2007;Wysoczanski et al., 2010]. North of 32°S, the Kermadec Ridge is at least 1 km high (relative to the back-arc) and 60 km wide. The Lau Ridge is>1.5 km high and>75 km wide (Figure 2c). The Havre Trough is shallow (~2.5 km) and variably sedimented within perched and rifted subbasins in the west and composed of rugged, high standing (~2 km), and sediment starved volcanic basement in the east [Delteil et al., 2002].
Between 29°S and 32°S, merging of the active arc front with the Kermadec Ridge increases the pre- dominance of caldera volcanoes with the mean spacing of volcanic centers extending to 58 km [de Ronde et al., 2003].
Silicic and bimodal volcanism is restricted to arc segments where basal water depths are shallower than 2.7 km and typically 1.5–2.5 km (Figure 2e) [Wright et al., 2006]. Predominantly basalt and basaltic andesite has been recovered from the deeper central Kermadec arc, where volcanic edifices have basal water depths
≥3.0 km. Mean constructional volumes for deeper (≥3.0 km;n= 7) volcanic edifices are 140 km3, which is a fac- tor>2 larger than the mean constructional volume (55 km3) for edifices with shallower basal water depths [Wright et al., 2006].de Ronde et al. [2007] demonstrate systematic variations in the mean spacing of volcanic centers between the southern, central, and northern segments of the Kermadec arc (Figure 2e). They also show that the intensity of hydrothermal activity is more subdued in the deeper central segment of the Havre Trough.
3. Data
3.1. Active-Source Seismic Profiles
This manuscript is focused on wide-angle seismic profiles acquired across the Kermadec arc on board the R/V SONNEas part of the MANGO (Marine Geoscientific Investigations on the Input and Output of the Kermadec subduction zone) project [Flueh and Kopp, 2007]. The southernmost profile (M1) is presented inScherwath
et al. [2010], and this manuscript presents results from the three profiles (M2, M3 and M4) farther north (Figure 1). Profiles M1–M4 are joint Multi Channel Seismic (MCS) reflection and wide-angle seismic refraction profiles acquired in March 2007 (SO192-1). MCS data were acquired using a short (<200 m) 16 channel streamer provided by GNS Science. Wide-angle data were recorded by GEOMAR Ocean Bottom Seismographs/Hydrophones (OBS/H) spaced 6–7 km apart. The seismic source comprised eight Sercel G-Guns arranged in two four-gun subarrays with a combined volume of 64 L andfired at 3000 psi with a 60 s (~150 m at 4.5 knots) shot interval.
Wide-angle data were processed using gated Wiener deconvolution (gate 3 s, overlap 1 s, operator length, 1 s) and frequencyfiltering (ramp frequencies 2–5 and15–30 Hz). The collective data set comprised 116 recei- ver gathers resulting in>235,000 travel time interpretations. The degree of precision in interpreted arri- vals ranges from 50 ms to 250 ms depending on noise levels and relationships to overlapping arrivals. The vast majority of arrivals have a precision of<100 ms. Examples of wide-angle data acquired along each profile are presented in Figure 3. Additional examples of receiver gathers interpreted arrivals and Figure 3.Wide-angle seismic data along profiles (a) MANGO 4 (M4), (b) MANGO 3 (M3), and (c) MANGO 2 (M2). Top panel shows water depth, station locations (triangles), and the distribution of shots shown in the receiver gathers below. Bottom panels show examples of wide-angle seismic data and interpreted phases. Record sections, interpretations, and associated raypaths for OBS/H marked by yellow triangles are shown in the supporting information.
Journal of Geophysical Research: Solid Earth
10.1002/2016JB013194associated raypaths for OBS/H marked by yellow triangles are shown in the supporting information Figures S3, S6, and S9.
4. Forward Velocity Modeling
4.1. Model Construction
Forward layeredPwave velocity (VP) models were constructed using the ray tracing and travel-time inversion method ofZelt and Smith [1992]. We adopted the same forward modeling methodology applied in the Louisville collision zone [Stratford et al., 2015] and southern Kermadec arc [Scherwath et al., 2010] to allow direct comparison of crustal sections along strike.
Layered seismic velocity models are constructed by linearly interpolating vertically and horizontally between VPnodes positioned on layer boundaries. The water layer is defined from swath bathymetric data and by the travel times of the direct arrival and seafloor multiple. Wide-angle refracted arrivals with offsets of≤30 km are used to define shallow fore-arcVPstructure. Refracted arrivals at greater offsets turning within the crust (Pg) and mantle (Pn), and wide-angle reflections from the Moho (PmP) then constrain the deeper structure of the
Figure 3.(continued) b) Wide-angle seismic data along profile MANGO 3 (M3).
fore-arc, the geometry of the Moho, andVPin the mantle wedge. Refractions through the Pacific plate and wide-angle reflections from the top and Moho of the Pacific plate constrain the geometry and seismic velocity structure of the subducting slab.
4.2. Model Limitations and Fit to Data
At the conclusion of forward modeling, outstanding travel time residuals are minimized by performing a damped least squares optimization [Lutter et al., 1990;Zelt and Smith, 1992]. The optimization was performed until the updated model failed anFtest (95% level) comparing the chi-square (χ2) value with that of the previous model.
The uncertainty inVPis estimated by applying velocity perturbations in the form of alternating 40 km wide vertical stripes ofVP± 0.4 km s 1to thefinal optimized model (see supporting information Figures S2, S5, and S8). Following the same procedure implemented to minimize travel time residuals, a damped least
Figure 3.(continued) c) Wide-angle seismic data along profile MANGO 2 (M2).
Journal of Geophysical Research: Solid Earth
10.1002/2016JB013194squares optimization is performed using the perturbed starting model and original travel time observations until theFtest of model significance is failed. The difference between thefinal optimized and perturbed models illustrates the degree to which thefinal optimized model is recovered and provides a broad spatial estimate of uncertainty inVP.
The travel time through the shallowest two layers (both Pacific and Australian plates) is constrained by the total travel times of all refracted arrivals but poorly constrained by internal turning rays. These surficial layers are therefore excluded from this uncertainty analysis, which showsVP in most of the crust away from model end points to be constrained within ±0.1 km s 1 (supporting information Figures S2, S5, and S8). We observe a monotonic and approximately exponential reduction in RMS andχ2 throughout the perturbed optimization and note a strong correlation between regions of high-ray density and regions where the optimized velocity model is well recovered (see supporting information). We consider regions where thefinal optimized and perturbed models differ by>0.2 km s 1 or have<20 rays within a 500 m search radius to be unconstrained and we apply a grey mask to differentiate these model regions.
This analysis is highly sensitive to the lateral distribution of velocity nodes. Although locally increased in regions of high horizontal velocity gradients, node spacing is ~20 km and approximately 3 times the station distribution. The horizontal resolution of these velocity models is thus limited by the distribution of velocity nodes to a range almost certainly below the full horizontal resolution given the source receiver geometry. Our objective, however, is to resolve the broad architecture of the plate margin and we are confident the large structures we interpret (20–>100 km in width) are below the horizontal resolution of both the data and model parameterization, as is confirmed by model recovery tests.
5. Results
Forward models of the seismic velocity structure along wide-angle profiles M4, M3, and M2 are presented in Figures 4–6. The data constraining these models, interpreted arrivals, and raypaths through the model for stations marked by yellow triangles are shown in the supporting information Figures S3, S6, and S9.
5.1. North-Kermadec Transect: MANGO 4
Profile M4 is dip parallel and traverses the northern Kermadec margin ~400 km south of the Louisville collision zone (Figure 1). This profile is 488 km long, extending 100 km across the Pacific plate and across the full width of the fore-arc, arc, and Havre Trough back-arc on the Australian plate. A 43 km gap in OBS/H deployments is present where the trench depth exceeded 6000 m and 57 OBS/H recorded data suita- ble for seismic modeling.
Seaward of the trench, the crust of the Pacific plate is modeled as a single layer 6 ± 1 km thick with VP 6.0–7.2 km s 1, overlain by ~1 km of lower velocity (VP1.9–5.0 km s 1) strata (Figure 4b). The thickness of the crust and geometry of the Moho are well constrained by wide-angle reflections and refracted arrivals turning below the Moho with reversed offsets up to 70 km (Figure 3a, #96). The Pacific plate mantle is char- acterized byVP7.5–7.6 km s 1, but this is reduced by ~0.2 km s 1within 50 km of the trench-axis where seafloor roughness increases and horst and graben structures offset the seabed. A horst block seaward of the trench is ~15 km wide,flanked by 7–8 km wide and>1.5 km deep grabens. Exposed fault scarps are>2.8 km long and dip 29 ± 2°. The graben defining the trench-axis has an eastern fault scarp>3.5 km long with 1.8 km of throw. Wide-angle reflections constrain the geometry of the subducting Pacific plate to ~25 km depth. The Pacific plate dips ~8° between the trench and ~19 km depth, where slab dip increases to 18°. This kink is just below the subducting slab-fore-arc Moho intersection and occurs ~10 km arcward of the transition in seismic structure and trench slope gradient separating the inner trench slope from the outer fore-arc. Wide-angle reflections are predominantly unreversed so this geometry may vary by several degrees.
The outer fore-arc has a surface gradient of 5–6° within 40 km of trench-axis and intermediate crustal velo- cities (5.0–5.5 km s 1) are capped by 1–2 km of lower velocity (VP 1.9–4.5 km s 1) strata (Figure 4b).
Refracted raypaths turn within 5 km of the seabed, and the crust directly overlying the subduction interface is only sampled by wide-angle reflections and Pn refractions turning within the Pacific plate (Figure S1). The outer fore-arc contains at least two bathymetric and crustal ridges, separated by 7–8 km wide basins containing thicker (factor≥2) sedimentary sequences. These structures may reflect the surface
expression of subducting horst and grabens, but resolution in the subducting crust is insufficient to iden- tify these structures at depth.
The inner fore-arc is characterized by a shallow 1.7° trench-slope gradient, an east-west increase in the thickness of low-velocity sediments and a significant increase lower crustalVP(Figure 4b). Surficial sedi- ments (VP1.9–4.3 km s 1) thicken east to west from 1.5 to 3.8 km and are underlain by a farther 2–3 km of strata withVP 4.5–5.5 km s 1forming an asymmetric seaward tilted basin. Lower crustal velocities are inversely correlated with the thickness of basinfill and crustal wavespeeds reach the shallowest depth and are fastest (6.5–7.3 km s 1) in the east, generating steep horizontal velocity gradients between the inner and outer fore-arc.
The geometry of the Moho and mantle wedgeVPis constrained by wide-angle reflections andPnrefractions with reversed offsets of 50–100 km (Figure S3g). Moho depth increases from 14.5 km beneath the volcanic arc to ~17 km at its junction with the subducting slab. The Moho appears locally elevated beneath the region of highest lower crustal velocities, but this geometry is uncertain. The mantle wedge constrained by reversedPn indicatesVPof 7.8–8.0 km s 1.
Along M4 the active volcanic arc is coincident with the Kermadec Ridge (150–185 km from the trench-axis).
The ridge is well sampled by numerousPgphases supporting a reduction in the thickness of surficial low- Figure 4.(a) Free-air gravity anomaly (red line) observed along Profile M4. Solid black line shows the free-air gravity anomaly calculated from the seismic velocity model above 18 km depth with the grey dash showing the calculated anomaly incorporating contributions from the subducting slab and mantle wedge. (b) Dip- parallel seismic velocity (VP) structure along Profile M4. Solid (dotted) black lines distinguish regions where crustal interfaces are (are not) constrained by wide- angle reflections. Transparent mask shows regions unconstrained by refracted raypaths or withVPuncertainty>0.2 km s 1. Solid grey mask defines the limits of full ray coverage. Numbers givePwave velocities in km s 1. Ocean Bottom Seismographs are marked by triangles. Large red triangle marks the volcanic arc.
Record sections, interpretations, and associated raypaths for OBS/H marked by yellow triangles (station numbers labeled) are shown in the supporting infor- mation Figure S3. Annotations: KT = Kermadec Trench; PAC = Pacific Plate; and AUS = Australian Plate.
Journal of Geophysical Research: Solid Earth
10.1002/2016JB013194velocity (VP1.9–4.2 km s 1) strata and elevated crustal velocities. Between 2 and 5.5 km depth,VPis 4.7– 6.0 km s 1and approximately 1 km s 1faster than adjacent regions at equivalent depth (Figure 4b). The lower crust hasVP6.1–7.2 km s 1. We do not resolve any variation in Moho depth beneath the arc, which is ~14.5 km. Mantle wedgeVPis ~8.0 km s 1but is 0.2 km s 1slower over a 100 km wide region west of the arc front.
The structure of the Havre Trough back-arc basin can be centrally divided into two ~75 km wide domains. In the eastern segment, sediments (VP1.9–4.3 km s 1) increases in thickness from 1 km near the western seg- ment margin to ~2 km within a 25 km wide basin west of the volcanic arc. Iso-velocity contours dip 1–2°
toward the arc front and crustal velocities are similar to those resolved beneath the arc. The Moho dips
~1° east, increasing in depth from ~13.5 to 15 km. Refractions turning within the mantle wedge (Pn) are inter- preted across this segment (Figure S3k), but these are not widespread and are often unreversed and asso- ciated with larger uncertainties (up to 200 ms). VP within the mantle wedge is ~7.8 km s 1. Seafloor morphology is rough and blocky, characterized by a deep, steep-sided basin in the east and at least 5 small (>5 km × 500 m), pointed bathymetric highs in the west, which likely represent volcanic cones.
The western segment of the Havre Trough is defined at shallow depth by three ~1.5 km deep ~20 km wide basins. The majority of basinfill hasVP1.9–2.3 km s 1and the comparatively low signal-to-noise ratio of data across the western Havre Trough may reflect high attenuation of basin infill (Figures S3m and S3n). Basins are separated by three 1–1.5 km structural highs that persist in the seismic velocity structure to at least 6 km Figure 5.(a) Free-air gravity anomaly (red) observed along Profile M3. Solid black line shows the free-air gravity anomaly calculated from the seismic velocity model above 23 km depth with the grey dash showing the calculated anomaly incorporating contributions from the subducting slab and mantle wedge. (b) Dip-parallel seismic velocity (VP) structure along Profile M3. Figure nomenclature as in Figure 4b. Record sections, interpretations, and associated raypaths for OBS/H marked by yellow triangles (station numbers labeled) are shown in the supporting information Figure S6.
depth. The easternmost high defines the eastern segment margin. The lower crust hasVP6.0–7.0 km s 1. The Moho beneath the western Havre Trough is planar and ~12.5 km deep. This geometry is predominantly con- strained by wide-angle reflections, but it is also consistent withPnrefractions recorded near the segment margins.VPwithin the mantle wedge is 8.1 km s 1. The western Havre Trough is ~300 m deeper than the east- ern segment, and back-arc structures are completely blanketed by lowVPsediments.
The Lau Ridge is a>35 km wide asymmetric structural high withVP 1.9–5.6 km s 1within 3.5 km of the seabed. The eastern ridgeflank dips 15° east along a ~10 km long scarp, which defines the western margin of a sedimentary basin and the Havre Trough. The western ridgeflank dips ~5° west, sediment thicknesses increase east to west, andVPin the middle and lower crust is similar to the eastern Havre Trough. We do not seismically resolve any change in Moho depth beneath the Lau Ridge, but resolution near profile end points is low and we note than an increase in crustal thickness would improve the fit with observed gravity anomalies.
The velocity model for M4 is constrained by ~52,000 arrivals andfits these observations with RMS mis- fit = 0.103 s (Figure 7a).
5.2. Central-Kermadec Transect: MANGO 3
Profile M3 is dip parallel, 238 km long with 30 OBS/H deployed across the inner fore-arc, and the eastern 100 km of the Havre Trough back-arc (Figure 1). Although shooting started ~30 km from the trench-axis, Figure 6.(a) Free-air gravity anomaly (red) observed along Profile M2. Solid black line shows the free-air gravity anomaly calculated from the seismic velocity model above 20 km depth with the grey dash showing the calculated anomaly incorporating contributions from the subducting slab and mantle wedge. (b) Dip-parallel seismic velocity (VP) structure along Profile M2. Figure nomenclature as in Figure 4b. Record sections, interpretations, and associated raypaths for OBS/H marked by yellow triangles (station numbers labeled) are shown in the supporting information Figure S9.
Journal of Geophysical Research: Solid Earth
10.1002/2016JB013194the fore-arc east of OBS/H 89 is only constrained by unreversed refractions and wide-angle reflections there- fore the outer fore-arc is not well constrained (Figure 5a).
The inner fore-arc has a mean surface gradient of 2.5° and, in contrast to profile M4, is structurally homoge- neous east of the Kermadec Ridge. Within 2 km of the seabed, sediments haveVP1.9–3.5 km s 1and are underlain by 1.5–2 km of strata withVP3.6–5.0 km s 1. Crustal wave speeds increase from 5.7 to 7.3 km s 1. Moho geometry and mantle wedgeVPare constrained by wide-angle reflections and by refracted arrivals with reversed offsets of up to 170 km (Figures 3b #60, S6a, and S6d). The Moho is planar at ~16 km depth and the mantle wedge hasVP7.7–7.8 km s 1. The subducting Pacific plate is only constrained geometrically by wide-angle reflections and is modeled withVP6.0–7.2 km s 1(from profile M4), ~6 km thickness and a dip of 17°. This dip may vary by several degrees as reflections are unreversed.
The Kermadec Ridge is characterized by a reduction in the thickness of surface sediments andVPincreases to 4.3 km s 1within 2 km of the seabed. The upper crust is 3 km thick withVP4.6–5.8 km s 1. In the lower crust, VPincreases from 6.0 to 7.2 km s 1and lower crustal velocities occur at<6 km depth within two 15 km wide regions beneath the eastern and western ridge flanks, which are separated by a region of lower (by≥0.4 km s 1) velocity (Figure 5b).
In the eastern Havre Trough up to 1.5 km of sediment (1.9–3.3 km s 1) has accumulated in a 20 km wide ridge-flanking basin. M3 intersects the arc front ~190 km from the trench-axis, but this intersection is
~20 km south of the nearest active volcano (Haungaroa) and the arc front is not strongly expressed bathyme- trically or in the seismic structure. In the middle crustVPincreases from 5.3 to>7.0 km s 1andVPlocally exceeds 7.3 km s 1where the crust is thinnest immediately west of the Kermadec Ridge. Moho geometry and upper mantle VP are constrained by reversed Pnrefractions and by limited wide-angle reflections (Figures 3b, S6a, and S6d). These arrivals suggest a sharp reduction in Moho depth from 16.5 km beneath the Kermadec Ridge to<12 km beneath the eastern Havre Trough, although the precise geometry of this transition is uncertain.VPin the arc/back-arc mantle is ~7.8 km s 1.
The central Havre Trough is characterized by a reduction in both the thickness of surface sediments and lower crustal velocities (6.1–7.3 km s 1). VP exceeds 6.0 km s 1 within 2 km of the seabed at the western end of the profile, but refracted arrivals are limited to <10 km depth and the lower crust is poorly constrained. The Moho is planar at ~12.5 km depth, approximately 1 km deeper than the eastern Havre Trough.
The velocity model for M3 is constrained by ~32,000 travel times andfits these observations with RMS misfit = 0.113 s (Figure 7b).
5.3. Central-Kermadec Transect: MANGO 2
Profile M2 is dip parallel, 281 km long, and traverses the central Kermadec margin between 34 and 35°S (Figure 1). 30 OBS/H were deployed 45–240 km from the trench-axis constraining most of the fore-arc, arc, and the eastern Havre Trough (Figure 6b).
The outer fore-arc has a mean gradient of 2.2° and ~1 km of surface sediment with VP 1.9–3.9 km s 1. Crustal velocities within 40 km of the trench-axis are not well constrained, but unreversed refractions recorded by the two easternmost OBS/H suggestVPincreases to ~4.4 km s 1 within 2 km of the seabed.
Crustal velocities 45–75 km from the trench-axis are approximately 0.6 km s 1 faster than the region nearer the trench, andVPincreases from 4.9 to 5.9 km s 1between 2 and 7 km below the seafloor.
The geometry of the subducting slab is constrained by wide-angle reflections and dips 14° between 10 and 23 km depth and 21° between 23 and 40 km depth (supporting information Figures S7 and S9a).
Refractions turning within the Pacific crust are not observed, but Moho reflections (PmP) andPnrefractions suggest a crustal thickness of 6 km when modeled using crustal velocities resolved along M4. Unreversed Pnrefractions from one OBS/H suggestVP in the Pacific mantle is 7.8 km s 1.
The inner fore-arc has a mean surface gradient of 0.5° and is characterized by a central basin bounded by fore-arc ridges. The eastern ridge (labeled in Figure 6b) is ~25 km wide and crustal velocities exceed 6.3 km s 1 within 3.5 km of the seabed. Sedimentary sequences thicken west of this ridge and at least 2.5 km of sediment (VP1.9–3.4 km s 1) has accumulated in the central depocenter. Shallow sedimentary
sequences are underlain an additional 1.5 km thick layer withVP4.2–4.4 km s 1, which may increase the thick- ness of basinfill to 4.5 km. The thickness of the upper crust (VP5.2–5.5 km s 1) is inversely correlated with basin thickness, below whichVPincreases with decreasing gradient from 6.3 to ~6.8 km s 1. The lower crust is 4 km thick withVP7.2–7.3 km s 1. The Moho is constrained byPnrefractions beneath the central basin and limited wide-angle reflections and appears to shallow from 16.5 km beneath the Kermadec Ridge to 15.5 km at the trench-slope break (Model km 190).VPin the mantle wedge is 8.0 km s 1, but wide-angle reflections suggest this may reduce by 0.3–0.6 km s 1within 40 km of the mantle wedge corner.
The Kermadec Ridge is structurally and morphologically asymmetric. The eastern ridgeflank dips ~4° east, iso-velocity contours parallel the seabed from the central basin andVPis<3.8 km s 1within 1.5 km of the seabed. By contrast, the western ridgeflank dips 12°, sedimentary cover is less than 500 m thick and crustal wave speeds (VP>5.0 km s 1) reach the shallowest depth within a 10 km wide dome between the ridge crest and western scarp.
The active arc is located in the eastern Havre Trough and M2 traverses the caldera volcano Sonne [Haase et al., 2002] 210 km from the trench-axis. Sediments (VP1.9–4.0 km s 1) regionally exceed 1.5 km thickness and the arc front is characterized by a 0.5 km s 1increase in middle crustal wave speeds. A second smaller (15 km × 700 m) cone located west of Sonne is characterized by reduced sediment thicknesses. The central Havre Trough is morphologically rougher, VP exceeds 3.5 km s 1 within 500 m of the seabed and VP increases from 5.0 to 6.6 km s 1 in the upper crust. Lower crustal velocities (7.1–7.2 km s 1) are slightly slower than observed beneath the arc and inner fore-arc. The geometry of the Moho is constrained by wide-angle reflections and unreversedPnrefractions and is ~14 km deep, ~2 km shallower than beneath the Kermadec Ridge.
The velocity model for M2 is constrained by ~33,000 travel times andfits these observations with RMS misfit = 0.118 s (Figure 7c).
Figure 7.Distribution and offset relationship of travel time residuals (Tobs Tcalc) at the conclusion of forward modeling along (a) Profile M4, (b) Profile M3, and (c) Profile M2. For each model the number of travel time observations (N), RMS and chi-square (χ2) statistic are shown. The bottom panel shows the reduction in RMS misfit and chi-square (χ2) with each iteration of model recovery tests. The arrow marks the iteration at which theFtest of model significance (95%) is failed. The difference between the perturbed starting model and thefinal optimized model at this point is shown in the supporting information Figures S2, S5, and S8 and is used to estimate the uncertainty inVP.
Journal of Geophysical Research: Solid Earth
10.1002/2016JB0131946. Gravity Models
6.1. Construction Steps
The empiricalVP-density relation fromBrocher[2005] is used to convert forward velocity models to density, from which the 2-D gravity effect is calculated using a line integral method [Bott, 1965]. The R/VSONNEwas notfitted with a gravity meter during SO192-1 and we thus compare the gravity effect of crustal models to free-air gravity anomalies derived from satellite altimeter data (Figures 4a, 5a, and 6a) [Sandwell and Smith, 1997, 2009;Sandwell et al., 2014]. A comparison between shipboard and altimeter-derived gravity measurements along the full length (10,725 km) of the R/VSONNESO215 ship track [Peirce and Watts, 2011] shows the satellite derived gravityfield offset slightly (~4 mGal) to higher values, but this discrepancy and the RMS misfit (7 mGal) are small in comparison to the amplitude of variations in free-air gravity anomalies across the fore-arc (>250 mGal).
The maximum depth of refracted raypaths along Profile M2 is ~20 km, butVPin the mantle wedge is con- strained and wide-angle reflections constrain the geometry and approximate thickness of the subducting slab to at least 25 km depth (supporting information Figure S7). The free-air gravity anomaly predicted from the crustal structure above this depthfits the observed gravityfield with an RMS misfit of 71 mGal. Profiles M4 and M3 are well constrained to ~18 km and ~23 km depth and calculated free-air gravity anomaliesfit the observed gravityfield with RMS misfits of 64 mGal and 61 mGal, respectively. Gravity anomalies along PA are incorporated fromStratford et al. [2015].
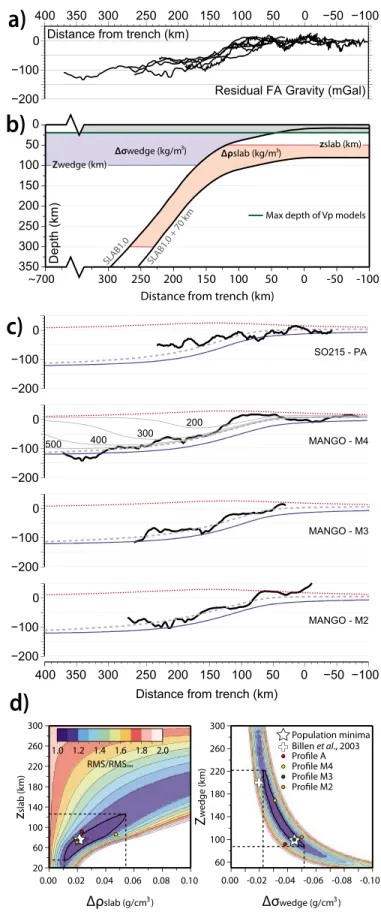
As is often observed in subduction zones, calculated free-air gravity anomalies of the seismically constrained crustal structure are offset to higher values with increasing distance landward of the trench. For example, the predicted gravity anomaly at the western end of M4 is ~140 mGal higher than the observed free-air anomaly (Figure 4a). Correcting for differences in profile geometries by plotting outstanding gravity residuals against distance from the trench, we note a systematic misfit across all four profiles distributed along ~1100 km of the Tonga-Kermadec margin between 25°S and 35°S (Figure 8a). This misfit is typically small (<50 mGal) with a shallow gradient within ~75 km of the trench then steepens to a maximum gradient of ~1.0 mGal/km at trench distances of 100–180 km, before shoaling in gradient and flattening at 100 ± 20 mGal at trench distances>180 km. These residuals are outstanding after the gravity contribution calculated from the crustal structure has been removed and their systematic long-wavelength form suggests that they likely reflect gravity contributions from differences in the structure of the subducting slab and/or mantle wedge seaward and landward of the trench-axis [Scherwath et al., 2010;Contreras-Reyes et al., 2011;Stratford et al., 2015].
We consider these gravity contributions separately by constructing simple 2-D bodies. The top of the sub- ducting slab is constrained at ≤30 km depth by forward velocity models and at greater depth (up to 400 km) by SLAB-1.0 [Hayes and Wald, 2009;Hayes et al., 2012]. The base of the subducting lithosphere isfixed 70 km below the subduction interface. The mantle wedge body is restricted to depths≥20 km, above which the gravity contribution from crustal models has been calculated and removed. This simple parameterization has four remaining variables, which are the density contrasts associated with the slab (Δρslab) and mantle wedge (Δρwedge), the minimum depth of the slab anomaly (zslab), and the maximum depth of the mantle wedge anomaly (Zwedge). These parameters are determined simultaneously by performing a least squares optimization. We use the RMS misfit between the shallow crustal gravity residual and the combined gravity anomaly associated with the slab and mantle wedge bodies across four dip-parallel wide-angle profiles (PA, M4, M3, and M2 Figure 1) as our metric offit and use a downhill simplex method tofind the bestfitting parameters,Δρslab= 0.024 g/cm3,Δρwedge= 0.045 g/cm3,zslab= 65 km, andZwedge= 95 km.
Figure 8b shows that the slab anomaly (red) is characterized by a broad and shallow high (~20 mGal) cen- tered ~150 km landward of the trench-axis. The gravity anomaly associated with low-density mantle wedge (blue) is characterized by a broad low with amplitude of up to 120 mGal, which has the steepest gradients 70–150 km from the trench. Within 70 km from the trench-axis, the near completefit provided by shallow crustal structure requires that the gravity anomalies associated with the slab and mantle wedge approxi- mately cancel. The combined gravitational effect of the slab and mantle wedge contributions (grey dash)fits outstanding shallow-crustal gravity residuals with an RMS misfit of 14 mGal (Figure 8b). Applying these con- tributions along profiles M2, M3, and M4 reduces RMS misfits to 14 mGal, 11 mGal, and 16 mGal, respectively.
Most outstanding gravity residuals are located at profile end points in poorly constrained model regions (Figures 4–6).
6.2. Shallow Crustal Gravity Residuals as a Constraint on Deep Structure
Dynamic models of viscous flow in subduction zones including a fault (shear zone) along the plate interface have successfully reproduced trench morphology [Zhong and Gurnis, 1992, 1994;Zhong et al., 1998;Buiter et al., 2001] and the long-wavelength geoid [Zhong and Gurnis, 1994]. Contrary to observations, these models predict a large depression (3–4 km) in dynamic topography in the arc/back-arc region and a short-wavelength depression in the geoid or gravity.Billen and Gurnis [2001] present thefirst results show- ing that this depression can be removed by incorporating a low- viscosity region in the mantle wedge, which effectively decouples the over- thrusting plate from theflow induced in the mantle wedge by the slab.
For the Tonga-Kermadec subduction zone,Billen et al. [2003] use observa- tions of strain rate, stress orientation, crustal thickness, dynamic topography, and the geoid as constraints on
Figure 8.(a) Stack of shallow-crustal free- air gravity residuals outstanding after the gravity effect of shallow crustal models for profiles PA, M4, M3, and M2 (Figure 1) has been calculated and subtracted from observed free-air gravity anomalies. (b) Cartoon illustrating the model parame- terization. (c) Gravity residuals (black) and combined gravity anomalies (grey dash) associated with contributions calculated for the subducting slab (red) and mantle wedge (blue). For profile M4, solid grey lines show combined gravity anomalies varying the lateral extent of the lower density mantle wedge. (d) RMS showing the trade-off between the minimum depth (zmin) and density contrast (ρslab) for the slab anomaly (left) and between the maximum depth (Zmax) and density contrast (ρwedge) for the mantle wedge anomaly (right). White star shows the parameters simultaneously bestfitting shallow-crustal residuals for all profiles with the parameters bestfitting indivi- dual profiles shown as red (PA), yellow (M4), green (M3), and orange (M2) dots.
White plus shows the wedge parameters determined byBillen et al. [2003].
Journal of Geophysical Research: Solid Earth
10.1002/2016JB013194viscosity and buoyancy in a 3-Dfinite-element model of mantleflow. Theyfind that incorporating a low- viscosity wedge makes it possible to match observations of positive dynamic topography and horizontal extension in the back-arc and downdip compression in the shallow portion of the slab. This is thefirst time these observations have been reproduced by dynamic models and are shown to be a natural consequence of including a low-viscosity region in the mantle wedge. To match the observed topography,Billen et al.
[2003] include variations in lithosphere age, crustal thickness, and a broad (≥700 km wide) low-density region (Δρ= 0.02 g/cm3) in the mantle wedge extending from 20 to 200 km depth.
The shallow crustal gravity residuals calculated in this study provide independent constraints on the den- sity structure of the subducting slab and mantle wedge. For each contribution, the trade-off between the vertical extent and density contrasts is shown in Figure 8d. RMS difference is normalized with respect to the population minima (white star) and colored dots show the parameters that bestfit the shallow crustal residuals along each wide-angle profile. The white cross shows the density and depth extent of the low-viscosity/density mantle wedge determined byBillen et al. [2003]. From the range of parameters in which RMS is within 10% of the population minima,Δρslabandzslabare constrained to 0.01–0.055 g/cm3 and 40–120 km, respectively, and Δσwedge and Zwedge are constrained to 0.022– 0.052 g/cm3 and 90–220 km, respectively (Figure 8d).
Although the bestfitting density anomaly associated with the subducting slab is relatively small for a rapidly converging plate boundary, the associated minima shown in Figure 8d is broad and the range of possible density anomalies is consistent with earlier seismically constrained gravity models along the Tonga- Kermadec margin [Scherwath et al., 2010;Stratford et al., 2015] andflexural studies on the gravity effect of the subducting slab elsewhere in the Pacific [Watts and Talwani, 1975;Davies, 1981]. Holding the slab para- meters at their least squares estimates, the wedge parameters (Δσwedge 0.02 g/cm3andZwedge200 km) determined byBillen et al. [2003] are located slightly outside the minima we define and RMS is ~40% higher, but this can be reduced to<20% if there is no gravity contribution from the subducting slab.
The density anomaly in the mantle wedge ( 0.045 g/cm3) likely reflects the effect of water on partial melting and the petrology of the mantle wedge. One of the primary effects of waterflux is to increase the degree of melting by lowering the solidus temperature. The density anomaly we calculate is equiva- lent to having nine weight percentin situmelt with a density of 2.7 g/cm3. This, however, is assuming a reference mantle density of 3.2 g/cm3, which may be too high particularly at shallow depths whereVPof
~7.8 km s 1 suggests either minor degrees (i.e., 10–15%) of mantle serpentinization [Christensen, 1966, 1996;Carlson and Miller, 2003] or the presence of cumulate rocks below the Moho [DeBari and Greene, 2011;Timm et al., 2016]. Regions of lower density caused by high melt fraction would also be expected predominantly beneath the volcanic arc. A secondary effect of large degrees of partial melting can also reduce the density of the residue. As described byBillen et al. [2003], large degrees of partial melting low- ers the Al2O3contents of the residue, which can inhibit garnet formation if transported byflow into the garnet stabilityfield (>3 GPa). The degree of melting in Mariana island arc magmas is>30% [Stolper and Newman, 1994], whichBillen et al. [2003] calculate would lead to a density reduction of 0.01–0.02 g/cm3 relative to peridotite subjected to only 10 wt % melting or 0.05 g/cm3 relative to fertile peridotite. These density anomalies may not be focused beneath the active arc. Finally, at low pressures (~1 GPa) and tem- peratures (<600°C), serpentinization of the mantle wedge is a process common to many subduction zones [Hyndman and Peacock, 2003]. Along the Kermadec arc, seismic wave-speeds below the fore-arc Moho (7.7–8.1 km/s) are consistent with 10–20 vol % of serpentine (at 1 GPa) [Christensen, 1966, 1996;
Carlson and Miller, 2003] and may exceed 25 vol % of serpentine within 40 km of the mantle wedge corner where VP may be as low as 7.5 km/s (Figure 6b) [Stratford et al., 2015]. It is possible all three mechanisms are contributing to lowering the density of the Kermadec mantle wedge, but our simple parameterization cannot discriminate between these.
Profile M4 extends across the full width of the Havre Trough back-arc and thus constrains the minimum distance from the trench that the low-density region in the mantle wedge must extend. In Figure 8c, we show the combined gravity anomaly from the mantle wedge and subducting slab varying the maximum lateral extent of the mantle wedge anomaly between 200 km and 500 km (labeled thin grey profiles). It is not possible to match the shallow crustal residual along M4 unless the low-density mantle wedge extends
>500 km from the trench and this residual is bestfit by lateral extents>700 km. This width is consistent with
Billen et al. [2003] who extend the low-density mantle wedge ~850 km from the trench-axis in order to match the bathymetry of the South Fiji Basin. These observations suggest that low-density/viscosity regions created within the mantle wedge are laterally decoupled and left behind as the trench retreats and the slab rolls back, which is consistent with their role in vertically decoupling the overthrusting plate from the negative buoyancy force of the subducting slab. We suggest that the shallow crustal residuals described above provide independent and complementary evidence of a broad, low-density (and low-viscosity) wedge beneath the central Tonga-Kermadec arc and the back-arc basin thatflanks it to the west [Billen et al., 2003].
7. Spectral Averaging of the Regional Gravity Anomalies and Bathymetry
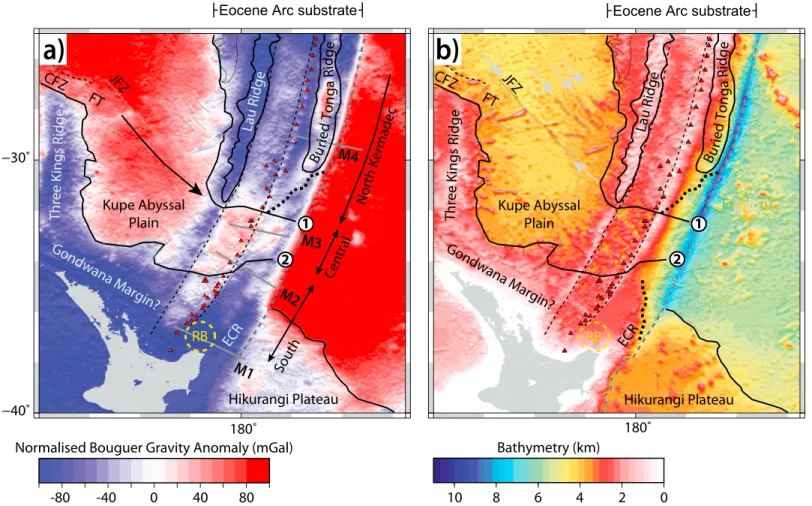
Subduction fore-arcs are characterized by steep topographic and gravimetric gradients with global averages showing ~6.0 km of relief and a ~200 mGal increase in free-air gravity anomalies across the 100 km landward of the trench-axis. To isolate shorter wavelength and lower amplitude structure that may be masked by these gradients,Bassett and Watts[2015a, 2015b] andBassett et al. [2016] have developed a method for calculating and then removing spectral averages of the trench normal topographic and gravimetric profile from regional grids of bathymetry [Intergovernmental Oceanographic Commission (IOC) et al., 2003] and free-air gravity anomalies [Sandwell and Smith, 1997;Smith and Sandwell, 1997;Sandwell and Smith, 2009].
We have applied this method of spectral averaging to isolate the gravimetric expression of the Tonga Ridge (Figure 9). The bathymetric expression of the ridge is strongest north of 26°S, but gravity data derived dur- ing the GEOSAT altimeter mission suggest a buried southward continuation of the Tonga Ridge may extend as far south as 31°S [Collot and Davy, 1998]. Hence, we subtract an ensemble average profile calcu- lated across the southern Kermadec arc (35°S–31°S). Residual free-air gravity anomalies clearly reveal the buried southward extension of the Tonga Ridge (Figure 9b). The gravimetric expression is strongest (>100 mGal) north of 25°S but is contiguous in form, maintains a residual amplitude≥50 mGal, and has a width (110 ± 20 km) consistent with the well-resolved northern segment as far as 30.5°S. In contrast to the trench and arc parallel northern segment, south of 25°S the ridge strike is approximately north-south (~006°) and appears more closely matched geometrically with the eastern margin of the Lau Ridge than the trench-axis.
8. Along-Strike Variations in Crustal Structure
8.1. Structure and Latitudinal Extent of the Tonga Ridge
The detailed structure of the Tonga-Kermadec fore-arc between ~27°S and ~38°S, as constrained byfive wide-angle refraction profiles, is shown in Figure 10. North of ~31°S, the fore-arc is occupied by the buried Tonga Ridge and a strong correlation is observed between the residual gravimetric expression of the ridge (dashed in grey) and regions of higher crustal velocities (VP6.9–7.3 km s 1). The arc front is located west of the Tonga Ridge, forming the active Kermadec Ridge. At the latitude of PA, the offset between these ridges is<30 km and is only apparent from the residual free-air gravity anomaly (Figure 10a) and a slight deepening of iso-velocity contours between the active arc (red triangle) and the eastern high-velocity crest of the Tonga Ridge (Figure 10b) [Stratford et al., 2015]. Farther south at the latitude of M4, the distance between the Tonga and Kermadec Ridges has increased to 60–70 km. Both ridges are clearly resolved as regions of elevated crus- tal wave speeds and up to 4 km of sediments (VP1.9–4.3 km s 1) of likely volcaniclastic origin have accumu- lated in the intervening basin. These sediments generate a smooth fore-arc trench slope, thereby preventing the separation of active and extinct arc ridges from being expressed bathymetrically.
Supporting the inference from residual free-air gravity anomalies that the Tonga Ridge does not extend beyond ~30.5°S, the seismic velocity structure along M3 is homogeneous with iso-velocity contours broadly parallel to the seabed between the Kermadec Ridge and the trench. Thinner sediment volumes and the absence of a centralized fore-arc basin are consistent with the positive nature of residual gravity anomalies east of the Kermadec Ridge (Figure 9b). Lower crustal velocities along M3 are only marginally slower (6.0–7.2 km s 1) than observed beneath the Tonga Ridge, which is thus seismically defined by higherVP(locally up to 0.8 km s 1faster) at intermediate depth (3–8 km below seabed), the shallow west- ward dip of iso-velocity contours beneath the ridge platform and the sharp reduction inVPbeyond the eastern ridgeflank.
Journal of Geophysical Research: Solid Earth
10.1002/2016JB013194Profile M2 is located at the northern tip of the Raukumara Plain. The fore-arc is characterized by a central 4.5 km deep basin bounded by fore-arc ridges. This basin may be contiguous with the deeper Raukumara Basin resolved by MCS data [Sutherland et al., 2009] and M1 refraction data [Scherwath et al., 2010]. The crustal thickness underlying the central basin (6–7 km) is comparable to Raukumara Basin, although crustal velocities are faster along M2 [Bassett et al., 2010;Scherwath et al., 2010]. The ridge bounding the basin to Figure 9.(a) Free-air gravity anomalies calculated from satellite altimetry [Sandwell and Smith, 1994, 1997, 2009]. Grey dashed line marks the trench-axis. Insert shows the ensemble average trench-normal profile calculated along the southern Kermadec margin (black) and full length of the Tonga-Kermadec margin (grey).
(b) Residual free-air gravity anomalies calculated by subtracting the southern Kermadec ensemble average. Grey lines show wide-angle seismic profiles. Red triangles and dashed line show arc volcanoes and the arc axis, respectively.
Figure 10.(a) Residual gravity anomaly and (b) fore-arc crustal structure. Forward velocity models are plotted against distance from the trench. Profile M1 is from Scherwath et al. [2010]. Profile PA is fromStratford et al. [2015]. Seismic models are plotted against distance from the trench. Mask shows unconstrained model regions. Light grey, dark grey, and red dashed profiles (with triangles) show the trench axis, our interpreted geometry for the Tonga Ridge and the location of the active volcanic arc front, respectively. Note the association of higher seismic velocities in the fore-arc with large positive residual free-air gravity anomalies and the relatively smooth fore-arc structure along profile M3.
![Figure 1. Bathymetric map displaying the regional tectonic setting of the Tonga-Kermadec subduction zone [IOC et al., 2003]](https://thumb-eu.123doks.com/thumbv2/1library_info/5347109.1682409/2.918.292.833.136.972/figure-bathymetric-displaying-regional-tectonic-setting-kermadec-subduction.webp)