Quantification of munition compounds in the marine environment by solid phase extraction – ultra high performance liquid chromatography with detection by electrospray ionisation – mass
spectrometry.
Martha Gledhill, Aaron J. Beck, Beate Stamer, Christian Schlosser and Eric P. Achterberg Supplementary information
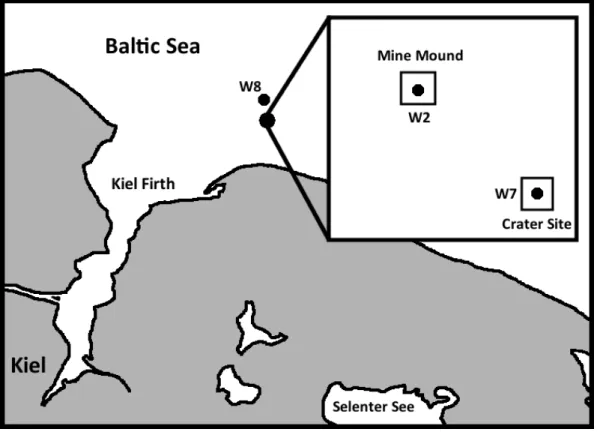
Fig S1. Map showing the study site and locations of sampling sites in the Baltic Sea, off the coast of northern Germany
Preliminary experiments to establish solid phase extraction conditions
We undertook preliminary experiments to establish suitable conditions for preconcentration of munitions compounds (MCs) using Chromabond Easy solid phase extraction columns.
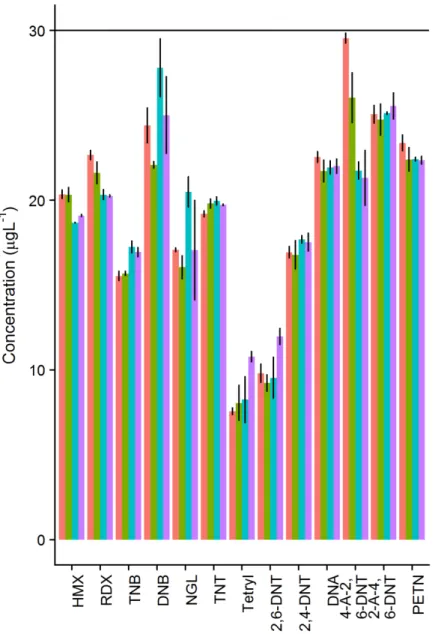
The effect of flow rate on process efficiency was tested by spiking 2×1 L aliquots 0.3 M NaCl with 30 ng L-1 mixed standard which were then preconcentrated at flow rates between 8 and 30 mL min-1. Overall, changing flow rates did not have a major impact on process
efficiencies, although there was some variability amongst the different munition compounds (Figure S1). A flow rate of 8 mL min-1 was used for sample preconcentration.
Figure S2. Effect of preconcentration flow rate on the mean concentration observed in eluates (n=2). Horizontal line is the nominal expected concentration in the eluate. Flow rates are in mL min-1. Error bars show the range of values of observed.
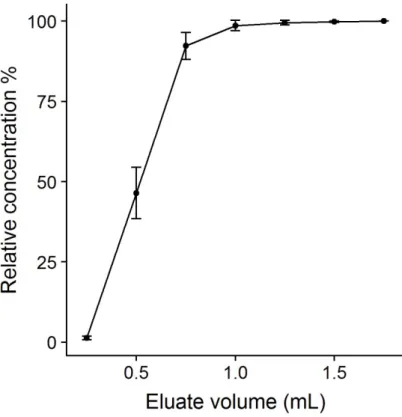
The elution volume required to ensure maximal elution of MCs was also investigated. Spiked seawater samples (n=3) were preconcentrated and consecutive 0.25 mL fractions collected for determination of MCs. In this case no evaporation step was undertaken but fractions were diluted to 0.75 mL with high purity water prior to analysis. Concentrations were normalised to the maximum observed for each compound and then the average for all compounds in a given fraction calculated. Relative concentrations are plotted as a function of elution volume in Figure S2. In this study an elution volume of 3.5 mL was chosen to ensure full recovery.
Figure S3. The relationship between eluate volume and cumulative relative concentration observed in the eluate. Points represent the mean for all munition compounds and error bars are 1 × standard deviation.
RT:0.00 - 20.01 SM:7B
0 2 4 6 8 10 12 14 16 18 20
Time (min) 0
50 100 0 50 100 0 50 100 0 50
100 4.13 4.16
6.60
6.86
8.72
NL: 1.70E7 m/z=
295.03802-295.04098+296.04552-296.04848+331.01434-331.01766+
333.01133-333.01467+341.04329-341.04671+358.03321-358.03679 F:
FTMS - c ESI Full lock ms [100.00-750.00] MS Sta20a NL: 1.46E6
m/z=
223.04188-223.04412+257.00271-257.00529+258.99970-259.00230+
267.03166-267.03434+284.02158-284.02442+485.00857-485.01343 F:
FTMS - c ESI Full lock ms [100.00-750.00] MS Sta20a NL: 9.27E6
m/z=
183.00318-183.00502+198.01501-198.01699+211.99394-211.99606+
213.00093-213.00307+214.00903-214.01117 F: FTMS - c ESI Full lock ms [100.00-750.00] MS Sta20a
NL: 2.46E5
m/z= 153.03023-153.03177+168.01616-168.01784 F: FTMS - c ESI Full lock ms [100.00-750.00] MS Sta20a
RT:0.00 - 20.01 SM:7B
0 2 4 6 8 10 12 14 16 18 20
Time (min) 0
50 100 50 100 0 50 100 0 50
100 2.00 9.33 9.38 9.40
11.91
2.54 5.11 5.60 9.01 9.60 12.07 15.11 17.56 19.71 11.36
11.94
2.01 12.36 19.34
13.43
11.95
NL: 4.90E4
m/z= 227.00173-227.00627 F: FTMS - c ESI Full lock ms [100.00-750.00] MS Sta20a
NL: 8.15E6
m/z= 226.00774-226.01226 F: FTMS - c ESI Full lock ms [100.00-750.00] MS Sta20a
NL: 4.03E6 m/z=
225.02375-225.02825+286.00314-286.00886+
288.01912-288.02488+318.02982-318.03618+
348.99851-349.00549 F: FTMS - c ESI Full lock ms [100.00-750.00] MS Sta20a
NL: 2.17E6
m/z= 181.02319-181.02681 F: FTMS - c ESI Full lock ms [100.00-750.00] MS Sta20a
RT:0.00 - 20.01 SM:7B
0 2 4 6 8 10 12 14 16 18 20
Time (min) 0
50 1000 50 100 0 50
100 14.07
16.35
15.99
18.17
NL: 5.29E7
m/z= 182.01909-182.02091 F: FTMS - c ESI Full lock ms [100.00-750.00] MS Sta20a
NL: 6.83E7
m/z= 196.03502-196.03698 F: FTMS - c ESI Full lock ms [100.00-750.00] MS Sta20a
NL: 5.85E5 m/z=
315.00542-315.00858+
316.01242-316.01558+
378.00031-378.00409 F: FTMS - c ESI Full lock ms [100.00-750.00] MS Sta20a
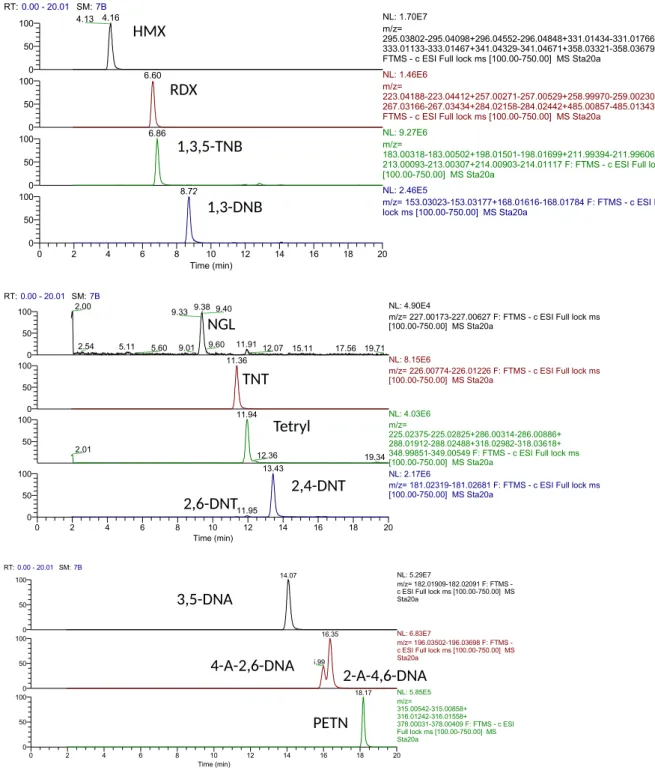
Figure S4. Extracted mass chromatograms for a 20 µg L-1 standard solution of MCs. Peaks correspond to (from top to bottom) HMX, RDX, 1,3,5-TNB, 1,3-DNB, NGL, TNT, Tetryl, 2,6-DNT and 2,4-DNT , 3,5-DNA, 2-A-4,6-DNT and 4-A-2,6-DNT, PETN. RT: retention time, SM: smoothing factor, NL: maximum ion count, F: scan filter.
1,3-DNB 1,3,5-TNB RDX HMX
TNT NGL
2,6-DNT
2,4-DNT Tetryl
PETN
2-A-4,6-DNA 4-A-2,6-DNA
3,5-DNA
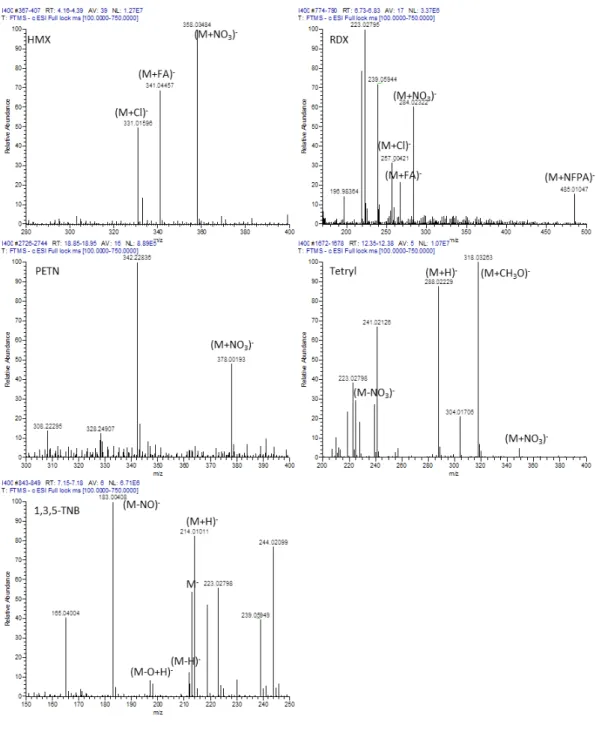
Figure S5. Averaged (n>5) mass spectra observed for HMX, RDX, PETN, Tetryl and 1,3,5- TNB during chromatographic analysis of a 400 µg L-1 standard solution. RT: retention time, AV: number of spectra averaged, NL: maximum ion count, T: Scan filter. Unlabelled ions are not attributable to the analyte. FA: formic acid, NFPA: nonafluoropentanoic acid.
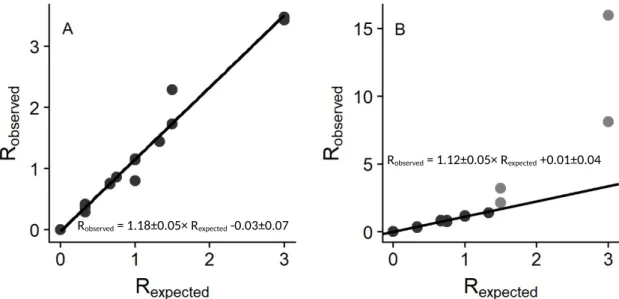
Figure S6. Plots of expected versus observed ratios for the light/heavy isotopes for (A) TNT and (B) DNB. In (B), light grey data points are for values where the expected DNB:hDNB ratio > 1.5. Equations and linear regressions for all the data for TNT and all dark grey data points for DNB are shown.
Figure S7. Variation in the relative contribution of the M- ion to the total ion count for DNB and hDNB observed on two separate analysis days (1 = 8.6.2017 and 2= 14.3.2017). The number of samples used to derive the data is given below the respective box. Blue boxes are for standards and orange boxes are for samples.
Robserved = 1.12±0.05× Rexpected +0.01±0.04
Robserved = 1.18±0.05× Rexpected -0.03±0.07
RT:0.00 - 20.01 SM:7B
0 2 4 6 8 10 12 14 16 18 20
Time (min) 0
50 100 0 50 100 0 50
100 6.61 6.62
6.71
8.73 8.768.79 16.73
16.80
8.82 13.84 16.85
2.05
8.67 8.69
NL: 2.32E5 m/z=
223.04188-223.04412+257.00271-257.00529+
258.99970-259.00230+267.03166-267.03434+
284.02158-284.02442+485.00857-485.01343 F: FTMS - c ESI Full lock ms [100.00-750.00] MS 18W7_8m1
NL: 4.46E4
m/z= 153.03023-153.03177+168.01616-168.01784 F: FTMS - c ESI Full lock ms [100.00-750.00] MS 18W7_8m1
NL: 5.75E4 m/z=
144.03928-144.04072+159.04920-159.05080+
174.03913-174.04087 F: FTMS - c ESI Full lock ms [100.00-750.00] MS 18W7_8m1
RT:0.00 - 20.01 SM:15B
0 2 4 6 8 10 12 14 16 18 20
Time (min) 0
50 100 0 50 100 0 50 100 0 50
100 11.40
11.38
11.97 14.12
16.39 16.03 2.94 2.98
NL: 1.27E6
m/z= 226.00774-226.01226 F:
FTMS - c ESI Full lock ms [100.00-750.00] MS 18W7_8m1
NL: 3.93E6
m/z= 236.02264-236.02736 F:
FTMS - c ESI Full lock ms [100.00-750.00] MS 18W7_8m1
NL: 2.06E4
m/z= 182.01818-182.02182 F:
FTMS - c ESI Full lock ms [100.00-750.00] MS 18W7_8m1
NL: 1.01E5
m/z= 196.03404-196.03796 F:
FTMS - c ESI Full lock ms [100.00-750.00] MS 18W7_8m1
Figure S8. Extracted mass chromatograms for MCs detected in a sample collected from site W7 at 8 m depth. RT: retention time, SM: smoothing factor, NL: maximum ion count, F: scan filter. Unlabelled peaks observed in extracted mass chromatograms for 1,3-DNB and 3,5- DNA were due to the presence of other compounds with masses within 5 ppm of the target compounds.
2-A-4,6-DNT 4-A-2,6-DNT
3,5-DNA TNT
hTNT 1,3-hDNB
1,3-DNB RDX
Table S1. Comparison of detection limits calculated in this study with those reported previously for detection of MCs in waste water or river water samples.
This study (µg L-1) 25 µL injection volume
Rapp Right et al., 2017 (µg L-1), 1 µL injection volume
Badjagbo and Suavé (µg L-1),
5 µL sample volume
HMX 0.00021 0.039 0.022
RDX 0.011 0.04 0.019
TNB 0.022
DNB 0.006
NBa 0.73
TNT 0.001 0.033 0.009
2,6-DNT 0.597 0.026 0.056b
Tetryl 1.0 0.049
2,4-DNT 0.042 0.048
2-NTa 2.7
3-NTa 2.6
DNA 0.0006
4-A-2,6-DNT 0.002 4-A-2,6-DNT 0.001
PETN 0.007 23 0.037
aDetection by UV spectrophotometry
bThe method of Badjagbo and Suavé (2012) does not incorporate a separation step and so isomers of DNT are not distinguished.
References
K. Badjagbo, S. Sauvé, High-Throughput Trace Analysis of Explosives in Water by Laser Diode Thermal Desorption/Atmospheric Pressure Chemical Ionization-Tandem Mass Spectrometry, Anal. Chem. 84 (2012) 5731–5736. doi:10.1021/ac300918f.
H. Rapp-Wright, G. McEneff, B. Murphy, S. Gamble, R. Morgan, M. Beardah, L. Barron, Suspect screening and quantification of trace organic explosives in wastewater using solid phase extraction and liquid chromatography-high resolution accurate mass spectrometry, J. Hazard. Mater. 329 (2017) 11–21. doi:10.1016/J.JHAZMAT.2017.01.008.