https://doi.org/10.5194/bg-16-4321-2019
© Author(s) 2019. This work is distributed under the Creative Commons Attribution 4.0 License.
Nitrous oxide (N 2 O) and methane (CH 4 ) in rivers and estuaries of northwestern Borneo
Hermann W. Bange1, Chun Hock Sim2, Daniel Bastian1, Jennifer Kallert1, Annette Kock1, Aazani Mujahid3, and Moritz Müller2
1Marine Biogeochemistry Research Division, GEOMAR Helmholtz Centre for Ocean Research Kiel, Kiel, Germany
2Faculty of Engineering, Computing and Science, Swinburne University of Technology, Kuching, Sarawak, Malaysia
3Department of Aquatic Science, Faculty of Resource Science & Technology, University Malaysia Sarawak, Kota Samarahan, Sarawak, Malaysia
Correspondence:Hermann W. Bange (hbange@geomar.de) Received: 31 May 2019 – Discussion started: 11 June 2019
Revised: 20 September 2019 – Accepted: 27 September 2019 – Published: 15 November 2019
Abstract.Nitrous oxide (N2O) and methane (CH4) are atmo- spheric trace gases which play important roles in the climate and atmospheric chemistry of the Earth. However, little is known about their emissions from rivers and estuaries, which seem to contribute significantly to the atmospheric budget of both gases. To this end concentrations of N2O and CH4were measured in the Rajang, Maludam, Sebuyau and Simunjan rivers draining peatland in northwestern (NW) Borneo dur- ing two campaigns in March and September 2017. The Ra- jang River was additionally sampled in August 2016 and the Samunsam and Sematan rivers were additionally sam- pled in March 2017. The Maludam, Sebuyau, and Simun- jan rivers are typical “blackwater” rivers with very low pH (3.7–7.8), very high dissolved organic carbon (DOC) con- centrations (235–4387 mmol L−1) and very low O2concen- trations (31–246 µmol L−1; i.e. 13 %–116 % O2saturation).
The spatial and temporal variability of N2O and CH4con- centrations (saturations) in the six rivers or estuaries was large and ranged from 2.0 nmol L−1(28 %) to 41.4 nmol L−1 (570 %) and from 2.5 nmol L−1 (106 %) to 1372 nmol L−1 (57 459 %), respectively. We found no overall trends of N2O with O2 or NO−3, NO−2 or NH+4, and there were no trends of CH4 with O2 or dissolved nutrients or DOC. N2O con- centrations showed a positive linear correlation with rainfall.
We conclude, therefore, that rainfall is the main factor de- termining the riverine N2O concentrations since N2O pro- duction or consumption in the blackwater rivers themselves seems to be low because of the low pH. CH4concentrations were highest at salinity=0 and most probably result from
methanogenesis as part of the decomposition of organic mat- ter under anoxic conditions. CH4in the concentrations in the blackwater rivers showed an inverse relationship with rain- fall. We suggest that CH4oxidation in combination with an enhanced river flow after the rainfall events might be re- sponsible for the decrease in the CH4 concentrations. The rivers and estuaries studied here were an overall net source of N2O and CH4to the atmosphere. The total annual N2O and CH4 emissions were 1.09 Gg N2O yr−1(0.7 Gg N yr−1) and 23.8 Gg CH4yr−1, respectively. This represents about 0.3 %–
0.7 % of the global annual riverine and estuarine N2O emis- sions and about 0.1 %–1 % of the global riverine and es- tuarine CH4 emissions. Therefore, we conclude that rivers and estuaries in NW Borneo – despite the fact their water area covers only 0.05 % of the global river/estuarine area – contribute significantly to global riverine and estuarine emis- sions of N2O and CH4.
1 Introduction
Nitrous oxide (N2O) and methane (CH4) are atmospheric trace gases which influence the climate and atmospheric chemistry of the Earth (IPCC, 2013; WMO, 2014). They act as greenhouse gases in the troposphere and are indi- rectly involved in stratospheric ozone depletion. Emission estimates indicate that rivers and estuaries contribute signifi- cantly to the atmospheric budget of both N2O and CH4. N2O emission estimates for rivers and estuaries range from 0.05
to 3.3 Tg N2O yr−1 and from 0.09 to 5.7 Tg N2O yr−1, re- spectively (see overview in Maavara et al., 2019). Thus, the combined riverine and estuarine emissions may contribute up to 32 % of the global natural and anthropogenic emis- sions of N2O (28.1 Tg N2O yr−1; IPCC, 2013). CH4 emis- sion estimates for rivers and estuaries are in the range of 1.5–26.8 Tg CH4yr−1(Bastviken et al., 2011; Stanley et al., 2016) and 0.8–6.6 Tg CH4yr−1(see overview in Borges and Abril, 2011), respectively. The combined emissions from rivers and estuaries can contribute up to 6 % of the global natural and anthropogenic atmospheric emissions of CH4 (556 Tg CH4yr−1; IPCC, 2013). As indicated by the wide range of the estimates cited above, the emission estimates of both gases are associated with a high degree of uncertainty, which is mainly caused by an inadequate coverage of the temporal and spatial distributions of N2O and CH4in rivers and estuaries and the inherent errors of the model approaches to estimate their exchange across the water–atmosphere in- terface (see, e.g., Alin et al., 2011; Borges and Abril, 2011).
N2O is produced by microbial processes such as nitrifica- tion (i.e. oxidation of ammonia, NH3, to nitrite, NO−2) in es- tuarine waters (see, e.g., Barnes and Upstill-Goddard, 2011) and heterotrophic denitrification (i.e. reduction of nitrate, NO−3, to dinitrogen, N2) in river sediments (Beaulieu et al., 2011). The yields of N2O from these processes are enhanced under low-oxygen (i.e. suboxic) conditions (see, e.g., Brase et al., 2017; Zhang et al., 2010), whereas N2O can be reduced to N2under anoxic conditions via sedimentary denitrification in rivers (see, e.g., Upstill-Goddard et al., 2017). Apart from ambient oxygen (O2) concentrations, riverine and estuarine N2O production is also dependent on the concentrations of dissolved inorganic nitrogen (DIN;=NH+4 +NO2−+NO−3) and organic carbon (Quick et al., 2019). There seems to be a general trend towards high estuarine/riverine N2O concen- trations when DIN concentrations are high as well (Barnes and Upstill-Goddard, 2011; Quick et al., 2019; Zhang et al., 2010). However, this trend masks the fact that in many cases the spatial and temporal variability of riverine and estuarine N2O is often not related to DIN (see, e.g., Borges et al., 2015;
Brase et al., 2017; Müller et al., 2016a; Quick et al., 2019).
CH4 is produced during microbial respiration of organic matter by anaerobic methanogenesis in riverine and estuar- ine sediments (see, e.g., Borges and Abril, 2011; Romeijn et al., 2019; Stanley et al., 2016). A significant fraction of the CH4produced in sediments can be oxidized to carbon diox- ide (CO2) via anaerobic CH4 oxidation in sulfate-reducing zones of estuarine sediments (see, e.g., Maltby et al., 2018) and aerobic CH4 oxidation in riverine sediments (see, e.g., Shelley et al., 2017). When released to the overlying riverine or estuarine water, CH4can be oxidized by aerobic CH4oxi- dation before reaching the atmosphere (see, e.g., Borges and Abril, 2011; Sawakuchi et al., 2016; Steinle et al., 2017).
In general, the temporal and spatial distributions of N2O and CH4 in rivers and estuaries are driven by the complex interplay of microbial production and consumption pathways
(see above) as well as physical processes such as input via shallow groundwater, river discharge, tidal pumping, release to the atmosphere and export to coastal waters (Barnes and Upstill-Goddard, 2011; Borges and Abril, 2011; Quick et al., 2019; Stanley et al., 2016).
Peatlands, which are found in the tropics and at high lat- itudes, constitute one of the largest reservoirs of organic- bound carbon worldwide (Minasny et al., 2019; Page et al., 2011; Treat et al., 2019; Yu et al., 2010). Rivers and streams draining peatlands have exceptionally high concentrations of dissolved organic carbon (DOC) and low pH and, thus, be- long to the “blackwater” river type, which is also found in southeast (SE) Asia (see, e.g., Alkhatib et al., 2007; Martin et al., 2018; Moore et al., 2011).
Despite the fact that a number of studies about N2O and CH4 emissions from peatlands in SE Asia have been pub- lished (see, e.g., Couwenberg et al., 2010; Hatano et al., 2016; Jauhiainen et al., 2012), only a few studies about their emissions from peatland-draining rivers in SE Asia have been published so far (Jauhiainen and Silvennoinen, 2012;
Mü et al., 2016a). Therefore, our knowledge about the bio- geochemistry and emissions of N2O and CH4from peatland- draining rivers is still rudimentary at best.
Here we present measurements of dissolved N2O and CH4 in six rivers and estuaries in northwestern (NW) Borneo dur- ing August 2016, March 2017 and September 2017. The ob- jectives of our study were (i) to measure the distributions of dissolved N2O and CH4, (ii) to identify the major factors in- fluencing their distributions, and (iii) to estimate the N2O and CH4emissions to the atmosphere.
2 Study site description
Discrete samples of surface water were taken at several sta- tions along the salinity gradients of the Rajang, Maludam, Sebuyau and Simunjan rivers in NW Borneo during two cam- paigns in March and September 2017 (Fig. 1, Table 1). The Rajang River was additionally sampled in August 2016, and the Samunsam and Sematan rivers were additionally sampled in March 2017. The environmental settings of the river basins are summarized in Table 2. Based on the areas affected by oil palm plantations and logging in combination with our own observations during several sampling campaigns, we classi- fied the Rajang and Simunjan River basins as “disturbed”
and the Maludam, Sebuyau, Sematan and Samunsam River basins as “undisturbed” (Table 2).
3 Methods
3.1 Measurements of N2O and CH4
Water was collected from 1 m depth by using a Niskin sam- pler. Subsamples for N2O and CH4 were taken as dupli- cates or triplicates in 20 or 37 mL glass vials. The vials were
Figure 1.Map of the study area with locations of the sampling stations. Sampling stations from August 2016 are displayed in red circles, from March 2017 in blue triangles, and from September 2017 in green diamonds. Major cities are highlighted in bold plus symbols. Inset is adapted from Staub et al. (2000).
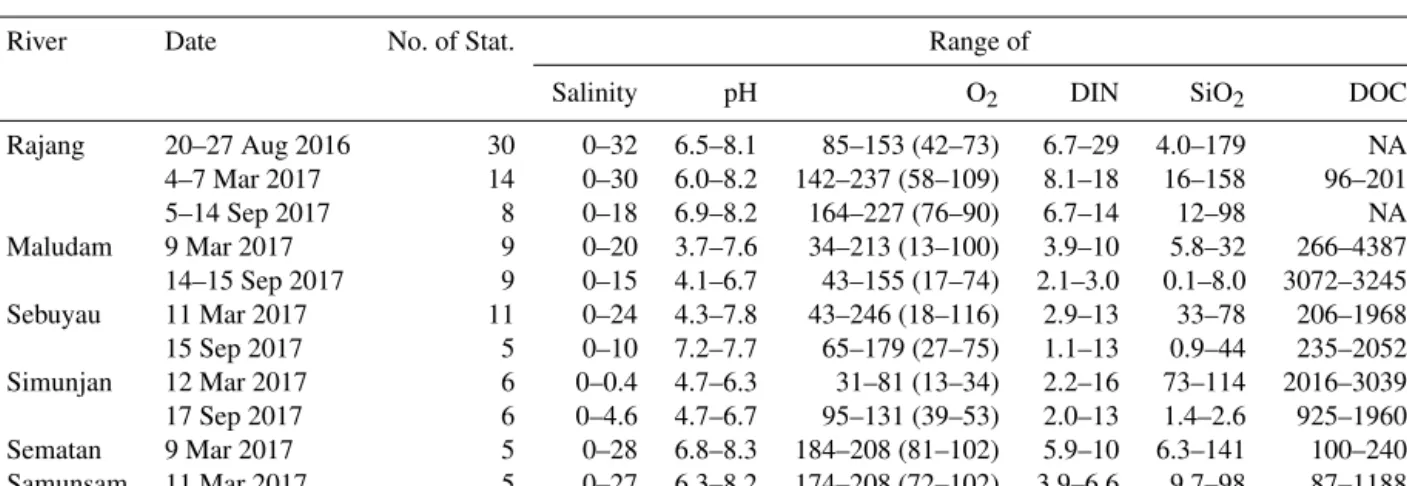
Table 1.Overview of sampling and sampled ranges of salinity, pH as well as O2concentration and saturation (in percent, given in parentheses) and concentrations of dissolved inorganic nitrogen (DIN=NO−3 +NO−2 +NH+4), silicate (SiO2) and dissolved organic carbon (DOC). All concentrations are given in µmol L−1. NA stands for not available and “Stat.” stands for sampling station. DOC data were taken from Martin et al. (2018).
River Date No. of Stat. Range of
Salinity pH O2 DIN SiO2 DOC
Rajang 20–27 Aug 2016 30 0–32 6.5–8.1 85–153 (42–73) 6.7–29 4.0–179 NA
4–7 Mar 2017 14 0–30 6.0–8.2 142–237 (58–109) 8.1–18 16–158 96–201
5–14 Sep 2017 8 0–18 6.9–8.2 164–227 (76–90) 6.7–14 12–98 NA
Maludam 9 Mar 2017 9 0–20 3.7–7.6 34–213 (13–100) 3.9–10 5.8–32 266–4387
14–15 Sep 2017 9 0–15 4.1–6.7 43–155 (17–74) 2.1–3.0 0.1–8.0 3072–3245
Sebuyau 11 Mar 2017 11 0–24 4.3–7.8 43–246 (18–116) 2.9–13 33–78 206–1968
15 Sep 2017 5 0–10 7.2–7.7 65–179 (27–75) 1.1–13 0.9–44 235–2052
Simunjan 12 Mar 2017 6 0–0.4 4.7–6.3 31–81 (13–34) 2.2–16 73–114 2016–3039
17 Sep 2017 6 0–4.6 4.7–6.7 95–131 (39–53) 2.0–13 1.4–2.6 925–1960
Sematan 9 Mar 2017 5 0–28 6.8–8.3 184–208 (81–102) 5.9–10 6.3–141 100–240
Samunsam 11 Mar 2017 5 0–27 6.3–8.2 174–208 (72–102) 3.9–6.6 9.7–98 87–1188
first rinsed with sample water, then filled to the maximum (without air bubbles), and finally sealed on the spot using a crimper. The samples were kept on ice for a maximum of 3 h.
When returned to the field station, 50 µL of saturated aqueous mercuric chloride (HgCl2) solution was immediately added to stop any biological activity, and samples were stored at
4◦C until shipment. The samples were shipped to GEOMAR Helmholtz Centre for Ocean Research Kiel, Germany, for further analysis within a few weeks after sampling. For the determination of the N2O and CH4 concentrations, we ap- plied the static-headspace equilibration method followed by gas chromatographic separation and detection with an elec-
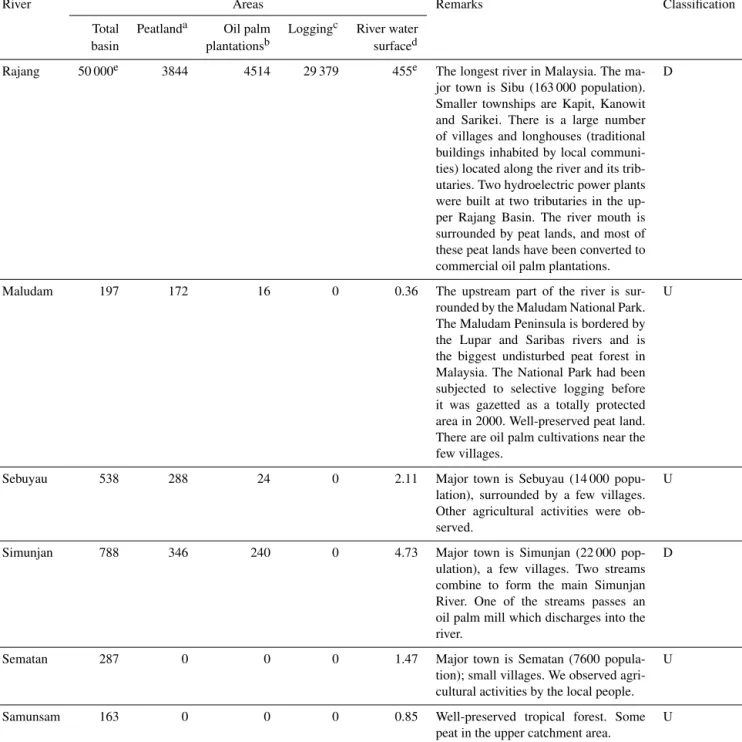
Table 2.Summary of the environmental settings of the river basins. Based on the area percentage of oil palm, logging, and our own surveys and observations, we classified the river basins as undisturbed (U) and disturbed (D). All areas are given in kilometres.
River Areas Remarks Classification
Total Peatlanda Oil palm Loggingc River water
basin plantationsb surfaced
Rajang 50 000e 3844 4514 29 379 455e The longest river in Malaysia. The ma- jor town is Sibu (163 000 population).
Smaller townships are Kapit, Kanowit and Sarikei. There is a large number of villages and longhouses (traditional buildings inhabited by local communi- ties) located along the river and its trib- utaries. Two hydroelectric power plants were built at two tributaries in the up- per Rajang Basin. The river mouth is surrounded by peat lands, and most of these peat lands have been converted to commercial oil palm plantations.
D
Maludam 197 172 16 0 0.36 The upstream part of the river is sur-
rounded by the Maludam National Park.
The Maludam Peninsula is bordered by the Lupar and Saribas rivers and is the biggest undisturbed peat forest in Malaysia. The National Park had been subjected to selective logging before it was gazetted as a totally protected area in 2000. Well-preserved peat land.
There are oil palm cultivations near the few villages.
U
Sebuyau 538 288 24 0 2.11 Major town is Sebuyau (14 000 popu-
lation), surrounded by a few villages.
Other agricultural activities were ob- served.
U
Simunjan 788 346 240 0 4.73 Major town is Simunjan (22 000 pop-
ulation), a few villages. Two streams combine to form the main Simunjan River. One of the streams passes an oil palm mill which discharges into the river.
D
Sematan 287 0 0 0 1.47 Major town is Sematan (7600 popula-
tion); small villages. We observed agri- cultural activities by the local people.
U
Samunsam 163 0 0 0 0.85 Well-preserved tropical forest. Some
peat in the upper catchment area.
U
aEstimate is based on “Wetlands International”. “Malaysia peat lands”. Accessed through Global Forest Watch on 22 November 2018 (https://www.globalforestwatch.org).
bEstimate is based on “Oil palm concessions”. Accessed through Global Forest Watch on 22 November 2018 (https://www.globalforestwatch.org).cEstimate is based on
“Managed forest concessions”. Accessed through Global Forest Watch on 22 November 2018 (https://www.globalforestwatch.org).dArea estimates are based on the length and width of the primary course and main tributaries of the rivers. Length and width of the rivers were estimated using Google Earth (multiple readings).eEstimate from Staub et al. (2000).
tron capture detector (ECD; for N2O) and a flame ioniza- tion detector (FID; for CH4) as described in Bastian (2017) and Kallert (2017). Calibration of the ECD and FID was per- formed with standard gas mixtures of 348.4–1476.1 ppb N2O and 1806.10–3003.79 ppb CH4 in synthetic air which have
been calibrated against NOAA-certified primary gas stan- dards in the laboratory of the Max Planck Institute for Bio- geochemistry in Jena, Germany.
Dissolved N2O/CH4 concentrations (Cobs in nmol L−1) were calculated with
Cobs=x0P Vhs/(RT Vwp)+x0βP , (1) where x0 is the dry mole fraction of N2O or CH4 in the headspace of the sample, P is the ambient pressure (set to 1013.25 hPa), and Vhs and Vwp are the volumes of the headspace and the water phase, respectively.Rstands for the gas constant (8.31451 m3Pa K−1mol−1),T is the tempera- ture during equilibration, and β is the solubility of N2O or CH4(Weiss and Price, 1980; Wiesenburg and Guinasso Jr., 1979). The estimated mean relative errors of the measure- ments were±9 % and±13 % for N2O and CH4, respectively.
These comparably high relative errors most probably resulted from the long storage time (6–7 months after sampling) for some of the samples. The higher mean measurement error of the CH4samples (compared to the N2O measurements) was attributed to the fact that CH4samples are more sensitive to storage time than N2O samples (Wilson et al., 2018).
3.2 Ancillary measurements
Water temperature, dissolved oxygen and salinity were recorded with an Aquaread®2000. Nutrient measurements are described in detail in Sia et al. (2019). In short, all sam- ples were collected within the upper 1 m (surface) using pre-washed bottles via a pole sampler to reduce contamina- tion from the surface of the boat and engine coolant waters (Zhang et al., 2015). Samples were filtered through a 0.4 µm pore-size polycarbonate membrane filter (Whatman) into pre-rinsed bottles, conserved with concentrated HgCl2solu- tion and kept in a cool, dark room. Nutrients were determined utilizing a Skalar SANplus auto analyser with an analytical precision<5 %. pH was measured using a YSI Aquaread® multiple-parameter probe (AP-2000). The measurements of DOC are described in detail in Martin et al. (2018). The per- formance of the DOC measurements was monitored by us- ing deep-sea water samples with a certified DOC concen- tration of 42–45 µmol L−1provided by the Hansell Labora- tory, University of Miami. Our analyses consistently yielded slightly higher concentration for the reference water, with a long-term mean (±1 SD) of 47±2.0 µmol L−1(n=51). The DOC data are available from the Supplement in Martin et al. (2018).
3.3 Computations of saturations and flux densities The saturations (Sat, %) for N2O, CH4and O2 were calcu- lated as
Sat=100◦Cobs/Ceq, (2)
whereCeqis the equilibrium concentration of N2O/CH4/O2 calculated according to Weiss and Price (1980), Wiesenburg and Guinasso Jr. (1979), or Weiss (1970), respectively, with
the in situ temperature and salinity as well as the mean dry mole fractions of N2O/CH4 at the time of the sampling.
Mean monthly N2O/CH4dry mole fractions of 329/1841× 10−9 (ppb), 331/1880 and 330/1852 ppb for August 2016, March 2017 and September 2017, respectively, were mea- sured at the atmospheric monitoring station Bukit Kotota- bang, located on the west coast of Sumatra (Indonesia).
This station is operated by the NOAA/ESRL Global Mon- itoring Division program and data are available from http:
//www.esrl.noaa.gov/gmd (last access: 4 November 2019). A saturation<100 % indicates a concentration lower than the theoretical equilibrium concentration (i.e. undersaturation), and a saturation>100 % indicates supersaturation.
Flux densities (F, nmol m−2s−1) were calculated as
F =kw(Cobs−Ceq), (3)
kw=k600(Sc/600)−0.5. (4)
kw is the gas transfer velocity andSc is the Schmidt num- ber, which was calculated with the equations for the kine- matic viscosity of water (Siedler and Peters, 1986) and the diffusion of N2O or CH4in water (Jähne et al., 1987; Rhee et al., 2009).k600 was determined in a study for the Lupar and Saribas rivers which are located in close vicinity to the Maludam River (Müller et al., 2016a, b). Both rivers have similar environmental and morphological settings in compar- ison to the rivers studied here. Therefore, we assume that the k600values measured by Müller et al. (2016a) are represen- tative of the rivers in NW Borneo studied here. Meank600 ranges from 13.2±11 to 23.9±14.8 cm h−1. On the basis of the data in Müller et al. (2016a), we computed a mean k600of 19.2 cm h−1 (5.33×10⁻⁵m s−1), which we used to estimate the flux densities of N2O and CH4. This k600 is in good agreement with the meank600 for rivers <100 m wide (22.4±14.3 cm h−1) and estuaries/rivers>100 m wide (10.3±7.7 cm h−1) listed in Alin et al. (2011), which range from 6.0 to 35.3 and 4.8 to 30.6 cm h−1, respectively. kw in rivers depends on the turbulence at the river is water–
atmosphere interface, which in turn is mainly affected by water current velocity, water depth and riverbed roughness and to a lesser extent by the wind speed (Alin et al., 2011;
Borges and Abril, 2011). Since thek600reported by Müller et al. (2016a) was determined only during the wet season (March 2014), our meank600 is biased because it does not account for a lowerk600, which is to be expected during the dry season (resulting from a lower water current velocity;
Alin et al., 2011). This results in an overestimation of the flux densities.
3.4 Rainfall data
In order to account for the regional variability of the rain- fall in NW Borneo, we used rainfall data with a 3 h res- olution recorded at the weather stations in Kuching, Ban- dar Sri Aman and Sibu (all in NW Borneo). The rainfall
data were provided by World Weather Online (Dubai, UAE, and Manchester, UK) and are available via https://www.
worldweatheronline.com/ (last access: 4 November 2019).
Representative weather stations were chosen for each river basin studied here and allocated as follows. The rainfall data for the Simunjan, Sematan and Samunsam River basins are represented by the data from Kuching; the Maludam–
Sebuyau and the Rajang River basins are represented by the data from the Bandar Sri Aman and Sibu weather stations, respectively. We also included the N2O and CH4concentra- tion data from two measurement campaigns to the Lupar and Saribas rivers in June 2013 and March 2014 (Müller et al., 2016a). The Lupar and Saribas data were associated with the rainfall data from the weather station in Bandar Sri Aman.
Accumulated rainfall amount was computed by summing up the 3 h rainfall data for the periods of 1–4 weeks prior to the sampling dates.
4 Results and discussion
All rivers showed low concentrations of DIN in the range of 1.1 to 29 µmol L−1(Table 1). NO−3 concentrations ranged from below the detection limit of 0.14 up to 19 µmol L−1, and NH+4 concentrations were in the range of 0.3 to 17 µmol L−1. The Maludam, Sebuyau and Simunjan rivers can be classified as blackwater rivers with low pH (3.7–4.8), high DOC con- centrations (1960–4387 µmol L−1) and low O2 concentra- tions (31–95 µmol L−1; 13 %–39 % saturation) at salinity=0 (Table 1). Comparable settings have been reported from other tropical blackwater rivers in SE Asia as well (Alkhatib et al., 2007; Baum et al., 2007; Moore et al., 2011; Rixen et al., 2008; Wit et al., 2015).
4.1 Nitrous oxide
The measured ranges of N2O concentrations and saturations are listed in Table 3 and the distributions of N2O satura- tions along the salinity gradients are shown in Fig. 2. N2O concentrations (saturations) were highly variable and ranged from 2.0 nmol L−1(28 %) in the Rajang River (at salinity=0 in August 2016) to 41.4 nmol L−1 (570 %) in the Simunjan River (at salinity=0 in March 2017). N2O concentrations in the Rajang, Maludam and Sebuyau rivers were generally higher in September compared to March 2017 (Fig. 2a–c).
A decreasing linear trend of the N2O saturations with salin- ity was only observed for the Rajang River in March 2017 (Fig. 2a) indicating a conservative mixing and no N2O sources or sinks along the salinity gradient. Our results are in general agreement with the N2O measurements in the Lu- par and Saribas rivers (which are located in close vicinity of the Maludam River) in June 2013 and March 2014: Müller et al. (2016a) measured N2O concentrations (saturations) from 6.6 to 117 nmol L−1 (102 % to 1679 %) in the Lupar and Saribas rivers. Salinity and N2O concentrations in the Lupar
and Saribas rivers were negatively correlated in June 2013 but were not correlated in March 2014 (Müller et al., 2016a).
In contrast with our study, no N2O undersaturations have been observed by Müller et al. (2016a). Our results are at the lower end of N2O concentrations reported from rivers around the globe, which can range from extreme undersat- uration (down to about 3 %, i.e. almost devoid of N2O) as measured in a tropical river in Africa (Borges et al., 2015) to extreme supersaturation (of up to 12 500 %) as measured in an agriculture-dominated river in Europe (Borges et al., 2018).
Maximum N2O saturations measured in March 2017 were in the range of 106 % to 142 % for the rivers classified as undisturbed (Maludam, Sebuyau, Sematan and Samunsam), whereas the maximum saturation for the rivers classified as disturbed (Rajang and Simunjan) was in the range of 329 % to 570 % (Tables 2 and 3) indicating higher emissions from the disturbed rivers. The maximum N2O saturations in September 2017 ranged from 329 % to 390 %, and no dif- ferences were observed between undisturbed and disturbed rivers (Table 3).
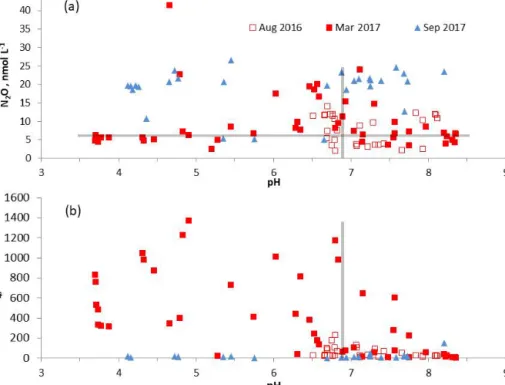
We found no overall trends of N2O with O2or NO−3, NO−2, NH+4 and DIN. Therefore, it is difficult to decipher the ma- jor consumption or production processes of N2O or to lo- cate the influence of (local) anthropogenic input of nitrogen compounds on riverine N2O cycling. This is in line with re- sults from studies of other tropical rivers (Borges et al., 2015;
Müller et al., 2016a). There are, however, occasional obser- vations of N2O correlations with O2or nutrients in tropical rivers which were attributed to river types such as swamp and savannah rivers (Upstill-Goddard et al., 2017). Figure 3 shows the N2O concentrations along the pH gradients. Ob- viously there are no trends except for an enhancement of the N2O concentrations in September 2017. N2O production via nitrification depends on the prevailing pH because nitrifiers prefer to take up ammonia (NH3). The concentration of dis- solved NH3 drops significantly at pH<8–9 (Bange, 2008) because of its easy protonation to ammonium (NH+4). A low pH of about 5–6 can reduce nitrification (NH+4 oxidation) significantly as was recently shown for the Tay Ninh River in Vietnam (Le et al., 2019). Moreover, the optimum for a net N2O production by nitrification, nitrifier denitrification and denitrification lies between a pH of 7 and 7.5 (Blum et al., 2018). Therefore, a net N2O production may be low in the blackwater rivers studied here because of their low pH (see Table 1). The observed N2O supersaturations, therefore, might have been mainly the result of external inputs of N2O- enriched waters or groundwater. The observed N2O under- saturations were most probably resulting from heterotrophic denitrification which could have taken place either in organic matter-enriched anoxic river sediments or in anoxic environ- ments of the surrounding soils. However, the main factor for riverine N2O under- or supersaturation might be rainfall be- cause rainfall events determine the height of the water ta- ble in the surrounding soils, which, in turn, determines the
Figure 2.N2O saturations along the salinity gradients of(a)Rajang,(b)Maludam,(c)Sebuyau,(d)Simunjan,(e)Sematan and(f)Samun- sam. The dashed lines indicate the equilibrium (100 %) saturation. The open circles depict measurements from August 2016, the filled red circles depict measurements from March 2017 and the filled blue circles depict measurements from September 2017.
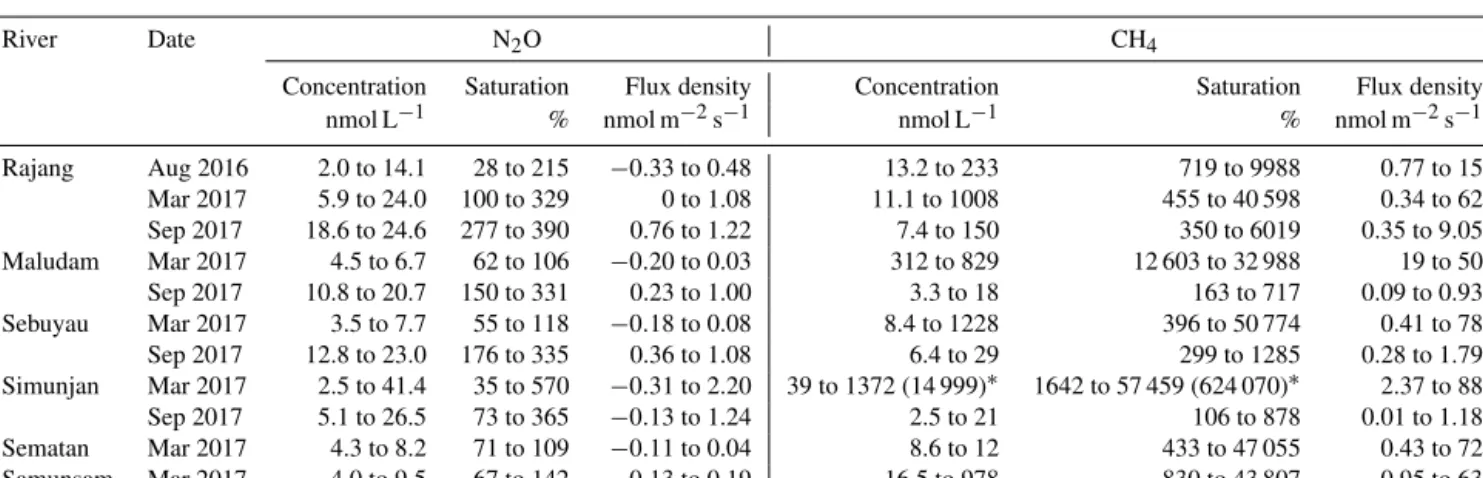
Table 3.Overview of N2O and CH4concentrations, saturations and flux densities in rivers and estuaries of NW Borneo.
River Date N2O CH4
Concentration Saturation Flux density Concentration Saturation Flux density
nmol L−1 % nmol m−2s−1 nmol L−1 % nmol m−2s−1
Rajang Aug 2016 2.0 to 14.1 28 to 215 −0.33 to 0.48 13.2 to 233 719 to 9988 0.77 to 15 Mar 2017 5.9 to 24.0 100 to 329 0 to 1.08 11.1 to 1008 455 to 40 598 0.34 to 62 Sep 2017 18.6 to 24.6 277 to 390 0.76 to 1.22 7.4 to 150 350 to 6019 0.35 to 9.05 Maludam Mar 2017 4.5 to 6.7 62 to 106 −0.20 to 0.03 312 to 829 12 603 to 32 988 19 to 50 Sep 2017 10.8 to 20.7 150 to 331 0.23 to 1.00 3.3 to 18 163 to 717 0.09 to 0.93 Sebuyau Mar 2017 3.5 to 7.7 55 to 118 −0.18 to 0.08 8.4 to 1228 396 to 50 774 0.41 to 78 Sep 2017 12.8 to 23.0 176 to 335 0.36 to 1.08 6.4 to 29 299 to 1285 0.28 to 1.79 Simunjan Mar 2017 2.5 to 41.4 35 to 570 −0.31 to 2.20 39 to 1372 (14 999)∗ 1642 to 57 459 (624 070)∗ 2.37 to 88 Sep 2017 5.1 to 26.5 73 to 365 −0.13 to 1.24 2.5 to 21 106 to 878 0.01 to 1.18 Sematan Mar 2017 4.3 to 8.2 71 to 109 −0.11 to 0.04 8.6 to 12 433 to 47 055 0.43 to 72 Samunsam Mar 2017 4.0 to 9.5 67 to 142 −0.13 to 0.19 16.5 to 978 830 to 43 807 0.95 to 63
∗This extreme value was not included in further computations.
amount of suboxic–anoxic conditions favourable for N2O production or consumption (Jauhiainen et al., 2016). See also discussion in Sect. 4.3.
4.2 Methane
The measured ranges of CH4concentrations and saturations are listed in Table 3, and the distributions of CH4 satura-
tions along the salinity gradients are shown in Fig. 4. CH4
concentrations (saturations) were highly variable and ranged from 2.5 nmol L−1(106 %) in the Simunjan River (at salin- ity=0 in September 2017) to 1372 nmol L−1 (57 459 %) in the Simunjan River (at salinity=0 in March 2017).
(Please note that we also measured a CH4concentration of 14 999 nmol L−1 (624 070 %) at one station in the Simun- jan River at salinity=0 in March 2017, which, however,
Figure 3.Concentrations of N2O(a)and CH4(b)from rivers or estuaries along the pH gradients. The open red squares depict data from August 2016, the filled red squares depict data from March 2017 and the filled blue triangles depict data from September 2017. The vertical bars in(a)and(b)roughly indicate salinity=0. Concentrations to the left of the vertical bar are at salinity=0 and concentrations to the right of the vertical bars are at salinity>0. The horizontal bar in(a)indicates the equilibrium concentration of N2O. Please note that in August 2016, only the Rajang River was sampled.
was not included in Fig. 4 and which was excluded in the emission estimates for statistical reasons.) CH4 saturations in the Rajang, Maludam, Sebuyau and Simunjan rivers were higher in March 2017 compared to September 2017. Maxi- mum CH4concentrations were measured at salinity=0, and there was a general decrease in CH4concentrations with in- creasing salinity. Exceptions from this trend occurred at in- dividual stations in the Maludam, Sebuyau and Samunsam rivers which point to local sources of CH4(Fig. 3). The range of CH4concentrations (saturations) from our study is larger compared to the concentration range measured in the Lu- par and Saribas rivers (3.7–113.9 nmol L−1; 168 %–5058 %) (Müller et al., 2016a). Borges et al. (2015) reported a max- imum CH4 concentration (saturation) of 62 966 nmol L−1 (approx. 954 000 %) in their study of tropical rivers in Africa, which is much higher than the maximum concentration mea- sured in our study. We found no differences in the CH4satu- rations between the rivers classified as undisturbed and those classified as disturbed in both March and September 2017.
We found no overall trends of CH4with O2or dissolved nutrients or DOC along the salinity gradients. There are, however, occasional observations in tropical rivers of CH4 relationships with O2, which were attributed to different river types such as swamp and savannah rivers (Upstill-Goddard et al., 2017). High CH4concentrations, which were often asso-
ciated with high DOC and low O2 concentrations at salin- ity=0 and pH<7 (see Fig. 3b), might have been produced by methanogenesis in anoxic riverine sediments rich in or- ganic material or in anoxic parts of the surrounding soils drained by the rivers. The decrease in CH4with increasing salinity can be attributed to the gas exchange across the river water–atmosphere interface in combination with CH4oxida- tion (Borges and Abril, 2011; Sawakuchi et al., 2016).
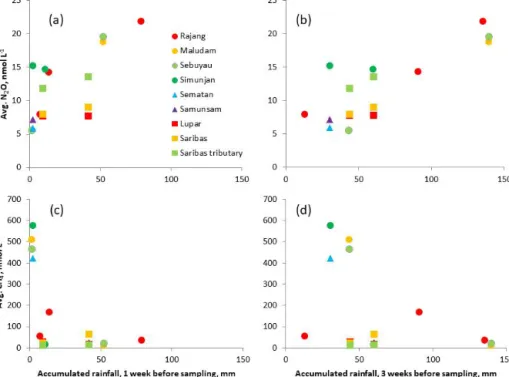
4.3 N2O/CH4concentrations and rainfall
Mean N2O concentrations showed linear correlations with accumulated rainfall during different periods from 1–4 weeks before the dates of sampling (Fig. 5, Table 6). Enhanced N2O emissions from (peat) soils are usually associated with rainfall when the water table approaches the soil surface (Couwenberg et al., 2010; Jauhiainen et al., 2016). A high water table, in turn, allows decomposition of previously de- posited fresh organic material (Jauhiainen et al., 2016) and, thus, will result in favourable conditions for microbial N2O production mainly via denitrification in a suboxic–anoxic soil environment (Espenberg et al., 2018; Pihlatie et al., 2004). N2O production via nitrification may be less impor- tant at a high water table (Pihlatie et al., 2004; Regina et al., 1996). Therefore, the positive linear relationship of the riverine N2O concentrations with rainfall might result from
Figure 4.CH4saturations along the salinity gradients of(a)Rajang,(b)Maludam,(c)Sebuyau,(d)Simunjan,(e)Sematan and(f)Samunsam.
The dashed lines indicate the equilibrium (100 %) saturation. The open circles depict measurements from August 2016, the filled red circles depict measurements from March 2017 and the filled blue circles depict measurements from September 2017.
enhanced N2O production in the adjacent soils drained by the rivers. A decreasing trend of N2O concentrations, which would be expected to be caused by enhanced river discharge after the rain events – which in turn can lead to dilution of the concentrations and enhanced fluxes across the river–
atmosphere interface (Alin et al., 2011) – is obviously out- competed by an enhanced input of N2O.
In contrast with N2O, the response of riverine or estuar- ine CH4concentrations to increasing rainfall does not result in increasing CH4concentrations (Fig. 5). When considering the periods of 1 or 1.5 weeks of accumulated rainfall there seems to be a pronounced decrease in CH4 concentrations with increasing rainfall (Fig. 5c and Table 6). This trend is no longer significant when considering the periods of 2–4 weeks of accumulated rainfall (Table 6). A closer inspection of the data reveals that the response to increasing rainfall seems to be different for individual rivers or estuaries. There is a clear negative relationship with rainfall for the Maludam, Se- buyau and Simunjan rivers, whereas no obvious trends were observed for the other rivers (Fig. 5c and d). Under the as- sumption that rainfall is a predictor for river discharge/high water we can argue that our results are in agreement with the often observed inverse relationship between CH4concentra- tions and river discharge (Anthony et al., 2012; Bouillon et al., 2014; Dinsmore et al., 2013; Hope et al., 2001). This re-
lationship can be explained by an interplay of various pro- cesses such as (i) a decrease in CH4concentrations caused by a higher water flow (i.e. dilution under the assumption that the net CH4production does not change significantly), (ii) higher flux across the river–atmosphere interface during periods of higher discharge (caused by an enlarged river sur- face area and/or a more turbulent water flow) (Alin et al., 2011) and (iii) the enhancement of CH4 oxidation during high waters: Sawakuchi et al. (2016) showed that CH4oxida- tion in blackwater rivers of the Amazon Basin was maximal during the high-water season.
4.4 Emission estimates
The N2O flux densities from the six rivers studied here are comparable to the N2O flux densities from other aqueous and soil systems reported from Borneo and other sites in SE Asia; see Table 4. The corresponding CH4 flux densi- ties are higher than the CH4flux densities reported for the Lupar and Saribas rivers but much lower than the flux densi- ties from drainage canals in Central Kalimantan and Suma- tra (Jauhiainen and Silvennoinen, 2012) (Table 4). Our CH4 flux densities are, however, comparable to recently published CH4 eddy covariance measurements (Tang et al., 2018) in the Maludam National Park, which is drained by the Malu- dam River, and measurements of the CH4release from peat
Figure 5.Average N2O and CH4concentrations for the individual rivers and estuaries vs. the accumulated rainfall amount during 1(a, c) and 3 weeks(b, d)before the dates of sampling. We also included the average N2O and CH4concentrations for the Lupar and Saribas rivers and the Saribas tributary from Müller et al. (2016a).
soils when the water table is high and CH4from rice pad- dies (Couwenberg et al., 2010); see Table 4. The mean an- nual N2O and CH4emissions for the individual rivers were calculated by multiplying the mean flux density,F, for each river (Table 4) with the river surface area given in Table 2.
The results are listed in Table 5. The resulting total an- nual N2O emissions for the rivers in NW Borneo – includ- ing the emissions from the Lupar and Saribas rivers (Müller et al., 2016a) – are 1.09 Gg N2O yr−1 (0.7 Gg N yr−1). This represents about 0.3–0.7 % of the global annual riverine and estuarine N2O emissions of 166–322 Gg N2O (106–
205 Gg N yr−1) recently estimated by Maavara et al. (2019).
The total annual CH4emissions from rivers in NW Borneo are 23.8 Gg CH4yr−1. This represents about 0.1 %–1 % of the global riverine and estuarine CH4 emissions of 2300–
33 400 Gg CH4yr−1(the emission range is based on the min- imum and maximum estimates given in Bange et al., 1994;
Bastviken et al., 2011; Borges and Abril, 2011; and Stanley et al., 2016). However, we caution that our estimates are as- sociated with a high degree of uncertainty because (i) our data are biased by the fact that for some rivers it was not pos- sible to cover the entire salinity gradient, (ii) seasonal and interannual variabilities of the N2O and CH4concentrations are not adequately represented in our data set, (iii) the wind- speed-driven gas exchange in estuaries is not adequately rep- resented, and (iv) the meank600used here is most probably too high (see Sect. 3.3), resulting in an overestimation of the emissions.
5 Summary and conclusions
N2O and CH4were measured in the Rajang, Maludam, Se- buyau and Simuntan rivers and estuaries in NW Borneo dur- ing two campaigns in March and September 2017. The Ra- jang River was additionally sampled in August 2016, and the Samunsam and Sematan rivers were additionally sampled in March 2017. The spatial and temporal variability of N2O and CH4 concentrations was large. N2O concentrations (satura- tions) ranged from 2.0 nmol L−1(28 %) in the Rajang River (at salinity=0 in August 2016) to 41.4 nmol L−1(570 %) in the Simunjan River (at salinity=0 in March 2017). CH4con- centrations (saturations) were in the range of 2.5 nmol L−1 (106 %) in the Simunjan River (at salinity=0 in Septem- ber 2017) to 1372 nmol L−1 (57 459 %) in the Simunjan River (at salinity=0 in March 2017). N2O concentrations showed a positive linear correlation with rainfall. We con- clude, therefore, that rainfall, which determines the N2O pro- duction or consumption in the surrounding soils, is the main factor determining the riverine N2O concentrations. N2O production in the blackwater rivers themselves seems to be low because of the low pH. CH4concentrations were high- est at salinity=0 and most probably result from methano- genesis as part of the decomposition of organic matter un- der anoxic conditions. CH4 concentrations in the blackwa- ter rivers showed an inverse relationship with rainfall. We suggest that enhanced CH4 oxidation in combination with a higher flux across the river–atmosphere interface during
Table 4.Overview of N2O and CH4flux densities from aqueous and soils ecosystems in SE Asia.
Site Location N2O flux density, CH4flux density, Measurement or Reference
nmol m−2s−1 nmol m−2s−1 sampling dates
Range Mean∗ Range Mean∗
Aqueous systems
Rajang River/Estuary Sarawak, NW Borneo −0.33 to 1.22 0.53 0.34 to 62 5.52 Aug 2016;
Mar, Sep 2017
This study Maludam
River/Estuary
Sarawak, NW Borneo −0.20 to 1.00 0.32 0.09 to 50 15.9 Mar, Sep 2017 Sebuyau River/Estuary Sarawak, NW Borneo −0.18 to 1.08 0.39 0.28 to 78 15.4 Mar, Sep 2017 Simunjan
River/Estuary
Sarawak, NW Borneo −0.31 to 2.20 0.50 0.01 to 88 18.7 Mar, Sep 2017 Sematan River/Estuary Sarawak, NW Borneo −0.11 to 0.04 −0.05 0.43 to 72 21.1 Mar 2017 Samunsam
River/Estuary
Sarawak, NW Borneo −0.13 to 0.19 0.05 0.95 to 63 21.7 Mar 2017
Lupar River/Estuary Sarawak, NW Borneo 0.04 to 0.04 0.04 0.59 to 0.84 0.72 Jun 2013; Mar 2014 Müller et al.
(2016a) Saribas River/Estuary Sarawak, NW Borneo 0.04 to 0.08 0.06 0.45 to 1.01 0.73 Jun 2013; Mar 2014
Saribas River tributary Sarawak, NW Borneo 0.37 to 0.39 0.38 0.81 to 4.84 2.83 Jun 2013; Mar 2014 Drainage canal, Kali-
mantan, settled
Central Kalimantan, S Borneo −0.02 to 0.03 0 0 to 943 119 Sep 2007; Apr 2008 Jauhiainen and Silvennoinen (2012) Drainage canal, Kam-
par, settled
Riau, eastern central Sumatra 0.03 to 5.80 0.73 0 to 3672 776 Sep 2007; Apr 2008 Drainage canal, Kam-
par, disturbed
Riau, eastern central Sumatra 0.02 to 0.84 0.20 2.17 to 281 64.4 Sep 2007; Apr 2008
Soil systems
Forest Sarawak, NW Borneo −0.03 to 0.20 0.08 −0.10 to 0.19 0.04 Aug 2002–Jul 2003 Melling et al.
(2005, 2007) Sago plantation Sarawak, NW Borneo 0.01 to 1.75 0.88 −0.17 to 2.36 1.10 Aug 2002–Jul 2003
Oil palm plantation Sarawak, NW Borneo 0.01 to 0.58 0.29 −0.76 to 0.11 −0.33 Aug 2002–Jul 2003 Undrained forest Central Kalimantan, S Borneo −0.09 to 1.16 0.02 NA NA Dry/wet seasons in
2000/2001
Jauhiainen et al.
(2012) Drained forest Central Kalimantan, S Borneo −0.42 to 22.9 1.11 NA NA Dry/wet seasons in
2001/2002; monitor- ing 2004–2007 Drained recovering
forest
Central Kalimantan, S Borneo −0.06 to 0.45 0.02 NA NA Dry/wet seasons in 2001/2002 Drained burned peat Central Kalimantan, S Borneo −0.70 to 0.88 0.11 NA NA Dry/wet seasons in
2001/2002; monitor- ing 2004–2007 Agricultural peat in
Kalampagan
Central Kalimantan, S Borneo −0.95 to 0.89 0.12 NA NA Dry/wet seasons in 2001/2002 Agricultural peat in
Marang
Central Kalimantan, S Borneo −0.86 to 0.59 0.07 NA NA Dry/wet seasons in 2001/2002
Canopy soil of oil palm Jambi, eastern central Sumatra NA 0.001 NA 0.0004 Feb 2013–May 2014 Allen et al. (2018)
Drained burned land Central Kalimantan, S Borneo NA 0.001 NA 21.1 Jul 2011 Ishikura et al.
(2018)
Drained forest Central Kalimantan; S Borneo NA 0.08 NA 0.23 Jul 2011
Undrained forest Central Kalimantan, S Borneo NA 0.15 NA 17.6 Jul 2011
Drained agricultural land (fertilized)
Various locations in SE Asia 0.81 to 29.3 10.3 0.05 to 6.74 3.39 Various dates Couwenberg et al.
(2010): Review of results from vari- ous studies.
Drained, open vegeta- tion (abandoned, not fertilized)
Various locations in SE Asia −0.12 to 0.45 0.08 NA NA Various dates
Forested (drained and undrained peat swamp, agro-forestry)
Various locations in SE Asia −0.06 to 1.51 0.39 −0.73 to 11.6 5.45 Various dates
Rice paddies Various locations in SE Asia −0.04 to 0.23 0.07 7.17 to 98.1 52.7 Various dates
Peat soil Various locations in SE Asia NA NA 0 to 52.1 26.0 Various dates
Maludam Natl. Park Sarawak, NW Borneo NA NA NA 23.1 Nov–Dec 2013 Tang et al. (2018)
∗Values in italics indicate a mean flux density computed from the range given in the table (when no mean flux density was given in the reference). NA stands for not available/not measured.
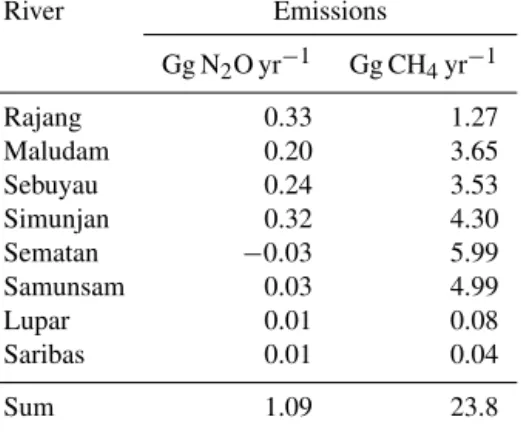
Table 5.Mean annual emissions of N2O and CH4from rivers and estuaries in NW Borneo. The estimates for the Lupar and Saribas rivers are from Müller et al. (2016a).
River Emissions
Gg N2O yr−1 Gg CH4yr−1
Rajang 0.33 1.27
Maludam 0.20 3.65
Sebuyau 0.24 3.53
Simunjan 0.32 4.30
Sematan −0.03 5.99
Samunsam 0.03 4.99
Lupar 0.01 0.08
Saribas 0.01 0.04
Sum 1.09 23.8
Table 6. Correlation coefficients (r) of the linear correlations be- tween the accumulated rainfall for different periods before the dates of sampling and the average N2O/CH4concentrations of the vari- ous rivers and estuaries. Values in bold are significant at the 99 % level and values in italics are significant at the 95 % level;n=17.
Weeks of accumulated N2O CH4 rainfall before sampling
1 0.7059 0.5744
1.5 0.8075 0.5781
2 0.8095 0.4671
2.5 0.8220 0.3746
3 0.8232 0.4363
3.5 0.7203 0.1871
4 0.7018 0.3114
periods of higher river flow (after rainfall events) is re- sponsible for the reduction in the CH4concentrations along the salinity gradient. The rivers and estuaries studied here were an overall net source of N2O and CH4 to the at- mosphere. The total annual N2O and CH4 emissions were 1.09 Gg N2O yr−1(0.7 Gg N yr−1) and 23.8 Gg CH4yr−1, re- spectively. This represents about 0.3 %–0.7 % of the global annual riverine and estuarine N2O emissions and about 0.1 %–1 % of the global riverine and estuarine CH4 emis- sions. Rivers and estuaries in NW Borneo contribute only 0.05 % (=7.9×10²km2including the surface areas of the Lupar and Saribas rivers; Müller et al., 2016a) to the global water surface area of rivers and estuaries (=1.7×10⁶km2; Maavara et al., 2019). Therefore we conclude that rivers and estuaries in NW Borneo contribute significantly to the global riverine and estuarine emissions of both N2O and CH4.
The environment of Borneo (and SE Asia) is affected by rapid changes due to (i) anthropogenic activities such as con- version of peatland into oil palm plantations (see, e.g., Austin et al., 2018; McAlpine et al., 2018; Schoneveld et al., 2019) and (ii) climatic changes (see, e.g., Sa’adi et al., 2017a, b;
Tang, 2019) which, in turn, could significantly affect N2O and CH4 emissions from soils (see, e.g., Jauhiainen et al., 2016; Oktarita et al., 2017). But little is known about how these changes will affect N2O and CH4emissions from aque- ous systems such as rivers and estuaries in the future. The ob- vious relationship of N2O and CH4concentrations and rain- fall could be used to predict future concentrations and its as- sociated emissions to the atmosphere. However, the trends of rainfall and river discharge in Borneo show a high local vari- ability and no general common trend (Sa’adi et al., 2017a;
Tang, 2019). Therefore, predictions of future trends of N2O and CH4emissions will be associated with a high degree of uncertainty. In order to improve our knowledge of predicted future changes in N2O and CH4riverine or estuarine emis- sions, we suggest establishing regular measurements in the rivers and along the salinity gradients. This will help deci- pher the temporal and spatial variability of N2O and CH4 emissions from tropical rivers and estuaries. Moreover, stud- ies of the relevant production or consumption pathways (and their main driving factors) for both gases are required. A suit- able framework for this could be the recently published con- cept of the global N2O Ocean Observation Network (N2O- ON) (Bange et al., 2019).
Data availability. All N2O/CH4data presented here are archived in and available from the MEMENTO (the MarineE MethanE and NiTrous Oxide) database: https://memento.geomar.de (last access:
4 November 2019).
Author contributions. MM, CHS, AM and HWB designed the study. CHS performed the sample preparation during the cam- paigns. DB and JK performed the N2O/CH4measurements with support from AK. HWB prepared the paper with contributions from all co-authors.
Competing interests. The authors declare that they have no conflict of interest.
Special issue statement. This article is part of the special issue
“Biogeochemical processes in highly dynamic peat-draining rivers and estuaries in Borneo”. It is not associated with a conference.
Acknowledgements. We would like to thank the Sarawak Forestry Department and Sarawak Biodiversity Centre for permission to con- duct collaborative research in Sarawak waters under permit num- bers NPW.907.4.4(Jld.14)-161, Park Permit no. WL83/2017 and SBC-RA-0097-MM. We are very grateful to the boat men who helped us to collect samples, in particular Lukas Chin, Captain Juble and their crew during the Rajang River and eastern region cruises and Minhad and Pak Mat while sampling the western region. We are grateful to Claire Evans and Joost Brandsma for their participation in planning the overall research project and helping to lead expedi-
tions to the Maludam, Sebuyau and Simunjan rivers. Faddrine Yang, Gonzalo Carrasco, Florina Richard and Fakharuddin Muhamad as- sisted greatly during fieldwork and with logistics. We thank Ed- win Sia and Faddrine Holt for the fantastic support of the N2O/CH4 sampling during the fieldwork campaigns. We acknowledge the help of Lasse Sieberth with the N2O/CH4measurements. We thank two anonymous reviewers for their comments, which helped to im- prove the paper significantly.
Financial support. This research has been supported by the Newton-Ungku Omar Fund (grant no. NE/P020283/1), the MOHE FRGS 15 Grant (grant no. FRGS/1/2015/WAB08/SWIN/02/1) and the SKLEC Open Research Fund (grant no. SKLEC-KF201610).
The article processing charges for this open-access publication were covered by a Research
Centre of the Helmholtz Association.
Review statement. This paper was edited by Palanisamy Shan- mugam and reviewed by two anonymous referees.
References
Alin, S. R., Rasera, M. d. F. F. L., Salimon, C. I., Richey, J. E., Holtgrieve, G. W., Krusche, A. V., and Snidvongs, A.: Physical controls on carbon dioxide transfer velocity and flux in low-gradient river systems and implications for re- gional carbon budgets, J. Geophys. Res.-Biogeo., 116, G01009, https://doi.org/10.1029/2010JG001398, 2011.
Alkhatib, M., Jennerjahn, T. C., and Samiaji, J.: Biogeochemistry of the Dumai River estuary, Sumatra, Indonesia, a tropical black- water river, Limnol. Oceanogr., 52, 2410–2417, 2007.
Allen, K., Hassler, E., Kurniawan, S., Veldkamp, E., and Correa, M. D.: Canopy soil of oil palm plantations emits methane and nitrous oxide, Soil Biol. Biochem., 122, 1–6, 2018.
Anthony, S. E., Prahl, F. G., and Peterson, T. D.: Methane dynamics in the Willamette River, Oregon, Limnol. Oceanogr., 57, 1517–
1530, 2012.
Austin, K. G., Harris, N. L., Wijaya, A., Murdiyarso, D., Harvey, T., Stolle, F., and Kasibhatla, P. S.: A review of land-based green- house gas flux estimates in Indonesia, Environ. Res. Lett., 13, 055003, https://doi.org/10.1088/1748-9326/aab531, 2018.
Bange, H. W.: Gaseous nitrogen compounds (NO, N2O, N2, NH3) in the ocean, in: Nitrogen in the Marine Environment, 2nd Edn., edited by: Capone, D. G., Bronk, D. A., Mulholland, M. R., and Carpenter, E. J., Elsevier, Amsterdam, 2008.
Bange, H. W., Bartell, U. H., Rapsomanikis, S., and Andreae, M.
O.: Methane in the Baltic and North Seas and a reassessment of the marine emissions of methane, Global Biogeochem. Cy., 8, 465–480, 1994.
Bange, H. W., Arévalo-Martínez, D. L., de la Paz, M., Farías, L., Kaiser, J., Kock, A., Law, C. S., Rees, A. P., Re- hder, G., Tortell, P. D., Upstill-Goddard, R. C., and Wil- son, S. T.: A harmonized nitrous oxide (N2O) ocean obser- vation network for the 21st century, Front. Mar. Sci., 6, 157, https://doi.org/10.3389/fmars.2019.00157, 2019.
Barnes, J. and Upstill-Goddard, R. C.: N2O seasonal distribution and air-sea exchange in UK estuaries: Implications for tropo- spheric N2O source from European coastal waters, J. Geophys.
Res., 116, G01006, https://doi.org/10.1029/2009JG001156, 2011.
Bastian, D.: N2O und CH4Verteilung in Ästuaren und Flüssen im Nordwesten von Borneo, 2017, BSc thesis, Kiel University, Kiel, 50 pp., 2017.
Bastviken, D., Tranvik, L. J., Downing, J. A., Crill, P.
M., and Enrich-Prast, A.: Freshwater methane emis- sions offset continental carbon sink, Science, 331, 50, https://doi.org/10.1126/science.1196808, 2011.
Baum, A., Rixen, T., and Samiaji, J.: Relevance of peat draining rivers in central Sumatra for the riverine input of dissolved or- ganic carbon into the ocean, Estuar. Coast. Shelf S., 73, 563–570, 2007.
Beaulieu, J. J., Tank, J. L., Hamilton, S. K., Wollheim, W. M., Hall, R. O., Mulholland, P. J., Peterson, B. J., Ashkenas, L. R., Cooper, L. W., Dahm, C. N., Dodds, W. K., Grimm, N. B., Johnson, S.
L., McDowell, W. H., Poole, G. C., Valett, H. M., Arango, C.
P., Bernot, M. J., Burgin, A. J., Crenshaw, C. L., Helton, A. M., Johnson, L. T., O’Brien, J. M., Potter, J. D., Sheibley, R. W., Sobota, D. J., and Thomas, S. M.: Nitrous oxide emission from denitrification in stream and river networks, P. Natl. Acad. Sci.
USA, 108, 214–219, 2011.
Blum, J.-M., Su, Q., Ma, Y., Valverde-Pérez, B., Domingo-Félez, C., Jensen, M. M., and Smets, B. F.: The pH dependency of N-converting enzymatic processes, pathways and microbes: ef- fect on net N2O production, Environ. Microbiol., 20, 1623–1640, 2018.
Borges, A. V. and Abril, G.: Carbon dioxide and methane dynam- ics in estuaries, in: Treatise on estuarine and coastal science – Vol. 5, Biogeochemistry, edited by: Wolanski, E. and McLusky, D., Academkic Press, Waltham, 2011.
Borges, A. V., Darchambeau, F., Teodoru, C. R., Marwick, T. R., Tamooh, F., Geeraert, N., Omengo, F. O., Guérin, F., Lambert, T., Morana, C., Okuku, E., and Bouillon, S.: Globally signifi- cant greenhouse-gas emissions from African inland waters, Nat.
Geosci., 8, 673–642, 2015.
Borges, A. V., Darchambeau, F., Lambert, T., Bouillon, S., Morana, C., Brouyère, S., Hakoun, V., Jurado, A., Tseng, H. C., Descy, J.
P., and Roland, F. A. E.: Effects of agricultural land use on fluvial carbon dioxide, methane and nitrous oxide concentrations in a large European river, the Meuse (Belgium), Sci. Total Environ., 610–611, 342–355, 2018.
Bouillon, S., Yambélé, A., Gillikin, D. P., Teodoru, C., Dar- chambeau, F., Lambert, T., and Borges, A. V.: Contrast- ing biogeochemical characteristics of the Oubangui River and tributaries (Congo River basin), Sci. Rep.-UK, 4, 5402, https://doi.org/10.1038/srep05402, 2014.
Brase, L., Bange, H. W., Lendt, R., Sanders, T., and Dähnke, K.:
High resolution measurements of nitrous oxide (N2O) in the Elbe estuary, Frontiers in Marine Science, 4, 2017.
Couwenberg, J., Dommain, R., and Joosten, H.: Greenhouse gas fluxes from tropical peatlands in south-east Asia, Glob. Change Biol., 16, 1715–1732, 2010.
Dinsmore, K. J., Billett, M. F., and Dyson, K. E.: Temperature and precipitation drive temporal variability in aquatic carbon and