https://doi.org/10.1007/s00227-019-3620-3 ORIGINAL PAPER
Thermal performance of the European flat oyster, Ostrea edulis (Linnaeus, 1758)—explaining ecological findings under climate change
Charlotte Eymann1 · Sandra Götze1 · Christian Bock1 · Helga Guderley2 · Andrew H. Knoll3 · Gisela Lannig1 · Inna M. Sokolova4 · Martin Aberhan5 · Hans‑O. Pörtner1
Received: 20 April 2019 / Accepted: 6 November 2019
© Springer-Verlag GmbH Germany, part of Springer Nature 2020
Abstract
Climate change challenges marine organisms by constraining their temperature-dependent scope for performance, fitness, and survival. According to the concept of Oxygen and Capacity Limited Thermal Tolerance (OCLTT), the overall thermal performance curve relates to an organism’s aerobic power budget, its overall aerobic scope for growth, exercise, reproduction, and other performances. We hypothesize that physiological principles shaping tolerance in extant ecosystems have also been operative during climatic changes in the distant past. To compare response patterns in extant fauna and their palaeo-relatives, we started here by studying the metabolic background of performance in the European flat oyster Ostrea edulis at organismic and cellular levels, focusing on the acute thermal window and the metabolic changes towards upper lethal temperatures. We investigated the response of the oysters (pre-acclimated at 12 °C) to a short-term warming protocol (by 2 °C every 48 h) from 14 to 36 °C which we identified as the lethal temperature. At the organismic level, heart and filtration rates were recorded.
Gill metabolites were studied by 1H NMR spectroscopy to address thermal responses at the cellular level. Feeding activity by O. edulis (assessed by the filtration rates) was highest between 18 and 24 °C when overall energy expenditure (indicated by heart rate as a proxy for routine metabolic rate) was moderate. We conclude that this range reflects the thermal optimum of this species. Beyond 26 °C, the gill tissue of O. edulis became partly anaerobic, and cardiac dysfunction (arrhythmia) developed at 28 °C followed by an Arrhenius break point (30 °C). This mirrors performance constraints and indicates a wide temperature range of passive tolerance which may be a long-standing characteristic of ostreids supporting survival in extreme environments as well as during past and present climate oscillations.
Introduction
Marine ecosystems are currently challenged by increasing atmospheric CO2 concentrations and associated climate change, which cause ocean warming, acidification, and pro- gressive hypoxia, the latter as a result of reduced oxygen solubility and increased water column stratification (Sabine et al. 2004; Hoegh-Guldberg and Bruno 2010; Pörtner 2014). Temperature is a key driver of ongoing global change.
Charlotte Eymann and Sandra Götze were the lead authors contributing equally to this paper.
Responsible Editor: A. E. Todgham.
Reviewed by undisclosed experts.
* Hans-O. Pörtner Hans.Poertner@awi.de
1 Alfred Wegener Institute Helmholtz Centre for Polar and Marine Research, Am Handelshafen 12, 27515 Bremerhaven, Germany
2 Department of Biology, Institut de Biologie Integrative et des Systemes, 1030 Avenue de la Medecine Universite Laval, Quebec, QC G1V 0A6, Canada
3 Department of Organismic and Evolutionary Biology, Harvard University, Cambridge, MA 02138, USA
4 Marine Biology, Faculty of Mathematics and Natural Sciences, University of Rostock, Rostock, Germany
5 Museum für Naturkunde, Leibniz Institute for Evolution and Biodiversity Science, 10115 Berlin, Germany
Under unabated warming, the global mean ocean surface temperature is expected to increase by 1.8–4 °C by the end of the twenty-first century (Rhein et al. 2013). This will drive shifts in the geographical and depth distribution of spe- cies (Beukema et al. 2009; Calosi et al. 2016; Koenigstein et al. 2016), leading to shifts in the composition of marine communities, reduced complexity of benthic habitat and loss of some species (e.g., Garrabeu et al. 2009; Bertolino et al.
2015; Cattaneo-Vietti 2018). The impact of warming on marine organisms is likely to depend on their fundamental thermal niche relative to the realized niche occupied in their current habitats, so that species living near their thermal tol- erance limits will be harmed by warming, while those living at temperatures below their thermal optimum may benefit from warming, e.g., through increased growth, reproduction, or recruitment (Shepard et al. 2010).
The changes in the ocean projected for this century and beyond may reach extreme values depending on emissions scenarios and extreme events such as marine heat waves.
Similar to projections of ecosystem changes caused by ongo- ing climate change, past ocean changes of the three drivers of marine global change even larger than those anticipated for the twenty-first century, caused ecological crises charac- terized by species losses and distributional changes (Bam- bach et al. 2004; Knoll et al. 2007; Joachimski et al. 2012).
During the end-Permian mass extinction 252 million years ago, over 80% of the marine fauna went extinct, as sea sur- face temperatures increased by up to 11 °C (Wignall and Twitchett 1996; Stanley 2016; Penn et al. 2018). Experi- mental studies of extant fauna simulating different climate futures support a basic understanding of how climate change will impact marine fauna and how it may have done so in the distant past, assuming similar physiological mechanisms in place. As the capacities of individual species and functional groups to cope with environmental changes may differ, com- parative studies of extant relatives of species and groups may provide explanations of ongoing ecological change as well as patterns of extinction as observed in the palaeo-record of past evolutionary crises.
Temperature is an abiotic factor with a pervasive effect on all levels of an animal’s physiology and aerobic performance (Hochachka and Somero 2002; Pörtner 2014). The relation- ship between temperature and organism performance has been described by the oxygen- and capacity-limited thermal tolerance (OCLTT) concept established by Pörtner (2001) and Pörtner et al. (2009, 2017). According to OCLTT, the range of active thermal tolerance is the thermal range of sur- vival at individual to population levels, since maintenance costs and additional functions, such as growth, reproduction, and species interactions are fully covered by aerobic metabo- lism. The more temperature exceeds the optimum range, the more aerobic power budget decreases beyond pejus limits (conditions are getting worse) due to an over-proportional
rise in energetic costs which demand an increasing fraction of oxygen supply, finally resulting in the onset of anaero- biosis (beyond a critical temperature), and ultimately, death of the organism. Accordingly, the OCLTT concept helps to understand physiological capacities of a species in rela- tion to their environmental niches (Pörtner et al. 2017). Key parameters required to understand the effects of temperature on aerobic power scope include measures of energy demand [such as the oxygen uptake rate (MO2)], as well as the traits related to oxygen uptake and distribution (including venti- lation rates, cardiac function, and blood oxygen content), ideally combined with whole animal performance indica- tors such as growth, activity, or reproduction. Further driv- ers such as ocean acidification or hypoxia may influence these basic responses to temperature as well as the respective OCLTT indicators.
Previous studies have shown a strong positive correla- tion between MO2 and heart rate in marine invertebrates (HR, Marshall and McQuaid 1992; Schiffer et al. 2014;
Bakhmet 2017), and HR measurements have been used to determine thermal tolerance windows in mollusks (Zittier et al. 2015; Xing et al. 2016). Heart rate (HR) was shown to increase exponentially with increasing temperature until reaching a species-specific break point beyond which HR dropped in mollusks and crustaceans (Widdows 1973; Fred- erich and Pörtner 2000; Braby and Somero 2006; Xing et al.
2016). The cardiograms of stressed molluscs also displayed arrhythmic and asystolic heart beats (Nicholson 2002; Dom- nik et al. 2016).
Filtration rate is another important performance indicator in bivalves. Temperature-dependent filtration rate is a major contributor to the aerobic power budget of bivalve mollusks, because filtration is essential for both oxygen uptake at the gills and nutrient delivery. In bivalves, filtration rates are strongly affected by temperature (Møhlenberg and Riisgård 1978; Jørgensen et al. 1990), reflecting altered water viscos- ity (Petersen et al. 2003) and metabolic capacity (Specht and Fuchs 2018), with consequences for an organism’s energy budget. Therefore, the temperature window, where cardiac function and filtration rates can be optimally or at least ade- quately maintained is linked with the thermal tolerance limit, where long-term energy homeostasis and positive aerobic power scope can be sustained. While the overall metabolic balance involving optimal cardiac performance and oxygen and food uptake (e.g., through filtration) ensures long-term survival and fitness of an organism, the ability to withstand extreme warming (such as can occur during prolonged heat waves) is important in determining the thermal tolerance limits.
During warming, the transition to partial anaerobiosis occurs well before the lethal temperature is reached. In parallel, metabolic depression may reduce energy demand extending survival. Transition to partial anaerobiosis might
be related to a critical decrease in the oxygen content of the mantle cavity as also seen in the body fluids of other invertebrates (Taylor 1976; Brinkhoff et al. 1983; review by De Zwaan and Wijsmann 1976), reflecting a mismatch between oxygen supply and demand (e.g., Frederich and Pörtner 2000; Melzner et al. 2007; Giomi and Pörtner 2013).
As part of a larger effort to systematically compare the vulnerability of various bivalve groups to climate change (ongoing and during the geological past, DFG-funded Research Group Tersane), we study the development of thermal constraints in the European flat oyster Ostrea edu- lis (O. edulis, Linnaeus, 1758), a molluscan keystone spe- cies that occurs naturally in the North-Eastern Atlantic, from the Norwegian coast down to Morocco, and in the entire Mediterranean Basin (FAO). When measuring sur- vival, filtration rate, heart rate, and cellular biomarkers for anaerobiosis, we follow the hypothesis that physiological principles identified in extant fauna have also shaped the sur- vival, performance, geographical distribution, and demise of related marine fauna in the distant past (Pörtner et al. 2005;
Knoll et al. 2007). Responses to climate-induced changes in ambient drivers such as temperature, CO2 and oxygen (Penn et al. 2018) can in fact constrain geographical distribu- tion. However, associated extinction risks are not sufficiently considered (Finnegan et al. 2015). As a first step, we aim to link the observed temperature-induced changes at dif- ferent functional levels and define the oyster’s fundamental thermal niche for later comparison to other bivalve species and groups in extant fauna and palaeo-analogues. We chose oysters as a model organism, because fossils suggest that this clade shows relatively high tolerance to environmental perturbation as well as strong competitiveness against other molluscan species (Guo et al. 2018).
Materials and methods
Animal origin and maintenanceAdult, raft cultured Ostrea edulis grown in the estuary of Vigo (Spain, CF-139: Ría de Ferrol 43º 27.86 N, 8º 11.84 W;
CF-168; Ria de Ares 43º 24.82, N 8º 09.70 W; and CF-095 Ria de Ares 43º 24.55, N 8º 10.16 W) and exposed to the full range of natural environmental conditions, were obtained from the Biological Station of Toralla (ECIMAT, University of Vigo) in spring 2017. Environmental conditions at the time of collection were as follows: water temperature ~ 14 °C and a salinity of ~ 33 PSU. Oysters had an average size of 6.7 ± 0.5 cm in length, and 6.5 ± 0.7 cm in width. The mean total weight was 63 ± 12 g. Oysters were wrapped in wet tis- sues and transported to the Alfred-Wegener Institute Helm- holtz Center for Polar and Marine Research (AWI, Bremer- haven) by the air within 24 h after collection. Upon arrival,
the animals were immediately transferred to the institutional aquarium system filled with North Sea water (SW, 12 °C, 32 PSU) and pre-acclimated for at least 2 weeks. They were fed every other day either with a commercial algal blend (Nyos, PhytoMaxx) or a self-cultivated algal mixture containing Rhodomonas sp., Phaeodactylum tricornutum, Chaetocerus sp., and Isochrysis galbana. Prior to the experiments, epibi- onts were carefully removed and each oyster was measured, weighed and individually labelled.
Experimental setup and water chemistry
Randomized groups of labelled oysters were transferred to constant temperature rooms and incubated at 12 °C in recir- culating aquarium systems as described in Schalkhausser et al. (2013). Briefly, the system consisted of header, receiver, and reservoir tanks and several experimental tanks, that were either populated with individual oysters (animals used for simultaneous recordings of heart rate, see below) or several oysters (15–20 oysters per 27 L tanks) later used for tissue sampling. Oxygenation in all flow-through tanks was kept > 90% by continuous aeration (see Table 1). Through- out all experiments, oysters were fed by regular addition of a self-cultivated algal mixture. Algal concentrations were maintained at a minimum of 3000 cells mL−1 SW. Every day, the experimental tanks were checked for mortality and fae- ces, and cleaned if necessary. After a 3 day pre-acclimation period to allow for recovery from handling, temperature was increased within 5 h overnight by 2 °C once every 48 h and kept at the targeted value ± 0.5 °C (see Table 1) for 40–43 h.
Measurements were performed and samples taken at 14 °C, 18 °C, 22 °C, 26 °C, 30 °C, 32 °C, and 34 °C, respectively.
Heart rate was monitored online throughout exposure and analyzed for each 2 °C temperature step. After warming to 36 °C all remaining oysters died within 18 h. This protocol was run in triplicate.
Water temperature, salinity, partial pressures of oxy- gen (PO2), and carbon dioxide PCO2) were monitored daily. PO2 was determined using O2-optodes (PreSens, Germany), and PCO2 was measured with a Vaisala device (Vaisala, Finland). The pH was measured using a pH elec- trode (InLab® Routine Pt1000, Mettler Toledo) calibrated with National Institute of Standards and Technology stand- ard pH buffer solutions (National Bureau of Standards, NBS standards, Fisher Scientific). pH was converted to pHFreescale (Waters and Millero 2013) as recommended in the guide for best practice in ocean acidification research (Riebesell et al. 2011). All devices were calibrated at the respective temperatures. The concentration of dissolved inorganic carbon (DIC) was determined using continuous flow analysis (CFA; QuAAtro, Seal Analytical) accord- ing to Stoll et al. (2001). Seawater carbonate chemistry parameters (total alkalinity, saturation state (Ω) for calcite,
and aragonite) were calculated using CO2SYS software (Lewis and Wallace 1998) using barometric pressure val- ues, as well as DIC, pH, temperature and salinity values determined for the respective day and temperature step.
For calculations, we used K1 and K2 from Millero and DiTrolio (2010), the KSO4 dissociation constant from Dickson (1990), freescale for seawater pH, and the [B]I value from Uppström (1974). Levels of nitrite, nitrate and ammonium were monitored and held below critical con- centrations by regular SW exchanges, approximately twice a week. Detailed seawater physiochemical conditions at each temperature step are shown in Table 1.
Filtration rate
Since oysters retained the algae with 100% efficiency, fil- tration rates (FR) were calculated as the decrease of Rho- domonas sp. concentration over time standardized to soft body dry weight (DW) (Møhlenberg and Riisgård 1978;
Nielsen et al. 2017). At each temperature step, the same individuals were placed in separate, temperature-controlled cylindrical 1 L tanks, and allowed to recover from handling stress for 1 h prior to the start of FR determination. Then, Rhodomonas sp. was added (final concentration 20,000 cells mL−1 to ensure sufficient algae provision for maximal FR) and samples were taken after 0, 15 and 30 min. Gentle bubbling during the experiment prevented the sedimenta- tion of algal cells. Algal concentration was measured with a MultisizerTM 3 Coulter Counter (Beckman; USA) fitted with a 100 µm aperture tube. Separate 1 L tanks fitted with shells only, served as controls for algal sedimentation, which was negligible. Directly after each animals’ death, soft body mass was taken and dried for 48 h at 80 °C.
The filtration rate (FR) was calculated according to Coughlan (1969) and is expressed as DW-specific rates (L h−1 gDW−1):
where V is the water volume of the experimental tank (L), t is the time (h), n is the number of individuals per tank (here, n = 1). C0 and Ct are the algal concentrations (cells mL−1) at time 0 and t, DW is the dry weight of the soft body mass (g).
Heart rate
Cardiac activity was measured using photo-plethysmography (Depledge and Andersen 1990; Zittier et al. 2015). The shell above the pericardium was sanded down carefully, and the plethysmograph (iSiTEC, Germany) was fixed (Pattex Ultra superglue, Germany). The signal was amplified (Type HBA- 100; iSiTEC, Germany) and recorded with the software Lab- Chart (ADInstruments, Australia). HRs of eight oysters in total were monitored throughout exposure, during 36 h per temperature step. HR data (beats per min, bpm) were ana- lyzed manually, excluding periods immediately after dis- turbances, such as the presence of researchers close to the experimental setup as well as low signal to noise ratios. This resulted in an analysis of 45 min recordings per temperature step using LabChart 8 Reader (ADInstruments, Australia).
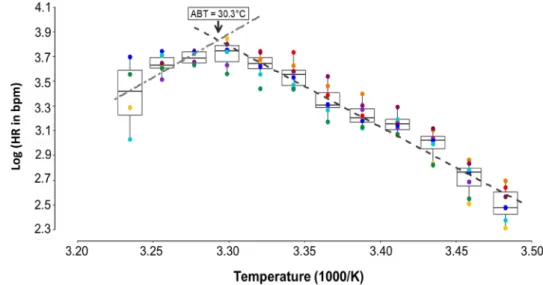
The whole plethysmograms of the 36 h recording were checked for pauses in the heart rate (≥ 15 min), which we defined as cardiac arrest (Fig. 1). Periods of cardiac arrest were expressed in % fractions of time in the total 36 h meas- urement period.
Tissue sampling and metabolite extraction
For tissue analyses, only open and ventilating oysters were randomly selected, weighed, and dissected on ice (n = 6-8). Oysters were checked regularly throughout the sampling day and only oysters that were open for at least 30 min prior to sampling were sacrificed. Tissues (gills, FR= V
(t∗n) ∗ln C0
Ct ∶DW,
Table 1 Summary of water chemistry parameters during acute warming exposures
Temperature, salinity, pHFreescale, PO2, and PCO2 were determined in water samples collected throughout the exposures. The total alkalinity (TA), ΩAragonite and ΩCalcite were calculated using CO2 sys software. Data are presented as mean ± SD (n = 18-27)
TNominal T (°C) Sal (SWU) pHFreescale PO2 (% air
saturation) PCO2 (µatm) TA (mmol/kg SW) ΩAragonite ΩCalcite
(°C) Mean ±SD Mean ±SD Mean ±SD Mean ±SD Mean ±SD Mean ±SD Mean ±SD Mean ±SD
14 14.05 0.34 32.74 1.14 8.185 0.021 91.44 1.09 404 36 2683.99 141.31 3.02 0.17 4.73 0.26 18 18.38 0.19 32.63 0.76 8.105 0.051 96.28 4.48 511 66 2629.19 194.07 2.88 0.49 4.47 0.76 22 22.03 0.23 32.98 0.76 8.031 0.039 97.69 2.01 583 62 2390.51 10.83 2.51 0.19 3.85 0.30 26 26.02 0.48 32.87 0.21 8.048 0.110 95.93 2.10 672 198 2321.84 150.92 2.62 0.81 3.97 1.24 30 29.85 0.57 33.22 0.32 8.027 0.106 94.07 2.60 612 171 2342.06 228.72 3.20 0.80 4.79 1.21 32 32.10 0.47 33.43 0.21 7.99 0.10 91.60 3.24 718 177 2374.16 264.50 3.11 0.84 4.68 1.25 34 34.16 0.38 33.60 0.78 8.056 0.074 92.41 3.19 633 105 2517.92 179.30 3.95 0.74 5.83 1.09
mantle, hepatopancreas, and muscle) were removed quickly, shock-frozen in liquid nitrogen, and stored at − 80 °C for further analyses. Gill metabolites were extracted using the methanol–chloroform extraction technique for small sam- ples as described in Tripp-Valdez et al. (2017). Gill tis- sue (40–50 mg) were homogenized in ice-cold methanol (8 mL g−1 tissue) and ice-cold MilliQ water (2.5 mL g−1 tis- sue) with Precellys 24 (Bertin Technologies, France) for 20 s at 6000 rpm at 4 °C. Thereafter, chloroform (8 mL g−1 tis- sue) and MilliQ (4 mLg−1 tissue) were added. The homoge- nate was vortexed, incubated on ice for 10 min, and centri- fuged for 10 min at 3000 rpm and 4 °C. The upper methanol layer, containing polar metabolites, was used und dried using a SpeedVac at RT (RVC 2–33 IR, Christ GmbH, Germany) overnight. Dried pellets were stored at 4 °C until further analysis. Prior to analysis each pellet was re-suspended in a defined volume of deuterized water (D2O), twofold of the initial tissue weight. D2O contained 0.05 wt% of 3-(tri- methylsilyl) propionic-2,2,3,3-d4 acid, sodium salt (TSP) (Sigma Aldrich, St. Louis, USA) as an internal standard and chemical shift reference. Final TSP concentration in each sample was 3.2 mM.
Untargeted 1H NMR‑based metabolic profiling One-dimensional 1H-NMR spectroscopy was conducted in an ultra-shielded vertical 9.4 T NMR spectrometer (Advance III HD 400 WB, Bruker-BioSpin GmbH, Germany) using a high-resolution magic angle (HRMAS) probe for small vol- umes. The suspension was transferred into a standard 50 µl zirconia on rotor of a triple tuneable 1H-31P-31C HRMAS probe. Sample spinning rate was 3000 Hz at 20 °C. TOP- SPIN 3.2 software (TopSpin 3.2, Bruker-BioSpin GmbH, Germany) was used for acquisition. The NMR protocol comprised four different techniques as described in detail by Schmidt et al. (2017). The Call-Purcell-Meiboom-Gill (CPMG) sequence was used for metabolite analysis and quantification. Each spectrum was baseline, shim, and phase corrected and calibrated to the TSP signal with the soft- ware Chenomx NMR suite 8.1 (Chenomx Inc., Canada).
Thereafter, the 1H-NMR signals within each spectrum were assigned to metabolites by their chemical shifts using the Chenomx database. After assignment, the integration rou- tine within Chenomx was used for metabolite quantifica- tion based on the TSP standard concentration. The concen- trations of the proteinogenic branched chain amino acids valine, leucine, and isoleucine were summed for analysis.
Statistical analysis
The statistical analysis for temperature impacts on heart rate (HR) and filtration rate (FR) was performed with Sig- maPlot 3.5 (Systat software Inc.). The temperature-induced changes in HR and FR were detected by one-way repeated ANOVA followed by a pairwise post-hoc Holm–Sidak test.
An Arrhenius plot was used to detect discontinuities in the temperature-dependent slopes of HR and the Arrhenius break temperatures (ABTs) were calculated from intersec- tions of linear regressions (Nickerson et al. 1989; Yeager and Ultsch 1989).
The temperature-dependent performance curve of FRF was fitted according to Schmalenbach et al. (2009):
where A, B and x0 are coefficients of variation and x are FRs at ambient temperature.
The temperature-dependent performance curve of HRF
was fitted according to Pörtner and Knust (2007)
F1 (T) describes the temperature-dependent increase of HR until maximum. F2 (T) represents the declining course in HR.Gill metabolic profiles were analyzed for changes using Metaboanalyst (Metaboanalyst 3.6; Xia and Wishart 2016).
Compound concentrations were normalized by general- ized log-transformation for stabilizing the variance across FRF(T) =Ae
−0.5
⎛⎜
⎜⎝
ln
�x x0
� B
⎞⎟
⎟⎠
2
,
HRF(T) =F
1(T) +F
2(T) =(
A1eB1T+C
1
)+(
A2eB2T+C
2
), Fig. 1 Cardiac arrest of O. edu-
lis. Red, dashed lines symbolize the onset and end of a cardiac arrest period. Y-axis illustrates the cardiac amplitude in voltage oscillations (V). Single spikes during the cardiac arrest periods are due to technical errors
metabolites as described by Purohit et al. (2004). Thereaf- ter, a univariate one-way ANOVA followed by a Tukey’s HSD was performed. The multivariate analysis comprised an unsupervised principle component analysis (PCA) aim- ing to find the directions that best explained the variance in the data set. Furthermore, we performed a supervised par- tial least–square discriminant analysis (PSL-DA) for class separation taking the weighted sum of squares of the PSL loadings (= Variable Importance in Projection; VIP) into account. The significance threshold was set to P < 0.05.
Results
MortalityMortality of the oysters throughout exposure was negligible (< 7%) until 36 °C was reached. The remaining oysters died during the first 18 h after reaching 36 °C.
Filtration rate
Filtration rates (FR) of O. edulis had an optimum between 18 and 26 °C (Fig. 2; repeated one-way ANOVA, F = 8.10, DF = 6, P < 0.001). Individuals varied more in absolute FR values at 26 °C compared to other temperatures. Mean FR increased from 3.0 ± 2.0 L h−1 gDW−1 at 14 °C to a maximum of 7.7 ± 4.5 L h−1 g DW−1 at 22 °C followed by a progressive decrease resulting in a minimal FR of 0.3 ± 0.3 L h−1 g DW−1 at 34 °C.
Heart rate
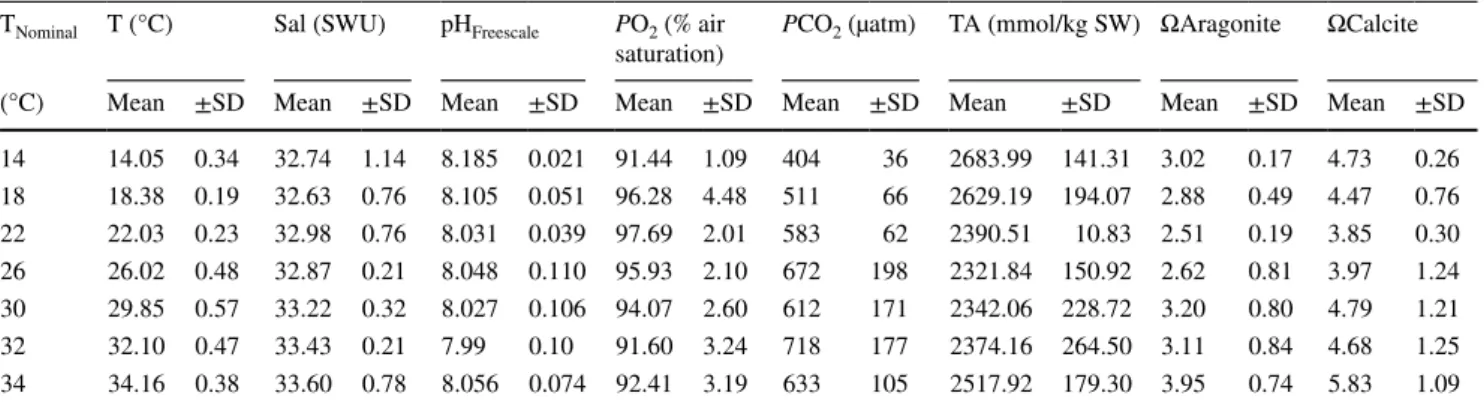
Heart rate (HR, Fig. 3) increased from 11.98 ± 1.88 bpm at 14 °C and reached 41.54 ± 4.34 bpm at 30 °C, with a mean linear increase of 1.85 ± 0.70 bpm °C−1. Fur- ther warming from 30 to 36 °C decreased HR at a rate of 1.81 ± 1.66 bpm °C−1 leading to an HR of 30.69 ± 7.53 bpm at 36 °C. The calculated Arrhenius break temperature was
Fig. 2 Filtration rate (FR) of O.
edulis. Each colored point indi- cates an individual. Boxplots show the variations of FR at the ambient temperature. Asterisk and horizontal line denote a sig- nificant difference of FRs at 18, 22 and 26 °C from FRs at lower/
higher temperatures (repeated one-way ANOVA, Holm-Sidak Test, F = 8.10, P < 0.001). Non- linear regressions (dashed line) show the modelled FR after Schmalenbach et al. (2009):
FRF(T) =8.487e−0.5
(ln(20.68x )
0.25 )2
, r2 = 0.41. n = 6-7
Fig. 3 Impact of acute warming on heart rate (HR) of. O. edulis.
HRs of individuals are indicated by different colors. Different let- ters indicate significant changes between temperature steps (repeated one-way ANOVA, Holm-Sidak Test, F = 96.86, P < 0.001). Nonlinear regres- sion after Pörtner and Knust (2007) is shown as dashed line:
HRF(T) =(
10.83 ∗ e0.06097∗T +3.57e008) + (−0.0215
∗ e0.2177∗T−3.57e008) r2 = 0.90. n = 4-8 ,
30.33 °C (Fig. 4). From 14 to 26 °C HR showed a regular heart beat rhythm with increasing frequency and ampli- tude at increasing temperatures (Fig. 5a, b). At 28 °C ani- mals started to show temporary cardiac arrhythmia which was counterbalanced by high cardiac activity up to 30 °C (Fig. 5c). The frequency of arrhythmia increased with ris- ing temperatures, combined with a significantly reduced HR at 36 °C (repeated one-way ANOVA, F = 96.86, DF = 6, P < 0.001).
Ostrea edulis showed temperature-dependent peri- ods of cardiac arrest (Fig. 5d), which could be divided in three phases: From 14 to 22 °C the occurrence of cardiac arrests increased slightly from 0.2 ± 0.1% to 1.3 ± 0.3%
of the recording time. At 24 °C and 26 °C, cardiac arrests reached a maximum at 3.8 ± 0.7% of total measurement time (one-way ANOVA, F = 16.154, DF = 11, P < 0.001). Above 26 °C cardiac arrest was rare and only observed at 32 °C (0.15 ± 0.06%) and 36 °C (0.53 ± 0.15%).
Metabolites
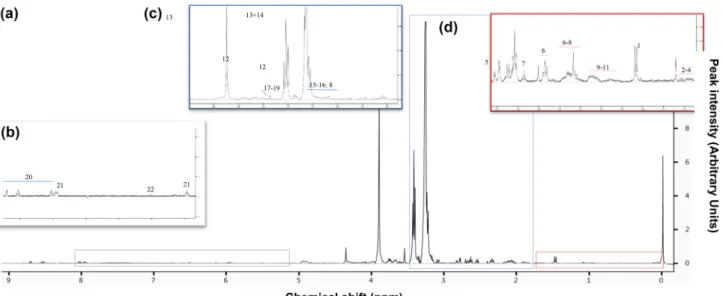
We identified 25 metabolites in the gill extracts of O.
edulis (typical 1H-NMR spectrum shown in Fig. 6). Main compounds were osmolytes and amino acids. Organic osmolytes were taurine, betaine, trimethyl-N-oxide (TMAO) and homarine, with taurine and betaine exhibit- ing the highest concentrations in all spectra. Free amino acids were alanine, ß-alanine, glutamine, glutamate, gly- cine, valine, isoleucine, leucine, lysine, arginine, homo- cysteine, and aspartate. Furthermore, we found signals of the adenylates such as ATP and ADP that were, however, not clearly distinguishable and three intermediates of the Krebs cycle: succinate, malate and fumarate, which are biomarkers for anaerobic metabolism. We further iden- tified three membrane related intermediates sn-glyc- ero-3-phosphocholine, choline, and o-phosphocholine.
UDP-glucose was the only sugar and key metabolite of the carbohydrate pathway identified. The singlet of acetate was assigned despite overlapping with arginine, lysine, and 4-aminobutyrate.
Metabolite profiles under acute warming
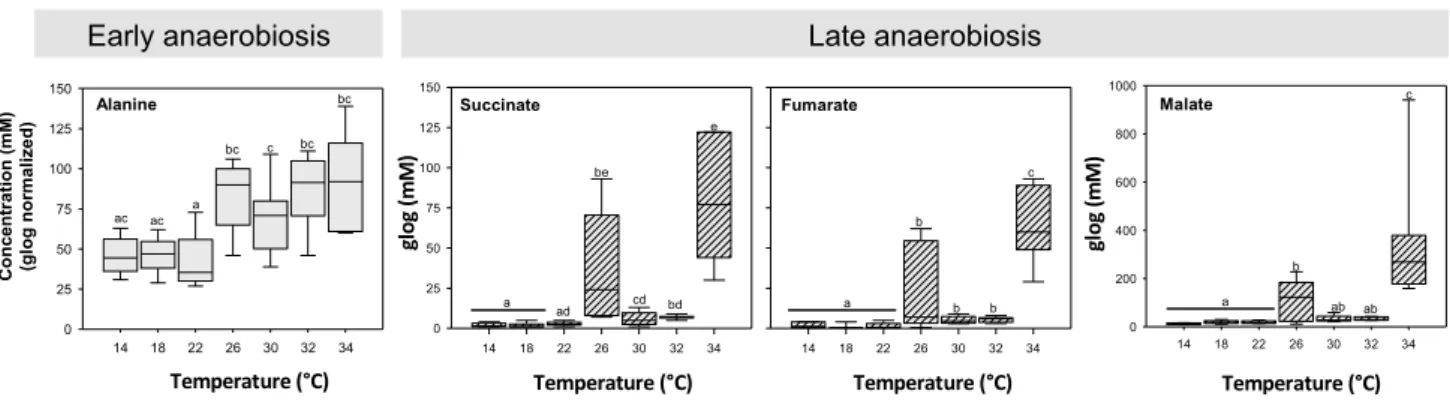
Principal component analysis did not indicate any specific outliers in the sample classes (data not shown). The class membership prediction by PLS-DA revealed that the gill metabolome of O. edulis was homogeneous in bivalves within the temperature range between 14 °C and 26 °C (Fig. 7a). The largest variance across the two principal components was found in the 26 °C group indicating high heterogeneity between samples. Some individual profiles clustered closer to the profiles of samples taken at temper- atures below 26 °C, while others were closer to the cluster of samples taken at 34 °C. The metabolome of O. edulis started to shift at 30 °C with a complete separation from all other clusters at 34 °C. The main metabolites explain- ing the PLS-DA projection (Fig. 7b) show the highest scores for the intermediates related to anaerobiosis such as fumarate, succinate and malate. The univariate analysis complements the PLS-DA results. Alanine, as a marker for early anaerobiosis, increased significantly from the ini- tial value of 0.46 ± 0.11 mM at 14 °C to 0.84 ± 0.23 mM at 26 °C, but showed no further increase with further warming (Fig. 8). The metabolites of late anaerobiosis (succinate, malate, and fumarate) remained at baseline levels (0.02 ± 0.01 mM for succinate and fumarate, and 0.1 ± 0.03 mM for malate) until 22 °C was reached. At 26 °C all three metabolites increased significantly and reached their maximum concentration at 34 °C with 0.083 ± 0.04 mM (succinate), 0.36 ± 0.27 mM (malate), and 0.06 ± 0.02 mM (fumarate, P ≤ 0.001).
Fig. 4 Arrhenius plot showing an impact of acute warming on heart rate (HR) of O. edulis.
Arrhenius Break Temperature (ABT) was analyzed from linear regression lines (dashed lines) intersecting at the respective breakpoint with f (log HR 14–
30 °C) = 11.0559 + (− 2.8519
× Temp), r2 = 0.97, P < 0.001;
and f(log HR 32–36 °C) = − 8.3 74 + (3.049 × Temp), r2 = 0.87, P = 0.2308. n = 4-8
Discussion
Filtration and heart rates
We investigated the response of the European flat oys- ter, O. edulis, to acute warming. Following the OCLTT concept, we aimed to depict the acute thermal tolerance window of O. edulis by linking performance indicators, filtration rate (FR), heart rate (HR) and hence, indirectly, oxygen supply, while identifying the thermal constraints to aerobic metabolic performance, as determined from cellular markers for anaerobiosis. In combination with an in-depth-analysis of cardiac online recordings, the present
data suggest not only a physiological, but also a behavioral change of O. edulis exposed to warming.
For comparison to literature data, it is important to be sure that FR is determined under optimal conditions, con- sidering methodological, abiotic, and biotic aspects which ensure that bivalves are fully open, and thus, display maxi- mal filtration (Riisgård 2001). FR increased linearly with warming as long as the animals were within their window of thermal tolerance as identified in literature studies (Kittner and Riisgård 2005; Riisgård et al. 2003). Beyond such lim- its, FR dropped in association with a progressive reduction in valve gape (Jørgensen et al. 1990; Kittner and Riisgård 2005). Overall, the FR of O. edulis followed a temperature- dependent bell shaped curve between 14 and 36 °C. Similar
Fig. 5 Impact of acute warm- ing on cardiac performance of O.edulis. a Rhythmic heart- beat at 14 °C and b rhythmic heartbeat at 26 °C, c distinctly arrhythmic heartbeat at 30 °C, d fractions of cardiac arrest periods in total measurement time (36 h) at each temperature step. HR pauses were defined as cardiac arrest periods of at least 15 min. Asterisk denotes significant differences among temperature steps (one-way ANOVA, Holm-Sidak Test, F = 16.154, P < 0.001). Data are means ± SE, n = 4-8
curves were described by Widdows (1976) for Mytilus edu- lis between 10 and 28 °C and by Petersen et al. (2003) for Arctic clams, Hiatella arctica and Mya sp. between − 1 and 11 °C. O. edulis filtered at maximum rates between 18 and 26 °C reaching on average 7.7 ± 4.5 L h−1 gDW−1, which is comparable to the 7.3 ± 1.7 L h−1 gDW−1 at 22 °C when
using Rhodomonas cultures (Nielsen et al. 2017). Notably, three out of seven individuals showed impaired FR at 26 °C suggesting a constraining temperature (see “Discussion”).
Temperature-dependent changes in the HR of O. edulis revealed a warming-induced limitation at higher tempera- tures than those observed for FR. An Arrhenius break point
Fig. 6 Representative spectrum of gill metabolites depicted in a one- dimensional 400 MHz CPMG 1H–NMR spectrum of a tissue extract from O.edulis sampled at 34 °C. a Shown are the entire spectra and b–d enlarged areas of this spectrum with identified metabolites.
Keys: Alanine (1); Valine (2); Isoleucine (3); Leucine (4); Succinate
(5); Glutamate (6); Glutamine (7); Homocysteine (8); Arginine (9);
Lysine (10); Acetate (11); Taurine (12); Betaine (13); Trimethyla- mide-N-oxide (TMAO; 14); Aspartate (15); Hypotaurine (16); Cho- line (17); O-Phosphocholine (18); Sn-Glycero-3phosphocholine (19);
Homarine (20); UDP-Glucose (21); Triphosphate (22)
Fig. 7 Impact of acute warming on the metabolic profile of gill tis- sue from O. edulis. a Score Plot of the PLS-DA model for the nor- malized concentrations of assigned gill tissue metabolites found in O. edulis sampled at 14 °C, 18 °C, 22 °C, 26 °C, 30 °C, 32 °C, and
34 °C. Ellipses correspond to a confidence interval of 95%. b Vari- able Importance in Projection (VIP) are the weighted sum of squares of the PLS loadings
temperature (ABT) of HR was reached at 30 °C. Close to the ABT, we observed onset of cardiac arrhythmia occur- ring from 28 °C onwards. Warming-induced loss of rhythmic HR has previously been shown for other bivalves (Trueman and Lowe 1971; Braby and Somero 2006; Xing et al. 2016).
While monitoring HR we observed infrequent periods of cardiac arrest. Nearly complete suppression of HR occurs with some delay upon valve closure in bivalves (Trueman and Lowe 1971; Lannig et al. 2008).
Notably, at the lower exposure temperatures (14–22 °C), we observed cardiac arrest periods in O. edulis that may reflect the natural, rhythmic opening/closure behavior of bivalves. For example, Ortmann and Grieshaber (2003) monitored valve movements of the Asian clam, Corbicula fluminea, over a period of 2 years, and showed that valve opening/closure followed a circadian rhythm during summer.
Progressive warming of O. edulis led to extended peri- ods of cardiac arrest at 24 °C and 26 °C, possibly reflect- ing a behavioral response to less favorable conditions by extended valve closure. During winter season, when tem- perature (< 5 °C) and food availability were very low, Asian clams also showed extended closure periods of several days (Ortmann and Grieshaber 2003). Mytilus galloprovincialis remained open for approximately 90% of the time under favorable conditions and closed its valves for up to 50% of the time when temperatures became unfavorable (Anestis et al. 2007). Benefits for immersed bivalves to remain closed during intervals of poor algal supply or hypoxia are mainly interpreted as energy saving strategies, since upon closure metabolic rate (SMR) is reduced (Jørgensen et al. 1986; Ort- mann and Grieshaber 2003; Sokolova et al. 2012; Riisgård and Larsen 2015). However, further warming will cause energy demand to rise with oxygen consumption increasing steadily without leveling off (Newell et al. 1977; Shumway and Koehn 1982; Haure et al. 1998). Accordingly, periods of cardiac arrests ceased in O. edulis above 26 °C, paral- leled by an opening of the shell (personal observations) that
enables aerobic metabolism to fuel most if not all of the rising energy demand. Previous studies have shown that increasing acclimation temperature elevated the respiratory time activity (RTA, fractional time that animals spend open, ventilating actively) in the Eastern oyster, Crassostrea virgi- nica (Lannig et al. 2006). Similarly, periods of cardiac arrest became scarce at temperatures of 28 °C and beyond in O.
edulis indicating a disruption of the normal valve closing pattern in response to warming for increased oxygen uptake to cover high cellular energy demand.
Mode of metabolism
The main cellular response to warming beyond 26 °C was an increase in the levels of anaerobic metabolites indicating an onset of anaerobiosis with levels peaking shortly before death of the organisms at 34 °C. Anaerobic end product con- centrations (e.g., succinate, acetate, or propionate) are highly variable depending on preferred anaerobic pathways; they may also depend on tissue (anaerobic pathways of bivalves reviewed by De Zwaan and Wijsmann 1976; Livingstone 1991; Müller et al. 2012). In gill tissues of O. edulis, suc- cinate was the predominant anaerobic end product. We observed a significant rise of anaerobic end products at 26 °C, 10 °C below the lethal temperature. Interestingly, oys- ters sampled at this temperature were most diverse in their branchial metabolomic profiles as indicated by the PLS- DA model. Here, the individuals clustered either closer to profiles of lower temperature groups (= performing better), while two samples were closer to the metabolomic pattern found at 34 °C (= performing worse).
The onset of anaerobiosis at 26 °C paralleled the increased cardiac arrest times and may be a response to valve closure and associated oxygen deficiency, as part of the energy saving strategy. In contrast to alanine lev- els (early anaerobiosis) which remained stable beyond 26 °C, those of succinate (fumarate and malate) showed
Alanine
14 18 22 26 30 32 34
0 25 50 75 100 125
150 Succinate
14 18 22 26 30 32 34
0 25 50 75 100 125
150 Malate
14 18 22 26 30 32 34
0 200 400 600 800 Fumarate 1000
14 18 22 26 30 32 34
Early anaerobiosis Late anaerobiosis
ac ac a
bc c bc
bc
a ad
be
cd bd e
a b
b b
c
glog(mM) glog(mM)
a b
ab ab c
Temperature (°C) Temperature (°C) Temperature (°C) Temperature (°C)
Concentration (mM) (glog normalized)
Fig. 8 Impact of acute warming on the levels of gill metabolites in O. edulis. Concentrations (mM) were glog transformed, normalized and analyzed by one-way ANOVA, followed by a post-hoc test. Sig-
nificant differences between data are indicated by different letters (P < 0.05). Data are shown as box plots, n = 5-8
a second, more drastic rise at 34 °C, thereby indicating severe oxygen deficiency, due to an increase in branchial energy demand, cutting back on time for survival. Indeed, further warming to 36 °C resulted in death of all animals.
The average annual SW temperatures in NW Spain (Galicia), where the oysters were collected ranges between 11 and 21 °C with temperatures above 16 °C between May and November (Pazos et al. 1997; www.seate mpera ture.
org). Aquaculture oysters are raft cultured in the estuary and experience the same environmental parameters as wild oysters. Our data indicate an optimal temperature range for the Spanish oyster population between 18 and 24 °C sug- gested by moderate, rhythmic HR and maximal filtration (Fig. 9) consistent with the prevailing summer tempera- tures in oyster’ habitat. Similarly, a study of the brown mussel Perna perna from the Gulf of Mexico, revealed a long-term upper tolerance limit at around 30 °C, congru- ent with the ambient seasonal SW temperature (Hicks and McMahon 2002).
Notably, European oysters displayed a broad tempera- ture span of 10 °C between Tcrit and the lethal temperature, while other studies showed this range to be much narrower.
For example, the temperate sublittoral king scallop, Pecten maximus displayed an upper limit to its thermal optimum at around 25 °C (Artigaud et al. 2014), and reached the lethal temperature at 26–28 °C (Götze et al. in review). One reason might be, that oysters, being adapted to a highly variable environment, have a broad passive tolerance range to endure abiotic challenges beyond the optimum (Pörtner et al. 2017).
This is in agreement with studies showing that the upper thermal tolerance limit of bivalves correlates significantly with habitat (littoral vs. sublittoral) and tidal height distribu- tion (e.g., Wilson 1981; Wilson and Elkaim 1991).
While temperature-induced changes in oxygen consump- tion and heart rates are positively correlated in marine inver- tebrates (Marshall and McQuaid 1992; Schiffer et al. 2014;
Bakhmet 2017) our data suggest moderate metabolic costs for O. edulis within its thermal optimum. Hence, the thermal limit to HR is not yet reached, leaving some room for an increase in aerobic metabolism, a conclusion supported by an ABT at around 30 °C. According to Guderley and Pörtner (2010), maintenance costs (measured as standard metabolic rate = SMR) are moderate within the optimum range and fully covered by aerobic metabolism; this is paralleled by a maximum scope for growth, with sufficient energy being provided by the aerobic power budget. Furthermore, in NW Spain the predominant phytoplankton blooms occur from May to September (Bode et al. 2005). During these months with ample food supply and favorable ambient temperatures, O. edulis should have a high net gain in body weight. Indeed, earlier studies showed that the scope for growth was maxi- mal at around 15 °C (Newell et al. 1977; Buxton et al. 1981).
Accordingly, O. edulis spends most of the year at tempera- tures within its active thermal tolerance range (Pörtner et al.
2017).
The progressive rise in HR above 22 °C when FR starts to level off indicates a rise in baseline aerobic energy demand which increasingly constrains aerobic performance. This is in line with the study of Buxton et al. (1981) showing that between 20 and 25 °C filtration efficiency declined, while oxygen demand still rose, resulting in a shrinking scope for growth. Consequently, a reduction in valve gape might be a behavioral response to limit food intake and thus diges- tion costs as maintenance costs rise. This might indicate that O. edulis has reached the upper pejus temperature range of OCLTT (conditions getting worse; Pörtner et al. 2017).
Fig. 9 Acute thermal window of O.edulis integrating temperature- dependent mortality (black), temperature-induced changes in filtra- tion rate (FR, green), heart rate (HR, red) and succinate levels (mM, glog transformed) in gills as an anaerobic biomarker (boxplot). The
annual habitat temperature range is highlighted in grey. The derived optimal temperature range is marked in green. Dashed black arrows indicate putative values of Tp (pejus temperature), Tc (critical temper- ature) and Td (deadly temperature)
Further warming (≥ 26 °C) emphasized performance lim- itations as indicated by a significantly reduced FR, the onset of cardiac dysfunction (e.g., arrhythmia) and paralleled by the accumulation of anaerobic end products. According to OCLTT, the onset of anaerobiosis indicates that an organ- ism surpasses the critical temperature (Tcrit), where survival becomes strictly time-limited due to the mismatch between aerobic energy demand and supply (Pörtner et al. 2017).
Gill metabolism indicates Tcrit being surpassed from 26 °C onwards, several degrees below the temperature threshold for cardiac dysfunction. Accordingly, gill functioning seems to be a more sensitive thermal stress indicator than HR. This can be explained by the high metabolic activity and energy demand of gills (see “Discussion”). In its natural environ- ment, O. edulis might undergo partial anaerobiosis at this temperature (26 °C); at the same time the species can survive in a time-dependent manner as indicated by the rhythmic and not yet fully maximized heart rate. This response and asso- ciated metabolic depression may support extended passive survival of O. edulis. Finally, arrhythmia and an ABT setting in at around 28–30 °C indicate diminished O2 distribution to tissues associated with limited circulatory performance, and accordingly, cardiac failure corroborating that the upper thermal limit has been reached (Somero 2002). While in other species Tcrit and cardiac ABT are similar cardiac ABT of the oyster is shifted to higher temperatures within the pas- sive tolerance range. Furthermore, anaerobiosis as an alter- native energy supply also supports passive survival (Pörtner 2001; Han et al. 2017) until finally a lethal temperature is reached at 36 °C.
Outlook
Our results indicate that O. edulis in NW Spain lives cur- rently largely within its thermal optimum range. This popu- lation, however, might be negatively affected in the course of projected ocean warming. SW temperatures exceeding 26 °C may constrain oyster performance unless acclimatiza- tion occurs. Elevated temperatures may also make oysters susceptible to bacterial and viral infection (Zannella et al.
2017), leading to altered species composition of commu- nities that may contribute to weaken the European oyster populations (Poloczanska et al. 2013). Further research is needed to understand the long-term effects of thermal stress on this species, and to what extent and how O. edulis is able to resist the warming trend. One crucial factor of resilience is set by the cellular capacity to maintain cellular homeo- stasis and integrity. Temperature stress induces cellular pro- tective responses such as upregulation of, e.g., heat shock proteins, or antioxidant pathways, which demand energy and diminish growth or reproduction. The sum of cellular protection mechanisms is defined as the capacity of pas- sive tolerance, which is strictly time-limited (Pörtner 2010).
Therefore, one crucial aspect of further research will be to understand the passive capacity of O. edulis and how it is influenced as well as exploited during combined exposures to warming, oxygen deficiency and increased CO2 levels.
The combined capacities of both active and passive tolerance mechanisms may influence the selective survival of species under climate change and associated extreme conditions and may thereby shape related changes in community composi- tion (see introduction). If such principles hold for ongoing climate change they may also have been operative during climate driven evolutionary crises in Earth history.
Acknowledgements This study was funded by the Deutsche Forschun- gsgemeinschaft (DFG Po278/16-1) and is embedded in the Research Unit TERSANE (FOR 2332: Temperature‐related stressors as a unify- ing principle in ancient extinctions). We thank I. Ketelsen, F. Feliz Moraleda, and R. Gorniak for technical support and assistance during the exposures and animal care. Furthermore, we want to thank the sec- tion Marine BioGeoScience, in particular S. Trimborn, A. Terbrüggen and T. Brenneis for providing access to the Coulter Counter and the Observer microscope. We thank the Biological station of Toralla (ECI- MAT, Spain), in particular A.Villanueva and D. Costas for support in animal supply.
Compliance with ethical standards
This study was funded by the Deutsche Forschungsgemeinschaft (DFG Po278/16-1).
Conflict of interest Authors declare that they have no conflict of inter- est.
Ethical approval All applicable international, national, and/or institu- tional guidelines for the care and use of animals were followed.
References
Anestis A, Lazou A, Pörtner H-O, Michaelidis B (2007) Behavioral, metabolic, and molecular stress response of marine bivalve Myti- lus galloprovincialis during long-term acclimation at increasing ambient temperature. Am J Physiol Regul Integr Comp Physiol 293:911–921. https ://doi.org/10.1152/ajpre gu.00124 .2007 Artigaud S, Lacroic C, Pichereau V, Flye-Sainte-Marie J (2014) Res-
piratory response to combined heat and hypoxia in the marine bivalves Pecten maximus and Mytilis spp. Comp Biochem Physiol A 175:135–140. https ://doi.org/10.1016/j.cbpa.2014.06.005 Bakhmet IN (2017) Cardiac activity and oxygen consumption of the
blue mussel (Mytilus edulis) from the White Sea in relation to body mass, ambient temperature and food availability. Polar Biol 40:1959–1964. https ://doi.org/10.1007/s0030 0-017-2111-6 Bambach RK, Knoll AH, Wang SC (2004) Origination, extinction, and
mass depletions of marine diversity. Paleobiology 30:522–542.
https ://doi.org/10.1666/0094-8373(2004)030%3c052 2:OEAMD O%3e2.0.CO;2
Bertolino M, Betti F, Bo M, Cattaneo-Vietti R, Pansini M, Romero J, Bavestrello G (2015) Changes and stability of a Mediterranean hard bottom benthic community over 25 years. J Mar Biol Assoc UK 96:341–350. https ://doi.org/10.1017/S0025 31541 50011 86 Beukema JJ, Dekker R, Jansen JM (2009) Some like it cold: popula-
tions of the tellinid bivalve Macoma balthica (L.) suffer in various
ways from a warming climate. Mar Ecol Prog Ser 384:135–145.
https ://doi.org/10.3354/meps0 7952
Bode A, Álvarez-Ossorio T, González N, Lorenzo J, Rodríguez C, Varela M, Varela MM (2005) Seasonal variability of plankton blooms in the Ria de Ferrol (NW Spain): II. Plankton abundance, composition and biomass. Estuar Coast Shelf Sci 63:285–300.
https ://doi.org/10.1016/j.ecss.2004.11.021
Braby CE, Somero GN (2006) Following the heart: temperature and salinity effects on heart rate in native and invasive species of blue mussels (genus Mytilus). J Exp Biol 209:2554–2566. https ://doi.
org/10.1242/jeb.02259
Brinkhoff W, Stöckmann K, Grieshaber M (1983) Natural occurence of anaerobiosis in molluscs from intertidal habitats. Oecol 57:151–
155. https ://doi.org/10.1007/BF003 79573
Buxton CD, Newell RC, Field JG (1981) Response-surface analysis of the combined effects of exposure and acclimation tempera- tures on filtration, oxygen consumption and scope for growth in the oyster Ostrea edulis. Mar Ecol Prog Ser 6:73–82. https ://doi.
org/10.3354/meps0 06073
Calosi P, De Witt P, Thor P, Dupont S (2016) Will life find a way?
Evolution of marine species under global change. Evol Appl 9:1035–1042. https ://doi.org/10.1111/eva.12418
Cattaneo-Vietti R (2018) Structural changes in Mediterranean marine communities: lessons from the Ligurian Sea. Rend Fis Acc Lincei 29:515–524. https ://doi.org/10.1007/s1221 0-018-0670-2 Coughlan J (1969) The estimation of filtering rate from the clearance
of suspensions. Mar Biol 2(4):356–358
De Zwaan A, Wijsmann TCM (1976) Anaerobic metabolism in bival- via (mollusca)—characteristics of anaerobic metabolism. Comp Biochem Physiol B 54:313–324. https ://doi.org/10.1016/0305- 0491(76)90247 -9
Depledge M, Andersen B (1990) A computer-aided physiological monitoring system for continuous, long-term recording of car- diac activity in selected invertebrates. Comp Biochem Physiol A 96:473–477. https ://doi.org/10.1016/0300-9629(90)90664 -E Dickson AG (1990) Standard potential of the (AgCl(s) + 1/2H2(g) = Ag
(s) + HCl(aq)) cell and the dissociation constant of bisulfate ion in synthetic sea water from 273.15 to 318.15 K. J Chem Thermodyn 22:113–127
Domnik NJ, Polymeropoulos ET, Elliott NG, Frappell PB, Fisher JT (2016) Automated non-invasive video-microscopy of oyster spat heart rate during acute temperature change: impact of acclimation temperature. Front Physiol 7:236. https ://doi.org/10.3389/fphys .2016.00236
Finnegan S, Anderson SC, Harnik PG, Simpson C, Tittensor DP, Byrnes JE, Finkel ZV, Lindberg DR, Liow LH, Lockwood R, Lotze HK, McClain CR, McGuire JL, O’Dea A, Pandolfi JM (2015) Paleontological baselines for evaluating extinction risk in the modern oceans. Science 348:567–570. https ://doi.org/10.1126/
scien ce.aaa66 35
Frederich M, Pörtner H-O (2000) Oxygen limitation of thermal tolerance defined by cardiac and ventilatory performance in spider crab, Maja squinado. Am J Physiol Regul Integr Comp 279:R1531–R1538. https ://doi.org/10.1152/ajpre gu.2000.279.5.R1531
Garrabeu J, Coma R, Bensoussan N et al (2009) Mass mortality in Northwestern Mediterranean rocky benthic communities: effects of the 2003 heat wave. Global Change Biol 15:1090–1103. https ://doi.org/10.1111/j.1365-2486.2008.01823 .x
Giomi F, Pörtner H-O (2013) A role for haemolymph oxygen capacity in heat tolerance of eurythermal crabs. Front Physiol 4:110. https ://doi.org/10.3389/fphys .2013.00110
Götze S, Bock C, Eymann C, Lannig G, Steffen J, Pörtner H-O (2020) Single and combined effects of the “Deadly trio” hypoxia,
hypercapnia and warming on the cellular metabolism of the great scallop Pecten maximus. Comp Biochem Physiol B (in review) Guderley H, Pörtner H-O (2010) Metabolic power budgeting and adap-
tive strategies in zoology: examples from scallops and fish. Can J Zool 88:753–763. https ://doi.org/10.1139/Z10-039
Guo X, Li C, Wang H, Xu Z (2018) Diversity and evolution of oysters.
J Shellfish Res 37:755–771. https ://doi.org/10.2983/035.037.0407 Han G, Zhang S, Dong Y (2017) Anaerobic metabolism and thermal
tolerance: the importance of opine pathways on survival of a gas- tropod after cardiac dysfunction. Integr Zool 12:361–370. https ://doi.org/10.1111/1749-4877.12229
Haure J, Penisson C, Bougrier S, Baud J (1998) Influence of tempera- ture on clearance and oxygen consumption rates of the flat oyster Ostrea edulis: determination of allometric coefficients. Aquacul- ture 169:211–224. https ://doi.org/10.1016/S0044 -8486(98)00383 Hicks DW, McMahon RF (2002) Respiratory responses to temperature -4 and hypoxia in the nonindgenous Brown Mussel, Perna perna (Bivalvia. Mytilidae) from the Gulf of Mexico. J Exp Mar Biol Ecol 277:61–78. https ://doi.org/10.1016/S0022 -0981(02)00276 -9 Hochachka PW, Somero GN (2002) Biochemical adaptation: mecha- nism and process in physiological evolution. Oxford University Press, New York, p 480 (ISBN 0‐195‐11702‐6)
Hoegh-Guldberg O, Bruno JF (2010) The impact of climate change on the world’s marine ecosystems. Science 328:1524–1528. https ://
doi.org/10.1126/scien ce.11899 30
Joachimski MM, Lai X, Shen S, Jiang H, Luo G, Chen B, Chen J, Sun Y (2012) Climate warming in the latest Permian and the Permian-Triassic mass extinction. Geology 40:195–198. https ://
doi.org/10.1130/G3270 7.1
Jørgensen CB, Møhlenberg F, Sten-Knudsen O (1986) Nature of rela- tion between ventilation and oxygen consumption in filter feeders.
Mar Ecol Prog Ser 29:73–88. https ://doi.org/10.3354/meps0 29073 Jørgensen CB, Larsen PS, Riisgård HU (1990) Effects of temperature
on the mussel pump. Mar Ecol Prog Ser 64:89–97
Kittner C, Riisgård HU (2005) Effect of temperature on filtration rate in the mussel Mytilus edulis: no evidence for temperature compensa- tion. Mar Ecol Prog Ser 305:147–152. https ://doi.org/10.3354/
meps3 05147
Knoll AH, Bambach RK, Payne JL, Pruss S, Fischer WW (2007) Paleo- physiology and end-Permian mass extinction. EPSL 256:295–313.
https ://doi.org/10.1016/j.epsl.2007.02.018
Koenigstein S, Mark FC, Gößling-Reisemann S, Reuter H, Pörtner H-O (2016) Modelling climate change impacts on marine fish popula- tions: process-based integration of ocean warming, acidification and other environmental drivers. Fish Fish 17:972–1004. https ://
doi.org/10.1111/faf.12155
Lannig G, Flores JF, Sokolova IM (2006) Temperature-dependent stress response in oysters, Crassostrea virginica: pollution reduces temperature tolerance in oysters. Aquat Toxicol 79:278–287. https ://doi.org/10.1016/j.aquat ox.2006.06.017
Lannig G, Cherkasov AS, Pörtner H-O, Bock C, Sokolova IM (2008) Cadmium-dependent oxygen limitation affects temperature tol- erance in eastern oysters (Crassostrea virginica Gmelin). Am J Physiol Regul Integr Comp Physiol 294:R1338–R1346. https ://
doi.org/10.1152/ajpre gu.00793 .2007
Lewis E, Wallace DWR (1998) Program developed for CO2 system calculations. United States: N.p. Technical Report ORNL/CDIAC- 105, Osti.Gov. https ://doi.org/10.2172/63971 2
Livingstone DR (1991) Origins and Evolution of pathways an anaero- bic metabolism in the animal kingdom. Am Zool 31:522–534.
https ://doi.org/10.1093/icb/31.3.522
Marshall DJ, McQuaid CD (1992) Relationship between heart rate and oxygen consumption in the intertidal limets Patella granularis and