High-resolution magnetic signature of active hydrothermal systems in the back-arc spreading region
of the southern Mariana Trough
Masakazu Fujii1,2, Kyoko Okino2, Chie Honsho2, Jerome Dyment3, Florent Szitkar4, Nobutatsu Mochizuki5, and Miho Asada6
1Department of Earth and Planetary Science, University of Tokyo, Tokyo, Japan,2Atmosphere and Ocean Research Institute, University of Tokyo, Kashiwa, Japan,3Institut de Physique du Globe de Paris, CNRS, Paris, France,4Helmholtz Centre for Ocean Research Kiel, Kiel, Germany,5Priority Organization for Innovation and Excellence, Kumamoto University, Kumamoto, Japan,
6Institute for Research on Earth Evolution, Japan Agency for Marine-Earth Science and Technology, Yokosuka, Japan
Abstract
High-resolution vector magnetic measurements were performed onfive hydrothermal vent fields of the back-arc spreading region of the southern Mariana Trough usingShinkai 6500, a deep-sea manned submersible. A new 3-D forward scheme was applied that exploits the surrounding bathymetry and varying altitudes of the submersible to estimate absolute crustal magnetization. The results revealed that magnetic-anomaly-derived absolute magnetizations show a reasonable correlation with natural remanent magnetizations of rock samples collected from the seafloor of the same region. The distribution of magnetic-anomaly-derived absolute magnetization suggests that allfive andesite-hosted hydrothermal fields are associated with a lack of magnetization, as is generally observed at basalt-hosted hydrothermal sites. Furthermore, both the Pika and Urashima sites were found to have their own distinct low-magnetization zones, which could not be distinguished in magnetic anomaly data collected at higher altitudes by autonomous underwater vehicle due to their limited extension. The spatial extent of the resulting low magnetization is approximately 10 times wider at off-axis sites than at on-axis sites, possibly reflecting larger accumulations of nonmagnetic sulfides, stockwork zones, and/or alteration zones at the off-axis sites.1. Introduction
Seafloor hydrothermal systems are strongly related to the cooling of the oceanic lithosphere [e.g.,Stein and Stein, 1992], geochemical cycles of many elements [e.g.,Elderfield and Schultz, 1996], submarine mineral deposits [e.g.,Iizasa et al., 1999], and specific chemosynthetic ecosystems [e.g.,Takai et al., 2006]. Since the first discovery of submarine hydrothermal activity on and near the Galápagos Rift in 1977 [Corliss et al., 1979], more than 300 hydrothermal vent fields have been reported on mid-ocean ridges (MORs), hot spots, volcanic arcs, and back-arc basins [Hannington et al., 2011].
Hydrothermal processes alter the oceanic crust, resulting not only in the destruction of magnetic minerals from basalt, diabase, and gabbro [e.g.,Ade-Hall et al., 1971;Rona, 1978] but also in the generation of magnetic minerals through serpentinization of ultramafic rocks [e.g., Oufi et al., 2002]. Furthermore, the high temperature associated with some active sites results in thermal demagnetization of volcanic rocks, as long as they are warmer than the Curie temperature of their magnetic minerals. Finally, yet importantly, massive sulfides bearing their own magnetic properties accumulate over tens to hundreds of meters. The spatial extent and relative importance of these processes can be estimated using high-resolution, near-seafloor magnetic anomalies.
Deep-sea, high-resolution magnetic measurement techniques have been developed to study relatively small-scale magnetic structures. Such techniques either use deep-towed magnetometers [e.g.,Sager et al., 1998;Pouliquen et al., 2001;Tivey et al., 2006; Granot et al., 2012;Caratori-Tontini et al., 2014] or deep-sea vehicles, such as autonomous underwater vehicles (AUVs) [Tivey et al., 1998;Zhu et al., 2010;Caratori-Tontini et al., 2012a, 2012b;Honsho et al., 2013], remotely operated vehicles [Dyment et al., 2005;Szitkar et al., 2014a, 2014b], or human-occupied vehicles (HOVs) [Tivey et al., 1993;Fujiwara and Fujimoto, 1998;Honsho et al., 2009;
Sato et al., 2009]. These techniques have allowed the discovery of reduced magnetization associated with basalt-hosted hydrothermal sites on the Mid-Atlantic Ridge (MAR) [Tivey et al., 1993;Tivey and Dyment, 2010],
PUBLICATIONS
Journal of Geophysical Research: Solid Earth
RESEARCH ARTICLE
10.1002/2014JB011714
Key Points:
•New 3-D method to calculate absolute magnetization comparable with rock NRM
•Reduced magnetization at back-arc hydrothermal ventfields of Mariana Trough
•Larger hydrothermalfields in off-axis area controlled by off-axis volcanism
Correspondence to:
M. Fujii,
fujii@aori.u-tokyo.ac.jp
Citation:
Fujii, M., K. Okino, C. Honsho, J. Dyment, F. Szitkar, N. Mochizuki, and M. Asada (2015), High-resolution magnetic signature of active hydrothermal systems in the back-arc spreading region of the southern Mariana Trough, J. Geophys. Res. Solid Earth,120, 2821–2837, doi:10.1002/2014JB011714.
Received 24 OCT 2014 Accepted 25 MAR 2015
Accepted article online 27 MAR 2015 Published online 4 MAY 2015
©2015. American Geophysical Union. All Rights Reserved.
Juan de Fuca Ridge [Tivey and Johnson, 2002], Southwest Indian Ridge [Zhu et al., 2010], and Southern Tyrrhenian Sea [Caratori-Tontini et al., 2014]. Enhanced magnetization zones have been discovered on ultramafic-hosted sites on the MAR [Dyment et al., 2005;Tivey and Dyment, 2010;Szitkar et al., 2014b] and sediment-hosted sites [Tivey, 1994;Gee et al., 2001].
Seafloor hydrothermal ventfields are also widely distributed along volcanic arcs and back-arc basins. The chemical compositions of arc/back-arc hydrothermal fluids exhibit tremendous diversity related to the host rock (basalt ~ rhyolite) with strong contributions from magmatic volatiles [Ishibashi and Urabe, 1995].
The content of economic metals (Ag, Au, Ba, Cu, Pb, Sb, and Zn) in massive sulfides formed by hydrothermal activity in the arc/back-arc context is generally higher than on other MORs [Rona, 2008].
However, few studies have been performed on the magnetic signatures of specific arc/back-arc ventfields [Caratori-Tontini et al., 2012a, 2012b, 2014;Nakamura et al., 2013;Honsho et al., 2013].
Here we present a detailed analysis of the high-resolution vector magnetic data acquired by the HOVShinkai 6500, both on and off the southern Mariana Trough (SMT) back-arc spreading axis. We used vector magnetic anomalies along the submersible tracks to estimate the absolute magnetization intensity of the shallow subseafloor, applying an improved 3-D version of the analysis method based on forward modeling, proposed byHonsho et al. [2009] for 2-D structures. The obtained magnetic-anomaly-derived absolute magnetization (MADAM) is consistent with both the equivalent magnetization computed using AUV data and natural remanent magnetization (NRM) measured on rock samples. Low-magnetization estimates are associated with the hydrothermal vent fields, as depicted from detailed seafloor geological analyses performed using video and still camera data acquired during the Shinkai 6500 dives.
2. Study Area
The SMT is located along the convergent margin between the Pacific and Philippine Sea plates [e.g.,Stern et al., 2003] (Figure 1a). The subduction of the Pacific plate beneath the Philippine Sea plate began in the early Eocene (~50 Ma) [e.g.,Seno and Maruyama, 1984]. From ~30 Ma to ~20 Ma, the proto-Mariana arc rifted, forming the Parece Vela back-arc basin [Okino et al., 1999]. Seafloor extension has focused on the Figure 1.(a) Seafloor bathymetry of the Mariana Trough. Contour interval is 1 km. Bathymetry map is based on grid data from ETOPO1 [Amante and Eakins, 2009].
(b) Detailed seafloor bathymetry of the southern Mariana Trough. Red squares indicate locations of hydrothermal ventsfields. Contour interval is 40 m. Bathymetry is made using 0.025 nmi interval grid data fromSeama et al. [2015].
eastern side of the Philippine Sea plate for the last 6 Ma, resulting in the development of the Mariana Trough [Hussong and Uyeda, 1982]. Seafloor spreading started in the central part of the trough, which was followed by movement in both the northern and southern areas [Martínez et al., 2000;Yamazaki et al., 2003], forming a crescent-shaped basin ~200 km wide at its central point. The spreading axis is now located on the eastern side of the basin, indicating highly asymmetric spreading [Deschamps and Fujiwara, 2003;Asada et al., 2007].
In the southernmost part of the SMT, the general trend of the arc-trench system changes from N-S to E-W.
South of 14°N, seafloor spreading began 3 Ma, with a half rate of 33 km/Myr for the west side and 13 km/Myr for the east side [Seama et al., 2015]. The seafloor morphology of axial high features is characteristic of fast and/or strongly magmatic spreading context. The distance between the spreading axis and the active Mariana arc volcanic front is ~20 km, suggesting a complex magmatic environment influenced by back-arc and arc-type magmas [Martínez et al., 2000]. Analyses of sea surface gravity data have revealed a thick crust (5800–6800 m on average) in the SMT, which is in agreement with vigorous magmatic activity with sheet-like mantle upwelling under the spreading axis [Kitada et al., 2006].
Five active hydrothermal vent fields have been discovered in the SMT between 12°55′N and 12°57′N (Figure 1b) [Wheat et al., 2003;Ishibashi et al., 2004;Urabe et al., 2004;Kakegawa et al., 2008;Nakamura et al., 2013]. Thesefields are aligned perpendicularly to, and within ~5 km from, the spreading axis. The Snail and Yamanaka sites are located on the axial area, where undeformed volcanic structures have been reported based on high-resolution bathymetric surveys, which have been interpreted as the current neovolcanic zone (NVZ) [Yoshikawa et al., 2012]. At the Snail site that displays both active and dead chimneys and is surrounded by fresh pillow basalt, the maximum temperature of ventingfluid was 248°C at the time of discovery in May 2003 [Wheat et al., 2003]. The Yamanaka site is located on a volcanic edifice 1.2 km southwest of the Snail site. It consists of white smokers, dead sulfide chimneys, and altered pillow lavas [Kakegawa et al., 2008].
The Archean site is located at the eastern foot of the axial high, where active black smokers have been observed on the top of a 50 m high mound made of pyrite, chalcopyrite, and sphalerite [Urabe et al., 2004]. The highest recordedfluid temperatures were 213°C in 2004 and 341°C in 2005 [Ishibashi et al., 2004; YK05-09-Leg2 Cruise Report, 2005, http://www.godac.jamstec.go.jp/catalog/data/doc_catalog/media/YK05-09_leg2_all.pdf.
The Pika and Urashima sites lie on a 400 m high off-axis seamount ~5 km from the spreading axis. The Pika site is located on the top of a seamount and consists of black smokers, white smokers, dead chimneys, and sulfide mounds. The Urashima site was discovered in 2010 at the northern foot of the seamount 500 m from the Pika site, and it comprises large black smokers (>10 m) and dead chimneys [Nakamura et al., 2013]. The highest recorded fluid temperatures at the Pika and Urashima sites are 330°C and 280°C, respectively [Urabe et al., 2004;Nakamura et al., 2013].
3. Data Acquisition
Near-seafloor exploration surveys were conducted around thefive hydrothermal ventfields of the SMT using the HOV Shinkai 6500 of the Japan Agency for Marine-Earth Science and Technology during two scientific cruises of the R/VYokosuka. Five dives were conducted during the YK10-10 cruise in August 2010 and nine others during the YK10-11 cruise in September 2010. Four dives (#1218, #1220, #1227, and #1228) were devoted to the axial area, including the Snail and Yamanaka sites,five dives (#1216, #1217, #1221, #1223, and #1224) to the off-axis area around the Archean site, andfive dives (#1214, #1219, #1222, #1225, and
#1226) to the off-axis seamount on which the Pika and Urashima sites are located. All 14 dives were navigated by acoustic ranging using the supershort baseline positioning system. Magnetic data were generally collected at altitude lower than 15 m, but occasionally, at altitudes of several tens of meters.
A three-componentfluxgate magnetometer, developed by the Atmosphere and Ocean Research Institute of the University of Tokyo, was rigidlyfixed to the front side of Shinkai 6500. Both vector magnetic data and the attitude of the submersible (heading, pitch, and roll) from a gyrocompass and a motion sensor (OCTANS, IXBLUE Inc.) were collected at a 10 Hz sampling rate. The accuracy of the magnetometer is 0.4 nT.
The surface geology along the dive tracks was constrained by examining video and still camera records for each dive. In some limited areas, no visual observation of the surface geology was obtained because of the higher altitude of the submersible. We classified the geological features intofive categories: (1) fresh
Journal of Geophysical Research: Solid Earth
10.1002/2014JB011714lava, (2) fractured lava, (3) sediment-covered lava, (4) debris and breccia, (5) and hydrothermal material. The hydrothermal areas were characterized by sulfide deposits, chimneys, pluming hot water, white bacteria mats, and biological habitats.
4. Method
4.1. Initial Processing
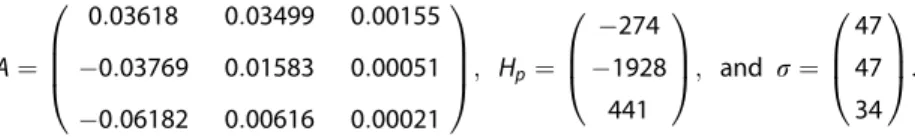
Because the magnetometer was mounted on the submersible, magnetic data were strongly affected by the magnetization of the vehicle. The observed magneticfield vector is expressed as the sum of induced and permanent magnetic fields of the vehicle and the ambient geomagnetic field [Isezaki, 1986]. We used data collected during 360° rotations performed spontaneously by the submersible during its descent to estimate both the induced magnetization vector of the vehicle, expressed by the magnetic susceptibility tensor A (nine coefficients) and remanent magnetization vector Hp (three coefficients) of the vehicle using a dumped least square method developed byHonsho et al. [2009]. Parts of the data obtained at depths shallower than 500 m below sea surface or deeper than 500 m above the seafloor were not used in order to avoid the magnetic effects of the ship and the seafloor. The coefficients were estimated individually for each dive. For example, we obtained the following coefficients of dive #1223 using a dumping factor of 7,
A¼
0:03618 0:03769 0:06182
0:03499 0:01583 0:00616
0:00155 0:00051 0:00021 0
BB
@
1 CC A; Hp¼
274 1928
441 0 B@
1
CA; and σ¼ 47 47 34 0 B@
1 CA:
The quantity σis model error of observation equation. Based on these coefficients, the attitude of the submersible, and the regional geomagnetic field (approximated by the International Geomagnetic Reference Field, IGRF [International Association of Geomagnetism and Aeronomy Working Group V-MOD, 2010]), we computed the magnetic effects of the submersible during the survey and removed them from the data. The correction was performed for each dive, and the resulting vector magneticfield was rotated to the geographical coordinates, giving the model errorσin the ranges 47–200, 47–175, and 29–68 nT in the northern, eastern, and downward components, respectively.
The subsequent three-dimensional analysis required both the position of the magnetometer and the seafloor topography. The supershort baseline position was smoothed and resampled at intervals of 1 s using a Gaussian function filter after removing outliers. The altitude data were collected every 1 s with 1 m resolution, and the distance between the altimeter and magnetic sensor was taken into account to obtain the geometry of the experiment. The seafloor topography was extracted from the 2 m interval grid built from data collected by the AUVUrashima using a 400 kHz multibeam echo sounder (SeaBat 7125 AUV, Reson Inc., Denmark) during the YK09-09 cruise [Yoshikawa et al., 2012]. Additional sea surface bathymetric data (50 m interval grid) were compiled for areas not surveyed by the AUV Urashima.
4.2. Forward Modeling
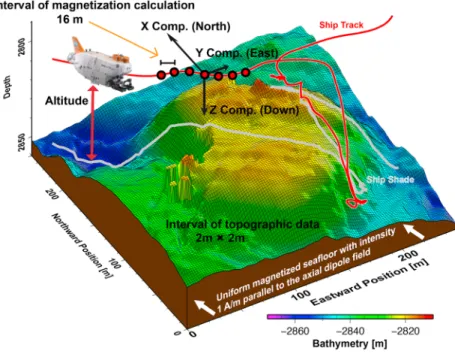
The three components of the synthetic magnetic anomaly along the dive tracks, at the same locations as the observed data, were simulated assuming uniform magnetization of the seafloor, with direction parallel to the geocentric axial dipolefield (inclination: 24°, declination: 0°) and intensity of 1 A/m (Figure 2). There was not much difference between the results based on assumption of magnetization direction parallel to the geocentric axial dipole and the IGRF (inclination: 11°, declination: 1°). A half-infinite magnetic source was considered, the upper boundary of which was constrained by the bathymetry. The magnetic source was modeled by a collection of half-infinite rectangular prisms with lateral dimensions of 2 m. Magnetic anomalies at each calculation point were obtained by applying the algorithm ofBhattacharyya [1964], which provides the magnetic anomaly produced by uniformly magnetized prisms, via the summing up of the contributions of all prisms located within 100 m from the point.
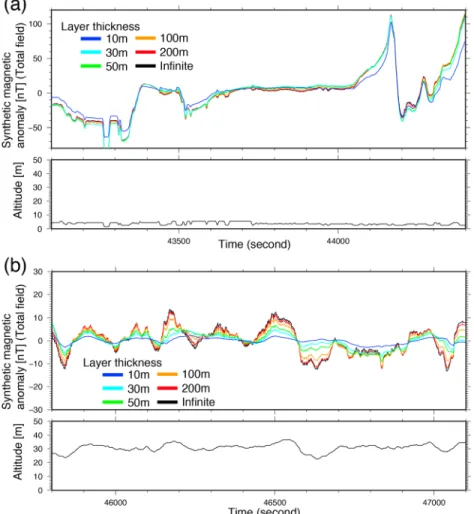
Figure 3 shows synthetic total magnetic anomaly profiles computed for magnetic source layers of various thicknesses. Although we adopted a half-infinite source, these models show that the synthetic magnetic anomalies at altitudes lower than 40 m are not significantly affected by magnetic sources deeper than 200 m.
Figure 4 shows a comparison between observed and synthetic magnetic anomalies along dive #1227. The three components of the synthetic anomaly show similarities with those of the observed anomaly, except for the scale that reflects the low (1 A/m) intensity of magnetization assumed for the modeling.
4.3. Estimation of Absolute Magnetization
The ratio of the observed magnetic anomaly to the synthetic anomaly, computed with unit magnetization intensity, represents an estimate of the absolute magnetization intensity of the shallow subseafloor. In order to estimate this ratio quantitatively, we used the linear transfer function technique in the frequency domain [Honsho et al., 2009]. This approach has been originally used in gravity studies to estimate a ratio of gravity to elevation as a function of wave number [McKenzie and Bowin, 1976;Watts, 1978].
Both observed and synthetic anomalies were resampled at every 1 m interval along the dive tracks. The magnetization was estimated for each 128 m wide sliding window shifted by steps of 16 m along the tracks. The coherency, ratio of the observed to synthetic anomalies together with its error, and polarity (given by the phase difference between the two signals) were obtained over wavelengths between 16 and 128 m. This procedure was applied to each component of the anomaly. We retained estimations with a coherency greater than 0.3 on at least two components for further interpretation. The ratios of observed to synthetic northern and downward components werefinally averaged and adopted as our best estimate of absolute magnetization intensity of the shallow subseafloor. This was done for two reasons: (1) the eastern component is nearly perpendicular to the IGRF direction in the survey area; i.e., it is more susceptible to correction errors mainly affected by heading error, resulting in a lower S/N ratio; and (2) the absolute magnetization computed from this component tends to be extremely large, because the synthetic magnetic anomaly is small due to the assumption that the magnetization direction is parallel to the axial dipolefield. The magnetization polarity was regarded as normal for phases between90° and 90° and reversed for phases between 90° and 270°.
5. Results
5.1. Magnetic-Anomaly-Derived Absolute Magnetization and Seafloor Geology
The four dives in the axial area including the Snail and Yamanaka sites provided 312 reliable estimates of MADAM ranging from 1 to 116 A/m (Figure 5a). Thirty-two percent of the data indicate high magnetization stronger than 30 A/m, whereas 19% are associated with magnetizations weaker than 10 A/m. Extremely Figure 2.Schematic explanation of the method used to derive the absolute magnetization. Colored grid: bathymetry collected by AUV; red line: submersible track; white line: submersible path projected on the seafloor. See text for details.
Journal of Geophysical Research: Solid Earth
10.1002/2014JB011714high intensities (>70 A/m) are observed in the NVZ, north of the Snail site, south of the Yamanaka site, and in the central volcanic mound (12°56′52″N, 143°36′57″E). Relatively low intensities (<10 A/m) are observed around the Snail site and in an area ~200–500 m from the NVZ, where many faults trending NNE-SSW to NE-SW extend parallel to the NVZ.
The video records in this area show fresh lavas, fractured lavas, and hydrothermal material. Sulfide deposits, biological communities, and chimneys were observed near the Snail site (Figures 5b and 5c), and fresh pillow lavas seen around the Snail hydrothermal area (Figures 5b and 5d). At the Yamanaka site, sea anemones are growing within the weakfluid venting (Figures 5b and 5e) on top of fresh pillow lavas (Figures 5b and 5e):
lavas on the western slope of the axial high are fractured and appear to be older (Figures 5b and 5g).
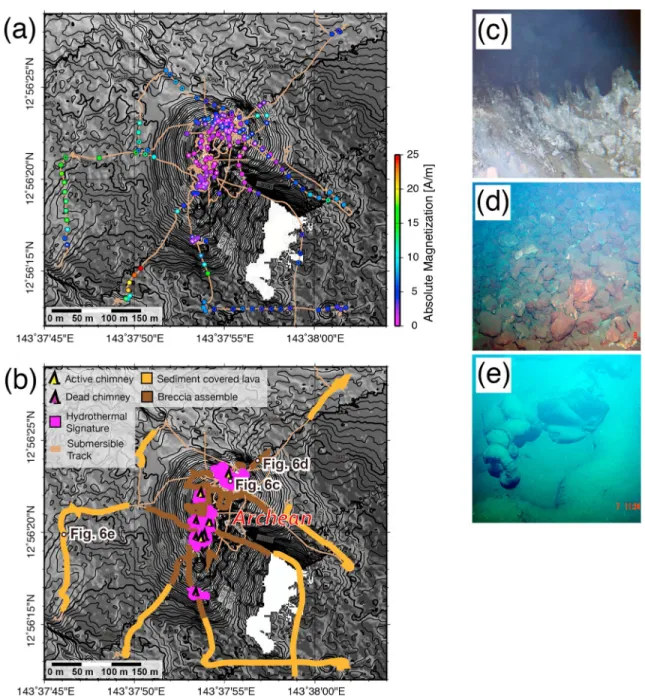
Thefive dives in the off-axis area including the Archean site provided 204 reliable estimates of MADAM ranging from 0.4 to 29 A/m (Figure 6a). More than 85% show intensities weaker than 10 A/m. At the top of the mound, the magnetization is generally weaker than 3 A/m, whereas stronger magnetizations (>10 A/m) are found outside the mound.
In this off-axis area, video records show debris and breccia, sediment-covered lavas, and hydrothermal material. Active and dead chimneys and sulfide deposits were observed at the top of the mound (Figures 6b and 6c), and debris and breccia distributed widely on the slopes of the mound (Figures 6b and 6d). The relatively flat seafloor around the mound was covered mostly by pillow lavas with sediment (Figures 6b and 6e).
Figure 3.Synthetic total magnetic anomaly calculated by 3-D forward modeling along the track of dive 6K#1227 using bathymetric data collected by AUV, for dive altitudes of (a)<10 m and (b) 20–40 m, assuming different magnetic source layer thicknesses: 10 m (blue line), 30 m (light blue line), 50 m (green line), 100 m (orange line), 200 m (red line), and infinite (black line).
Thefive dives in the area of the off-axis seamounts including the Pika and Urashima sites provided 250 estimates of MADAM ranging from 0.6 to 61 A/m (Figure 7a). Sixty-six percent indicate magnetization weaker than 10 A/m, and 12% stronger than 20 A/m. The magnetization is weak (<5 A/m) on the top of the seamount where the Pika site is situated. Relatively high magnetization (<17 A/m) is indicated on the northern slope of the seamount between the Pika and Urashima sites. At the northern foot of the seamount, low-magnetization values (<5 A/m) are concentrated around the Urashima site. This low-magnetization concentration is surrounded by an area of high magnetization larger than 10 A/m, including several very high magnetization points (~60 A/m) near the northeastern edge of the survey area.
The magnetization is also very high (~54 A/m) on the southwestern side of the seamount where small conical mounds are observed.
The video records show fresh lavas, sediment-covered lavas, debris and breccia, and hydrothermal material in the area of the off-axis seamounts. Sulfide sediments and both active and dead chimneys were seen near the Pika site (Figures 7b and 7c). Dead chimneys were scattered within a few 100 m of the top of the seamount.
Sediment-covered lavas were distributed just south of the Pika site (Figures 7b and 7d), and active chimneys, many dead chimneys, and sulfide deposits were observed at the Urashima site (Figures 7b and 7e). Sediment- covered lavas were distributed widely outside the hydrothermal areas (Figures 7b and 7f ), and debris and breccia observed on the slope between the Pika and Urashima sites (Figures 7b, 7g, and 7h). An extensive area of fresh pillow lavas was discovered on the southwestern side of the seamount (Figures 7b, 7i, and 7j).
Thefive investigated hydrothermalfields in the SMT are clearly associated with a low MADAM (Figure 1b):
essentially, the three off-axis sites appear almost nonmagnetic. Only the Yamanaka site is not associated Figure 4.Analysis of the (left column) northern, (middle column) eastern, (right column) and downward components of the magnetic anomaly. From top to bottom:
observed (black line) and synthetic (red line) magnetic anomaly intensity, coherency (yellow circles), phase (blue circles), magnetization (green circles), and vehicle altitude (black line). Circles with black solid rims are those considered reliable (coherency>0.3 on at least two components).
Journal of Geophysical Research: Solid Earth
10.1002/2014JB011714with a clear zone of weak magnetization, but the estimated MADAM values are relatively lower (27–46 A/m) than those of the nearby volcanic mound (~116 /m) (Figures 5a and 5b).
While the hydrothermal areas are characterized by weak magnetization, the areas covered by lavas often display strong magnetization (with one exception, discussed below). Extremely high magnetizations are Figure 5.Results from the axial area including the Snail and Yamanaka sites. (a) Distribution of magnetic-anomaly-derived absolute magnetization (MADAM).
Magnetization intensity is shown by the rainbow colors of the outer circles and polarity shown by the black and white colors of the inner circles. Black and white circles mean normal and reverse polarity, respectively. Background: contoured and shaded bathymetry. (b) Geological observation along dive tracks. Photographs of (c) hydrothermal site Snail, (d) fresh pillow lava around the Snail site, (e) hydrothermal site Yamanaka, (f) fresh pillow lava near the Yamanaka site, and (g) fractured lavas west of the neovolcanic zones.
associated with fresh pillow lavas along the NVZ, outside the Snail and Yamanaka sites (Figures 5a and 5b), and on the southwestern part of the off-axis seamount (Figures 7a and 7b). The areas of fractured lavas in the axial zone also exhibit relatively strong magnetization (>10 A/m) (Figures 5a and 5b). In addition, the MADAM values in the area of sediment-covered lavas near the Archean mound and Urashima are relatively high (>10 A/m) (Figures 6a and 6b, and 7a and 7b). A notable exception is the western topographic high in the spreading center (12°56′52″N, 143°36′57″E), which is surrounded by an area of low magnetization (Figures 5a and 5b). In this area, fractured lavas are widespread (Figure 5b) and numerous regional normal faults resulting from tectonic deformation are observed [Yoshikawa et al., 2012]. Thus, it would be expected that many fissures enable seawater to permeate the lavas and subseafloor crust, promoting low-temperature alteration of the volcanic layer and therefore reducing crustal magnetization.
Figure 6.Results from the off-axis area including the Archean sites. (a) Distribution of magnetic-anomaly-derived absolute magnetization (MADAM). Intensity is shown by the rainbow colors of the outer circles and polarity shown by the black and white colors of the inner circles. Black and white circles mean normal and reverse polarity, respectively. Background: contoured and shaded bathymetry. (b) Geological observations along dive tracks. Photographs of (c) hydrothermal site Archean, (d) debris and breccia around the Archean site, and (e) sediment-covered lavas around the Archean site.
Journal of Geophysical Research: Solid Earth
10.1002/2014JB0117145.2. Evaluation of MADAM by Comparison With NRM Measurements
Several methods have been developed to invert magnetic anomalies into equivalent magnetization [e.g., Parker and Huestis, 1974]. Because of the intrinsic nonuniqueness of the potentialfield problem, an infinite number of solutions exist: an annihilator, i.e., a distribution of magnetization that produces no anomaly in the geometry of the experiment, can be determined and added in any amount to a given solution to produce an infinity of other solutions. On the other hand, our forward scheme provides estimates of absolute magnetization of the shallow subseafloor (MADAM), which can be directly compared with the magnetization borne by rock samples, i.e., the NRM of lavas. The thickness of effective source is generally up to 30 m for our experiment design, in which data were mostly acquired at an altitude of ~10 m Figure 7.Results from the axial area including the Pika and Urashima sites. (a) Distribution of magnetic-anomaly-derived absolute magnetization (MADAM). Intensity is shown by the rainbow colors of the outer circles and polarity shown by the black and white colors of the inner circles. Black and white circles mean normal and reverse polarity, respectively. Background: contoured and shaded bathymetry. (b) Geological observations along dive tracks. Photographs of (c) hydrothermal site Pika, (d) sediment-covered lavas near the Pika site, (e) hydrothermal site Urashima, (f) sediment-covered lavas around the Urashima site, (g and h) debris and breccia between the Pika and Urashima sites, and (i and j) fresh pillow lava on the southwestern slope of the off-axis seamount.
(Figure 3). NRM measurements were reported by Mochizuki et al. [2012]
on samples from our study area: 19 volcanic rocks collected during nine Shinkai 6500 dives in various places and seven seafloor cores obtained using benthic multicores. From the rock and core samples 2 cm specimens were drilled in the laboratory. NRMs of the specimens were measured using a spinner magnetometer (Natsuhara Giken) at Kumamoto University. NRM measurements were performed on specimens of 11 samples from the axial area, 7 samples from the off-axis area, and 8 samples from the off-axis seamount area. For the sake of comparison, we averaged 2 to 39 MADAM values around each rock sampling location within a 50 m radius (100 m radius for five sampling locations), and the averages were compared with the NRM values (Figure 8). It can be seen that the MADAM determinations are generally consistent with the NRM values.
It is observed that NRM of rock samples tend to be larger for higher values (>10 A/m) than MADAM and smaller for lower values. The former signature is explained by the grain size distribution of lavaflows. The NRM measured on rock samples reflects the magnetization of lavaflows, whereas MADAM characterizes the sources located within the shallow subseafloor. Due to the quicker cooling, magnetic grain size is smaller in lava outcrops than in the subseafloor, and its NRM is stronger [e.g.,Marshall and Cox, 1971;Kent and Gee, 1996], suggesting high values of NRM on samples collected from the lava surface. The latter signature might be affected by the degree of low-temperature oxidation of titanomagnetite. A wide range of magnetization intensity is observed for the results of both MADAM and NRM of the rocks samples, from just a few to several tens of A/m. This is primarily due to low-temperature oxidation, which causes an exponential reduction of NRM of lavaflows with age [e.g.,Irving, 1970;Johnson and Atwater, 1977;Gee and Kent, 1994;Zhou et al., 2001]. This process must be faster on the surface than in the interior of the lavas, resulting in weaker NRM than MADAM of the rock samples when both values are low (<10 A/m).
The maximum value of MADAM in the axial area is extremely high compared to the values from previous study of magnetic anomaly [Honsho et al., 2009] and rock samples [e.g.,Gee and Kent, 1994;Zhou et al., 2001]. However, we adopted all MADAM estimations, up to 116 A/m for interpretation, based on following two reasons: (1) the reliability of MADAM estimations is confirmed by comparison with rock NRM values collected at very close places as mentioned above (Figure 8) and (2) rock NRM values in the axial area are also extremely high (>100 A/m in one site and 70–90 A/m in four sites). Moreover, 12 specimens of rock samples show NRM values higher than 100 A/m.
5.3. Comparison of MADAM With Equivalent Magnetization From AUV Data
A distribution of equivalent magnetization (EM) was computed using magnetic anomaly data collected by the AUV Urashima in 2009 during YK09-08 [Nogi et al., 2011]. The EM was estimated by a spectral inversion method [Parker and Huestis, 1974;Macdonald et al., 1980] using the vertical component of the anomaly, assuming a thickness of 250 m for the magnetized layer and a magnetization direction parallel to the axial dipolefield [Nogi et al., 2011;Nakamura et al., 2013]. Because the AUV survey was conducted at an altitude of ~100 m above the seafloor, the EM from the AUV data likely reflects the wider and deeper crustal Figure 8.Comparison between magnetic-anomaly-derived absolute
magnetization (MADAM) and natural remanent magnetization (NRM) measured on rock samples [Mochizuki et al., 2012]. Circles and squares show NRM data set from samples collected by submersible and seafloor coring, respectively. Error bars ofxandyaxes show standard deviations of NRM values and MADAM estimates for each point, respectively.
Journal of Geophysical Research: Solid Earth
10.1002/2014JB011714structures than the MADAM estimates from our HOV study. The MADAM distribution is generally consistent with the large-scale structures depicted by the EM in all the surveyed areas (Figure 9).
In the axial area, both the EM and MADAM values are highest along the NVZ, especially in the central volcanic mound (12°56′52″N, 143°36′57″E), and on the southern volcanic edifice where fresh lavas are observed (Figure 9a). A zone of high EM is aligned NE-SW, consistent with the distribution of high MADAM on crossing dive tracks, suggesting recent lava flows. Far from the NVZ, both MADAM and EM are lower, especially near the western topographic high in the fault zone (Figure 9a). Next to the Snail site, relatively low values of both EM and MADAM align along a NNE-SSW trend.
While the lowest values of both EM and MADAM are recognized on the top of the Archean mound, higher values are consistently distributed around the mound (Figure 9b). In particular, the highest values of both EM and MADAM are located on the western and southwestern sides of the mound, suggesting that younger lavaflows erupted on the surrounding older and rugged seafloor [Yoshikawa et al., 2012].
In the off-axis seamount area, high values of EM are located on its northeastern and westernflanks, consistent with the MADAM distribution (Figure 9c). In contrast, low values of both MADAM and EM are located on the Pika and Urashima sites. Moreover, according to the EM map, these sites appear located within a continuous low-magnetization zone, whereas they can be distinguished as two separate lows on the MADAM results. This observation confirms that near-seafloor magnetic measurements using HOVs help to characterize small-scale features that would remain undetected with AUV surveys.
Figure 9.Comparison between magnetic-anomaly-derived absolute magnetization (MADAM) from HOV profile and equivalent magnetization (EM) from AUV survey [Nogi et al., 2011]. MADAM plots are those shown in Figures 5–7. (a) On-axis area, including the Snail and Yamanka sites; (b) off-axis area at the foot of the axial high, including the Archean site; (c) off-axis seamount area, including the Pika and Urashima sites.
6. Discussion
6.1. A Similar Magnetic Signature for Lava-Hosted Hydrothermal Sites
Zones of weak or null magnetization associated with hydrothermal sites have been commonly observed at MORs, e.g., on the trans-Atlantic geotraverse (TAG)field in the northern MAR [Tivey et al., 1993], Endeavour Field in the Juan de Fuca Ridge [Tivey and Johnson, 2002], and Comfortless Cove and Red Lionfields in the southern MAR [German et al., 2008]. These hydrothermal systems are hosted in basalt, whereas the SMT hydrothermal systems are mostly hosted in andesite. Although the mineral compositions of basalt and andesite are different, as are probably also the types and amounts of their magnetic minerals, the magnetic signature of andesite-hosted back-arc hydrothermal systems is basically the same as that of basalt-hosted MOR systems. Such zones of weak magnetization are not only observed in the basaltic- andesite-hosted or andesite-hosted hydrothermalfields of the SMT (Figures 5–7) but also in other back-arc hydrothermal systems such as the basalt to andesite-hosted hydrothermalfields of the Palinuro volcano on the Marsili back-arc basin [Caratori-Tontini et al., 2014], the Hakurei hydrothermal field hosted in andesite to dacite rocks on the Izu-Ogasawara back-arc rift zone [Honsho et al., 2013], and dacite to rhyodacite-hosted hydrothermalfields of the Brothers volcano on the Kermadec arc [Caratori-Tontini et al., 2012a, 2012b]. These observations suggest that lava-hosted hydrothermal sites with wide range of hosted volcanic rock types (basalt to rhyodacite) yield a similar magnetic signature, i.e., a magnetic anomaly reflecting a zone of weak or null magnetization.
6.2. Processes Causing the Weak Magnetization Zones at Lava-Hosted Hydrothermal Sites
All five back-arc hydrothermal sites investigated in the SMT are clearly associated with low crustal magnetization (Figures 5–7). Any of the following could be a cause for such a signature: (1) thermal demagnetization, where hotfluid heats the surrounding lava above the Curie temperature of its magnetic minerals [Wooldridge et al., 1992]; (2) hydrothermal alteration, in which volcanogenic magnetic minerals, such as titanomagnetite, are replaced by nonmagnetic minerals within the up-flow zone [Johnson et al., 1982;Hall, 1992]; and/or (3) the presence of nonmagnetic hydrothermal deposits [Szitkar et al., 2014a]. In the off-axis area, inactive hydrothermal areas also exhibit reduced magnetizations (Figures 6 and 7), confirming that the alteration of the magnetic minerals and/or the presence of nonmagnetic hydrothermal deposits rather than thermal demagnetization are the major processes leading to the reduced magnetization. The narrow zones of low magnetization are centered on vent areas; moreover, low-magnetization zones are confirmed in both HOV (~10 m altitude) and AUV (~100 m altitude) results, indicating the presence of low-magnetization source at depths from near seafloor to hundreds of meters.
The modeling study of the magnetization zone in the TAG hydrothermal site proposed a pipe-like source body with a radius of 100 m [Tivey et al., 1993; Tivey and Dyment, 2010; Szitkar and Dyment, 2015]. The horizontal extent of this narrow pipe-like body is comparable to our investigated sites and also to the stockwork zones found in volcanogenic massive sulfide deposits such as Cyprus ophiolite [e.g.,Johnson et al., 1982]. These observations potentially suggest that the zones of reduced or null magnetization of hydrothermal sites in SMT are either up-flow zones of hydrothermalfluid beneath separate vent systems in the uppermost crust or accumulations of sulfide deposits associated with each vent system.
6.3. Duration of Hydrothermal Activity and Size of Weak Magnetization Zone
In the SMT, we observe that the spatial extent of the low-magnetization zone differs depending on the on- or off-axis location of the sites (Figure 10). Low-magnetization zones at the on-axis sites of Snail and Yamanaka are ~30 m in diameter, whereas they are ~120 m at the off-axis sites of Archean, Pika, and Urashima. This difference is probably a consequence of a longer duration of hydrothermal activity.
Both the Snail and Yamanaka sites are located in the NVZ. Gravity data suggest a relatively thick crust (~6.8 km) in the 12.7–13.5°N segment, i.e., a stronger magmatic activity with sheet-like mantle upwelling [Kitada et al., 2006]. Moreover, a seismic refraction study reveals that such upwelling is characterized by a zone of low seismic velocity 1.5 km below the seafloor, beneath the axial area in this region [Sato et al., 2015]. A magma chamber was detected 15 km northeast along the spreading axis at ~3 km depth during a reflection seismic study [Becker et al., 2010]. Therefore, the heat source for the Snail and Yamanaka hydrothermal activity is probably episodic dike intrusion at the spreading axis, similar to the fast-spreading East Pacific Rise hydrothermal systems, where vent site activity might be controlled by dike intrusion over
Journal of Geophysical Research: Solid Earth
10.1002/2014JB011714decadal timescales [e.g.,German and Lin, 2004]. Such a form of heat supply sustains hydrothermal circulations in an episodic manner, and the hydrothermal areas tend to be small in the axial area.
On the other hand, the Archean site is located 2 km from the NVZ, and although there is no direct information regarding the heat source for this site, the existence of a large hydrothermal mound indicates a stronger hydrothermalflux or a longer duration of hydrothermal circulation. Radiometric dating showed that the maximum age of the sulfide deposits from the Archean site is at least ~3500 years [Takamasa et al., 2013;
Ishibashi et al., 2015], substantiating the presence of long-lived hydrothermal activity.
Both the Pika and Urashima sitesfind their heat source in the off-axis volcanism forming the seamount on which they are located. The off-axis eruption is confirmed by the observation of fresh lavas with high magnetization in this study (Figures 7a, 7b, 7i, and 7j), and the high seismic velocity structure [Sato et al., 2015]. The off-axis volcano covers an area of more than several tens of square kilometers with a maximum height of ~400 m. This off-axis volcanism is probably a long-lived heat source, extending both during the formation and cooling of the seamount.Sato et al. [2015] showed that the seismicity around the off-axis volcano was very low during the observation period of 3 months, suggesting that volcanism might have ceased. Sulfide chimneys and debris/breccia collected from these sites also indicates an age of up to
~9000 years [Ishibashi et al., 2015]. The growth of the Pika and Urashima hydrothermal sites might therefore be in their late stage.
The hydrothermal alteration zones and hydrothermal deposit zones grow with age and continuous hydrothermal activity, which in turn is controlled by the heat source, i.e., the magmatic activity. Long-lived and giant hydrothermal sites have been reported in slow and ultraslow spreading environments, e.g., the TAG field, controlled by tectonic faults associated with a low-angle detachment fault [e.g., Tivey and Dyment, 2010], or the largefield discovered at 49°39′E on the Southwest Indian Ridge [Zhu et al., 2010]. In Figure 10.Distribution of magnetic-anomaly-derived absolute magnetization aroundfive hydrothermalfields of the southern Mariana Trough, represented at the same scale: (a) Sites Snail, (b) Yamanaka, (c) Archean, (d) Urashima, and (e) Pika. Red circles denote magnetization intensity>10 A/m, blue circles 5–10 A/m, and purple circles<5 A/m. Brown lines show submersible dive tracks. Isobaths of the background are plotted for every 10 m (thin lines) and 50 m (thick lines).
contrast, the hydrothermal systems in the SMT are not associated with large fault systems cutting across the deeper crust and uppermost mantle, as suggested by the bathymetry and the very low seismicity [Sato et al., 2015]. Thefive studied hydrothermalfields investigated are primarily controlled by magmatic activity.
7. Conclusions
We applied a method based on the comparison of near-seafloor three-component magnetic anomaly data with 3-D forward modeling approach in the spectral domain to estimate absolute crustal magnetization of the shallow subseafloor aroundfive hydrothermal sites of the SMT. The analysis of these magnetic-anomaly-derived absolute magnetizations (MADAMs) leads to the following conclusions:
1. The five hydrothermal vent fields of the back-arc spreading region in the SMT are characterized by low-intensity magnetization generally lower than 5 A/m in the off-axis area. The hydrothermal alteration of magnetic minerals present in the extrusive lavas and/or the deposits of nonmagnetic hydrothermal material is responsible for the reduced magnetization of these zones.
2. The MADAM estimates are generally consistent with the NRM values of rock samples from the seafloor of the same region, although the NRM values tend to be larger than the MADAM estimates for higher values and smaller for lower values. The former difference might reflect variations in magnetic grain size: fast cooling results in smaller grain size, and therefore, stronger NRM is observed for the outcropping rock samples with respect to the bulk MADAM estimates. The latter difference might reflect the difference in degree of low-temperature oxidation: indeed, the low-temperature oxidation of outcropping rock is higher than that of the subseafloor; therefore, the NRM values could be weaker than the MADAM values.
3. The distribution of MADAM estimates is generally consistent with equivalent magnetizations deduced from AUV surveys, although the resolution of the former is higher than the latter. For instance, the individual magnetic signatures of the Pika and Urashima sites could only be detected using high-resolution near-seafloor measurements undertaken by the HOV.
4. Basalt to andesite and andesite-hosted hydrothermal systems of the southern Mariana back arc are characterized by low magnetization, as are the andesite to rhyodacite-hosted hydrothermal systems of the Marsili back-arc, Izu-Ogasawara back-arc rift, and Kermadec arc. This suggests that lava-hosted hydrothermal sites in arc/back-arc hydrothermal fields have a magnetic signature similar to the basalt-hosted sites in MOR setting.
5. The off-axis hydrothermal vent sites are larger than the on-axis sites, reflecting the longevity of the hydrothermal activity. The Snail and Yamanaka sites, both located in the axial area, are likely controlled by dike intrusions over decadal timescales, whereas the Archean, Pika, and Urashima sites are likely con- trolled by off-axis magmatic activity over thousands of years.
Near-seafloor magnetic imaging of submarine hydrothermal systems provides important constraints to detect and study present and past hydrothermal activity, both in back-arc basins and at MORs.
References
Ade-Hall, J. M., H. C. Palmer, and T. P. Hubbard (1971), The magnetic and opaque petrological response of basalts to regional hydrothermal alteration,Geophys. J. R. Astron. Soc.,24, 137–174, doi:10.1111/j.1365-246X.1971.tb02171.x.
Amante, C., and B. W. Eakins (2009), ETOPO1 1 arc-minute global relief model: Procedures, data sources and analysis,NOAA Tech. Memo.
NESDIS NGDC-24,19 pp.
Asada, M., A. Deschamps, T. Fujiwara, and Y. Nakamura (2007), Submarine lavaflow emplacement and faulting in the axial valley of two morphologically distinct spreading segments of the Mariana back-arc basin from Wadatsumi side-scan sonar images,Geochem. Geophys.
Geosyst.,8, Q04001, doi:10.1029/2006GC001418.
Becker, N. C., P. Fryer, and G. F. Moore (2010), Malaguana-Gadao Ridge: Identification and implications of a magma chamber reflector in the southern Mariana Trough,Geochem. Geophys. Geosyst.,11, Q04X13, doi:10.1029/2009GC002719.
Bhattacharyya, B. (1964), Magnetic anomalies due to prism-shaped bodies with arbitrary polarization,Geophysics,29, 517–531, doi:10.1190/
1.1439386.
Caratori-Tontini, F., B. W. Davy, C. E. J. de Ronde, R. W. Embley, M. Leybourne, and M. A. Tivey (2012a), Crustal magnetization of Brothers volcano, New Zealand, measured by autonomous underwater vehicles: Geophysical expression of a submarine hydrothermal system, Econ. Geol.,107, 1571–1581.
Caratori-Tontini, F., C. de Ronde, D. Yoerger, J. Kinsey, and M. Tivey (2012b), 3-D focused inversion of near-seafloor magnetic data with application to the Brothers volcano hydrothermal system, Southern Pacific Ocean, New Zealand,J. Geophys. Res.,117, B10102, doi:10.1029/2012JB009349.
Caratori-Tontini, F., G. Bortoluzzi, C. Carmisciano, L. Cocchi, C. E. J. de Ronde, M. Ligi, and F. Muccini (2014), Near-bottom magnetic signatures of submarine hydrothermal systems at Marsili and Palinuro volcanoes, southern Tyrrhenian Sea, Italy,Econ. Geol.,109, 2119–2128.
Corliss, J. B., et al.(1979), Submarine thermal springs on the Galápagos Rift,Science,203, 1073–1083, doi:10.1126/science.203.4385.1073.
Acknowledgments
We are grateful to the crew of the R/V Yokosukaand the support teams of HOV Shinkai 6500 and AUV Urashima for their support during the observation cruise by the Japan Agency for Marine-Earth Science and Technology. We thank J. Miyazaki, S. Kojima, and the onboard scientists of the YK10-11 and YK10-11 cruises for their help during the acquisition and processing of the data and for permission to use the video and still camera data. We express our appreciation to Y. Nogi for providing the unpublished AUV magnetization data.
We thank C. Tamura for her technical support on setting up the deep-sea three-component magnetometer and N. Seama for helpful discussions. The manuscript has been significantly improved by the comments of F. Caratori-Tontini and an anonymous reviewer. This study was supported by the Ministry of Education, Culture, Sports, Science and Technology (MEXT), Grant-in-Aid for Scientific Research on Innovative Areas“Project TAIGA;
Trans-crustal Advection and In situ biogeochemical process of Global sub-seafloor Aquifer”(20109002), and the Japan Society for the Promotion of Science (JSPS) Grants-in-Aid for a JSPS fellow. J.D. thanks CNRS-INSU for a PICS, which allowed the pursuit of French-Japanese cooperation on this topic. An InterRidge Fellowship granted to F.S. in 2013 further helped this cooperation. The GMT software package [Wessel and Smith, 1998] was used to analyze the data and build thefigures.
Journal of Geophysical Research: Solid Earth
10.1002/2014JB011714Deschamps, A., and T. Fujiwara (2003), Asymmetric accretion along the slow-spreading Mariana Ridge,Geochem. Geophys. Geosyst.,4(10), 8622, doi:10.1029/2003GC000537.
Dyment, J., K. Tamaki, H. Horen, Y. Fouquet, K. Nakase, M. Yamamoto, M. Ravilly, and M. Kitazawa (2005), A positive magnetic anomaly at rainbow hydrothermal site in ultramafic environment,Eos Trans. AGU,86(52), Fall Meet. Suppl., Abstract OS21C-08.
Elderfield, H., and A. Schultz (1996), Mid-ocean ridge hydrothermalfluxes and the chemical composition of the ocean,Annu. Rev. Earth Planet. Sci.,24, 191–224, doi:10.1146/annurev.earth.24.1.191.
Fujiwara, T., and H. Fujimoto (1998), Seafloor geomagnetic vector anomaly of the intersection of the Mid-Atlantic Ridge and the Kane Transform Fault: Implications for magnetization of the oceanic crust,J. Geophys. Res.,103(B12), 30,335–30,349, doi:10.1029/
1998JB900015.
Gee, J., and D. V. Kent (1994), Variations in layer 2A thickness and the origin of the central anomaly magnetic high,Geophys. Res. Lett.,21(4), 297–300, doi:10.1029/93GL03422.
Gee, J., S. Webb, J. Ridgway, H. Staudigel, and M. Zumberge (2001), A deep-tow magnetic survey of Middle Valley, Juan de Fuca Ridge, Geochem. Geophys. Geosyst.,2, doi:10.1029/2001GC000170.
German, C. R., and J. Lin (2004), The thermal structure of the oceanic crust, ridge-spreading and hydrothermal circulation: How well do we understand their inter-connections?, inMid-Ocean Ridges: Hydrothermal Interactions Between the Lithosphere and Oceans,Geophys.
Monogr. Ser., vol. 148, edited by C. R. German et al., pp. 1–18, AGU, Washington, D. C., doi:10.1029/148GM01.
German, C. R., et al.(2008), Hydrothermal activity on the southern Mid-Atlantic Ridge: Tectonically- and volcanically-controlled venting at 4–5°S,Earth Planet. Sci. Lett.,273, 332–344, doi:10.1016/j.epsl.2008.06.048.
Granot, R., J. Dyment, and Y. Gallet (2012), Geomagneticfield variability during the Cretaceous Normal Superchron,Nat. Geosci.,5(3), 220–223, doi:10.1038/ngeo1404.
Hall, J. M. (1992), Interaction of submarine volcanic and high-temperature hydrothermal activity proposed for the formation of the Agrokipia, volcanic massive sulfide deposits of Cyprus,Can. J. Earth Sci.,29, 1928–1936, doi:10.1139/e92-150.
Hannington, M., J. Jamieson, T. Monecke, S. Petersen, and S. Beaulieu (2011), The abundance of seafloor massive sulfide deposits,Geology,39, 1155–1158, doi:10.1130/G32468.1.
Honsho, C., J. Dyment, K. Tamaki, M. Ravilly, H. Horen, and P. Gente (2009), Magnetic structure of a slow spreading ridge segment: Insights from near-bottom magnetic measurements on board a submersible,J. Geophys. Res.,114, B05101, doi:10.1029/2008JB005915.
Honsho, C., T. Ura, and K. Kim (2013), Deep-sea magnetic vector anomalies over the Hakurei hydrothermalfield and the Bayonnaise knoll caldera, Izu-Ogasawara arc, Japan,J. Geophys. Res. Solid Earth,118, 5147–5164, doi:10.1002/jgrb.50382.
Hussong, D. M., and S. Uyeda (1982), Tectonic processes and the history of the Mariana Arc: A synthesis of the results of deep-sea drilling project Leg 60,Initial Rep. Deep Sea Drill. Proj.,60, 909–929.
International Association of Geomagnetism and Aeronomy Working Group V-MOD (2010), International Geomagnetic Reference Field:
The eleventh generation,Geophys. J. Int.,183, 1216–1230, doi:10.1111/j.1365-246X.2010.04804.x.
Iizasa, K., et al. (1999), A Kuroko-type polymetallic sulfide deposit in a submarine silicic Caldera,Science,283, 975–977, doi:10.1126/
science.283.5404.975.
Irving, E. (1970), The Mid-Atlantic Ridge at 45° N. XIV. Oxidation and magnetic properties of basalt: Review and discussion,Can. J. Earth Sci., 7(6), 1528–1538, doi:10.1139/e70-144.
Isezaki, N. (1986), A new shipboard three-component magnetometer,Geophysics,51, 1992–1998, doi:10.1190/1.1442054.
Ishibashi, J., and T. Urabe (1995), Hydrothermal activity related to arc-backarc magmatism in the western Pacific, inBackarc Basins: Tectonics and Magmatism, edited by B. Taylor, pp. 451–495, Springer, New York, doi:10.1007/978-1-4615-1843-3_13.
Ishibashi, J., et al.(2004), Geochemistry of hydrothermalfluids in south Mariana backarc spreading center,Eos Trans. AGU,85(52), Fall Meet.
Suppl., Abstract V44A-05.
Ishibashi, J., et al.(2015), Dating of hydrothermal mineralization in active hydrothermalfields in the southern Mariana Trough, inSubseafloor Biosphere Linked to Global Hydrothermal Systems: TAIGA Concept, edited by J. Ishibashi, K. Okino, and M. Sunamura, pp. 289–300, Springer, Japan, doi:10.1007/978-4-431-54865-2_23.
Johnson, H. P., and T. Atwater (1977), Magnetic study of basalts from the Mid-Atlantic Ridge, lat 37°N,Geol. Soc. Am. Bull.,88(5), 637–647, doi:10.1130/0016-7606(1977)88<637:MSOBFT>2.0.CO;2.
Johnson, H. P., J. L. Karsten, F. J. Vine, G. C. Smith, and G. Schonharting (1982), Low-level magnetic survey over a massive sulfide ore body in the Troodos ophiolite complex, Cyprus,Mar. Technol. Soc. J.,16, 76–80.
Kakegawa, T., M. Utsumi, and K. Marumo (2008), Geochemistry of sulfide chimneys and basement pillow lavas at the southern Mariana Trough (12.55°N–12.58°N),Resour. Geol.,58, 249–266.
Kent, D. V., and J. Gee (1996), Magnetic alteration of zero-age oceanic basalt,Geology,24(8), 703–706, doi:10.1130/0091-7613(1996) 024<0703:MAOZAO>2.3.CO;2.
Kitada, K., N. Seama, T. Yamazaki, Y. Nogi, and K. Suyehiro (2006), Distinct regional differences in crustal thickness along the axis of the Mariana Trough, inferred from gravity anomalies,Geochem. Geophys. Geosyst.,7, Q04011, doi:10.1029/2005GC001119.
Macdonald, K. C., S. P. Miller, S. P. Huestis, and F. N. Spiess (1980), Three-dimensional modeling of a magnetic reversal boundary from inversion of deep-tow measurements,J. Geophys. Res.,85, 3670–3680, doi:10.1029/JB085iB07p03670.
Marshall, M., and A. Cox (1971), Magnetism of pillow basalts and their petrology,Geol. Soc. Am. Bull.,82(3), 537–552, doi:10.1130/0016-7606 (1971)82[537:MOPBAT]2.0.CO;2.
Martínez, F., P. Fryer, and N. Becker (2000), Geophysical characteristics of the southern Mariana Trough, 11°50′N–13°40′N,J. Geophys. Res., 105, 16,591–16,607, doi:10.1029/2000JB900117.
McKenzie, D., and C. Bowin (1976), The relationship between bathymetry and gravity in the Atlantic Ocean,J. Geophys. Res.,81, 1903–1915, doi:10.1029/JB081i011p01903.
Mochizuki, N., N. Yoshifumi, M. Asada, S. Yoshikawa, and K. Okino (2012), Decay of natural remanent magnetization of oceanic basalt on the back-arc spreading axis of the southern Mariana,Eos Trans. AGU,92(52), Fall Meet. Suppl., Abstract T43D-2705.
Nakamura, K., T. Toki, N. Mochizuki, M. Asada, J. Ishibashi, Y. Nogi, S. Yoshikawa, J. Miyazaki, and K. Okino (2013), Discovery of a new hydrothermal vent based on an underwater, high-resolution geophysical survey,Deep Sea Res., Part I,74, 1–10, doi:10.1016/j.dsr.2012.12.003.
Nogi, Y., N. Mochizuki, K. Okino, and M. Asada (2011), Near-bottom magnetic surveys around hydrothermal sites in the southern Mariana Trough,Eos Trans. AGU,93(52), Fall Meet. Suppl., Abstract GP41A-0993.
Okino, K., Y. Ohara, S. Kasuga, and Y. Kato (1999), The Philippine Sea: New survey results reveal the structure and the history of the marginal basins,Geophys. Res. Lett.,26, 2287–2290, doi:10.1029/1999GL900537.
Oufi, O., M. Cannat, and H. Horen (2002), Magnetic properties of variably serpentinized abyssal peridotites,J. Geophys. Res.,107(5), 2095, doi:10.1029/2001JB000549.
Parker, R. L., and S. P. Huestis (1974), The inversion of magnetic anomalies in the presence of topography,J. Geophys. Res.,79(11), 1587–1593, doi:10.1029/JB079i011p01587.
Pouliquen, G., Y. Gallet, J. Dyment, P. Patriat, and C. Tamura (2001), A geomagnetic record over the last 3.5 million years from deep-tow magnetic anomaly profiles across the Central Indian Ridge,J. Geophys. Res.,106(B6), 10,941–10,960, doi:10.1029/2000JB900442.
Rona, P. A. (1978), Magnetic signatures of hydrothermal alteration and volcanogenic mineral deposits in oceanic crust,J. Volcanol. Geotherm.
Res.,3, 219–225, doi:10.1016/0377-0273(78)90010-0.
Rona, P. A. (2008), The changing vision of marine minerals,Ore Geol. Rev.,33(3–4), 618–666, doi:10.1016/j.oregeorev.2007.03.006.
Sager, W. W., C. J. Weiss, M. A. Tivey, and H. P. Johnson (1998), Geomagnetic polarity reversal model of deep-tow profiles from the Pacific Jurassic Quiet Zone,J. Geophys. Res.,103(B3), 5269–5286, doi:10.1029/97JB03404.
Sato, T., K. Okino, and H. Kumagai (2009), Magnetic structure of an oceanic core complex at the southernmost Central Indian Ridge: Analysis of shipboard and deep-sea three-component magnetometer data,Geochem. Geophys. Geosyst.,10, Q06003, doi:10.1029/2008GC002267.
Sato, T., M. Mizuno, T. Takata, T. Yamada, T. Isse, K. Mochizuki, M. Shinohara, and N. Seama (2015), Seismic structure and seismicity in the southern Mariana Trough and their relation to hydrothermal activity, inSubseafloor Biosphere Linked to Global Hydrothermal Systems:
TAIGA Concept, edited by J. Ishibashi, K. Okino, and M. Sunamura, pp. 229–240, Springer, Japan, doi:10.1007/978-4-431-54865-2_18.
Seama, N., H. Sato, Y. Nogi, and K. Okino (2015), The mantle dynamics, the crustal formation, and the hydrothermal activity of the southern Mariana Trough back-arc Basin, inSubseafloor Biosphere Linked to Global Hydrothermal Systems: TAIGA Concept, edited by J. Ishibashi, K. Okino, and M. Sunamura, pp. 215–227, Springer, Japan, doi:10.1007/978-4-431-54865-2_17.
Seno, T., and S. Maruyama (1984), Paleogeographic reconstruction and origin of the Philippine Sea,Tectonophysics,102, 53–84, doi:10.1016/
0040-1951(84)90008-8.
Stein, C. A., and S. Stein (1992), A model for the global variation in oceanic depth and heatflow with lithospheric age,Nature,359, 123–129, doi:10.1038/359123a0.
Stern, R. J., M. J. Fouch, and S. L. Klemperer (2003), An overview of the Izu-Bonin-Mariana subduction factory, inInside the Subduction Factory, vol. 138, pp. 175–222, AGU, Washington, D. C.
Szitkar, F., and J. Dyment (2015), Near-seafloor magnetics reveal tectonic rotation and deep structure at TAG (Trans-Atlantic Geotraverse) hydrothermal site (Mid-Atlantic Ridge, 26°N),Geology,43, 87–90, doi:10.1130/G36086.1.
Szitkar, F., J. Dyment, Y. Fouquet, C. Honsho, and H. Horen (2014a), The magnetic signature of ultramafic-hosted hydrothermal sites,Geology, 42, 715–718, doi:10.1130/G35729.1.
Szitkar, F., J. Dyment, Y. Choi, and Y. Fouquet (2014b), What causes low magnetization at basalt-hosted hydrothermal sites? Insights from inactive site Krasnov (MAR 16°38′N),Geochem. Geophys. Geosyst.,15, 1441–1451, doi:10.1002/2014GC005284.
Takai, K., K. Nakamura, K. Suzuki, F. Inagaki, K. H. Nealson, and H. Kumagai (2006), Ultramafics-Hydrothermalism-Hydrogenesis-HyperSLiME (UltraH3) linkage: A key insight into early microbial ecosystem in the Archean deep-sea hydrothermal systems,Paleontol. Res.,10(4), 269–282, doi:10.2517/prpsj.10.269.
Takamasa, A., S. Nakai, F. Sato, S. Toyoda, D. Banerjee, and J. Ishibashi (2013), U–Th radioactive disequilibrium and ESR dating of a barite-containing sulfide crust from South Mariana Trough,Quat. Geochronol.,15, 38–46, doi:10.1016/j.quageo.2012.12.002.
Tivey, M. A. (1994), High-resolution magnetic surveys over the Middle Valley mounds, northern Juan de Fuca Ridge, inProc. Ocean Drilling Program,Sci. Results, vol. 139, edited by M. J. Mottl et al., pp. 29–35, Ocean Drill. Program, College Station, Tex.
Tivey, M. A., and J. Dyment (2010), The magnetic signature of hydrothermal systems in slow spreading environments, inDiversity of Hydrothermal Systems on Slow Spreading Ocean Ridges, vol. 188, pp. 43–66, AGU, Washington, D. C.
Tivey, M. A., and H. P. Johnson (2002), Crustal magnetization reveals subsurface structure of Juan de Fuca Ridge hydrothermal ventfields, Geology,30(11), 979–982.
Tivey, M. A., P. A. Rona, and H. Schouten (1993), Reduced crustal magnetization beneath the active sulfide mound, TAG hydrothermalfield, Mid-Atlantic Ridge at 26°N,Earth Planet. Sci. Lett.,115(1–4), 101–115, doi:10.1016/0012-821X(93)90216-V.
Tivey, M. A., H. P. Johnson, A. Bradley, and D. Yoerger (1998), Thickness of a submarine lavaflow determined from near-bottom magnetic field mapping by autonomous underwater vehicle,Geophys. Res. Lett.,25(6), 805–808, doi:10.1029/98GL00442.
Tivey, M. A., W. W. Sager, S.-M. Lee, and M. Tominaga (2006), Origin of the Pacific Jurassic Quiet Zone,Geology,34, 789–792, doi:10.1130/
G22894.1.
Urabe, T., J. Ishibashi, A. Maruyama, K. Marumo, N. Seama, and M. Utsumi (2004), Discovery and drilling of on- and off-axis hydrothermal sites in backarc spreading center of southern Mariana Trough, Western Pacific,Eos Trans. AGU,85(52), Fall Meet. Suppl., Abstract V44A-03.
Watts, A. B. (1978), An analysis of isostasy in the world’s oceans: 1. Hawaiian-Emperor Seamount Chain,J. Geophys. Res.,83(B12), 5989–6004, doi:10.1029/JB083iB12p05989.
Wessel, P., and W. H. F. Smith (1998), New, improved version of generic mapping tools released,Eos Trans., AGU,79(47), 579, doi:10.1029/
98EO00426.
Wheat, C. G., P. Fryer, S. Hulme, N. Becker, A. Curtis, and C. Moyer (2003), Hydrothermal venting in the southern most portion of the Mariana backarc spreading center at 12.57 degrees N,Eos Trans. AGU,84(52), Fall Meet. Suppl., Abstract T32A-0920.
Wooldridge, A. L., C. G. A. Harrison, M. A. Tivey, P. A. Rona, and H. Schoutens (1992), Magnetic modeling near selected areas of hydrothermal activity on the mid-Atlantic and Gorda Ridges,J. Geophys. Res.,97(B7), 10,911–10,926, doi:10.1029/92JB00605.
Yamazaki, T., N. Seama, K. Okino, K. Kitada, M. Joshima, H. Oda, and J. Naka (2003), Spreading process of the northern Mariana Trough:
Rifting-spreading transition at 22°N,Geochem. Geophys. Geosyst.,4(9), 1075, doi:10.1029/2002GC000492.
Yoshikawa, S., K. Okino, and M. Asada (2012), Geomorphological variations at hydrothermal sites in the southern Mariana Trough: Relationship between hydrothermal activity and topographic characteristics,Mar. Geol.,303–306, 172–182, doi:10.1016/j.margeo.2012.02.013.
Zhou, W., R. Van der Voo, D. R. Peacor, D. Wang, and Y. Zhang (2001), Low-temperature oxidation in MORB of titanomagnetite to titanomaghemite: A gradual process with implications for marine magnetic anomaly amplitudes,J. Geophys. Res.,106, 6409–6421, doi:10.1029/2000JB900447.
Zhu, J., J. Lin, Y. J. Chen, C. Tao, C. R. German, D. R. Yoerger, and M. A. Tivey (2010), A reduced crustal magnetization zone near thefirst observed active hydrothermal ventfield on the Southwest Indian Ridge,Geophys. Res. Lett.,37, L18303, doi:10.1029/2010GL043542.
![Figure 9. Comparison between magnetic-anomaly-derived absolute magnetization (MADAM) from HOV pro fi le and equivalent magnetization (EM) from AUV survey [Nogi et al., 2011]](https://thumb-eu.123doks.com/thumbv2/1library_info/5505988.1685958/12.918.121.807.137.694/figure-comparison-magnetic-anomaly-absolute-magnetization-equivalent-magnetization.webp)
